The table below lists all 197 countries of the world with key facts for each. Clicking on any cell value will take you to a dedicated page with detailed information on that topic for the selected country.


Global population and growth rate trends
| Year | Population | Growth rate |
|---|---|---|
| 2025 | 8,200,677,479 | 0.92% |
| 2024 | 8,126,213,183 | 0.97% |
| 2023 | 8,046,175,374 | 0.93% |
| 2022 | 7,973,176,994 | 0.87% |
| 2021 | 7,904,431,924 | 0.84% |
| 2020 | 7,838,810,464 | 0.99% |
| 2019 | 7,760,240,351 | 1.05% |
| 2018 | 7,679,517,643 | 1.08% |
| 2017 | 7,597,308,058 | 1.14% |
| 2016 | 7,511,948,585 | 1.17% |
| 2015 | 7,425,004,031 | 1.19% |
| 2014 | 7,337,682,786 | 1.21% |
| 2013 | 7,249,787,979 | 1.24% |
| 2012 | 7,161,124,406 | 1.27% |
| 2011 | 7,071,647,721 | 1.23% |
| 2010 | 6,986,041,518 | 1.22% |
| 2009 | 6,901,447,716 | 1.26% |
| 2008 | 6,815,345,933 | 1.28% |
| 2007 | 6,729,368,557 | 1.27% |
| 2006 | 6,644,911,563 | 1.28% |
| 2005 | 6,560,843,556 | 1.28% |
| 2004 | 6,477,839,701 | 1.3% |
| 2003 | 6,394,914,981 | 1.3% |
| 2002 | 6,312,737,329 | 1.32% |
| 2001 | 6,230,364,871 | 1.35% |
| 2000 | 6,147,257,987 | 1.37% |
| 1999 | 6,064,066,634 | 1.41% |
| 1998 | 5,979,634,019 | 1.45% |
| 1997 | 5,894,094,045 | 1.47% |
| 1996 | 5,808,386,437 | 1.5% |
| 1995 | 5,722,640,575 | 1.52% |
| 1994 | 5,637,217,387 | 1.55% |
| 1993 | 5,551,417,947 | 1.6% |
| 1992 | 5,464,018,612 | 1.64% |
| 1991 | 5,375,659,492 | 1.68% |
| 1990 | 5,286,561,296 | 1.76% |
| 1989 | 5,196,469,213 | 1.77% |
| 1988 | 5,106,050,474 | 1.79% |
| 1987 | 5,015,979,647 | 1.81% |
| 1986 | 4,926,742,435 | 1.79% |
| 1985 | 4,839,853,099 | 1.78% |
| 1984 | 4,755,237,877 | 1.77% |
| 1983 | 4,672,226,765 | 1.81% |
| 1982 | 4,588,973,382 | 1.83% |
| 1981 | 4,506,469,865 | 1.79% |
| 1980 | 4,426,598,170 | 1.78% |
| 1979 | 4,349,886,552 | 1.79% |
| 1978 | 4,273,532,847 | 1.77% |
| 1977 | 4,199,153,617 | 1.77% |
| 1976 | 4,126,021,141 | 1.81% |
| 1975 | 4,052,401,763 | 1.88% |
| 1974 | 3,977,727,516 | 1.95% |
| 1973 | 3,901,661,955 | 2% |
| 1972 | 3,825,183,390 | 2.02% |
| 1971 | 3,749,443,106 | 2.12% |
| 1970 | 3,671,509,833 | 2.1% |
| 1969 | 3,595,834,651 | 2.1% |
| 1968 | 3,521,802,982 | 2.07% |
| 1967 | 3,450,290,691 | 2.06% |
| 1966 | 3,380,368,096 | 2.11% |
| 1965 | 3,310,473,261 | 2.08% |
| 1964 | 3,242,999,131 | 2.11% |
| 1963 | 3,176,058,942 | 2.14% |
| 1962 | 3,109,608,946 | 1.78% |
| 1961 | 3,055,256,868 | 1.37% |
| 1960 | 3,014,165,213 | - |
Data sources: World Bank | Health (1960–2025, retrieved 2026-07-08); U.S. Census Bureau (1960–2025, retrieved 2026-07-08); Central Intelligence Agency (CIA) (1960–2025, retrieved 2026-07-08); National Statistics, Taiwan (1960–2025, retrieved 2026-07-08).
GeoRank.org/facts | CC BY 
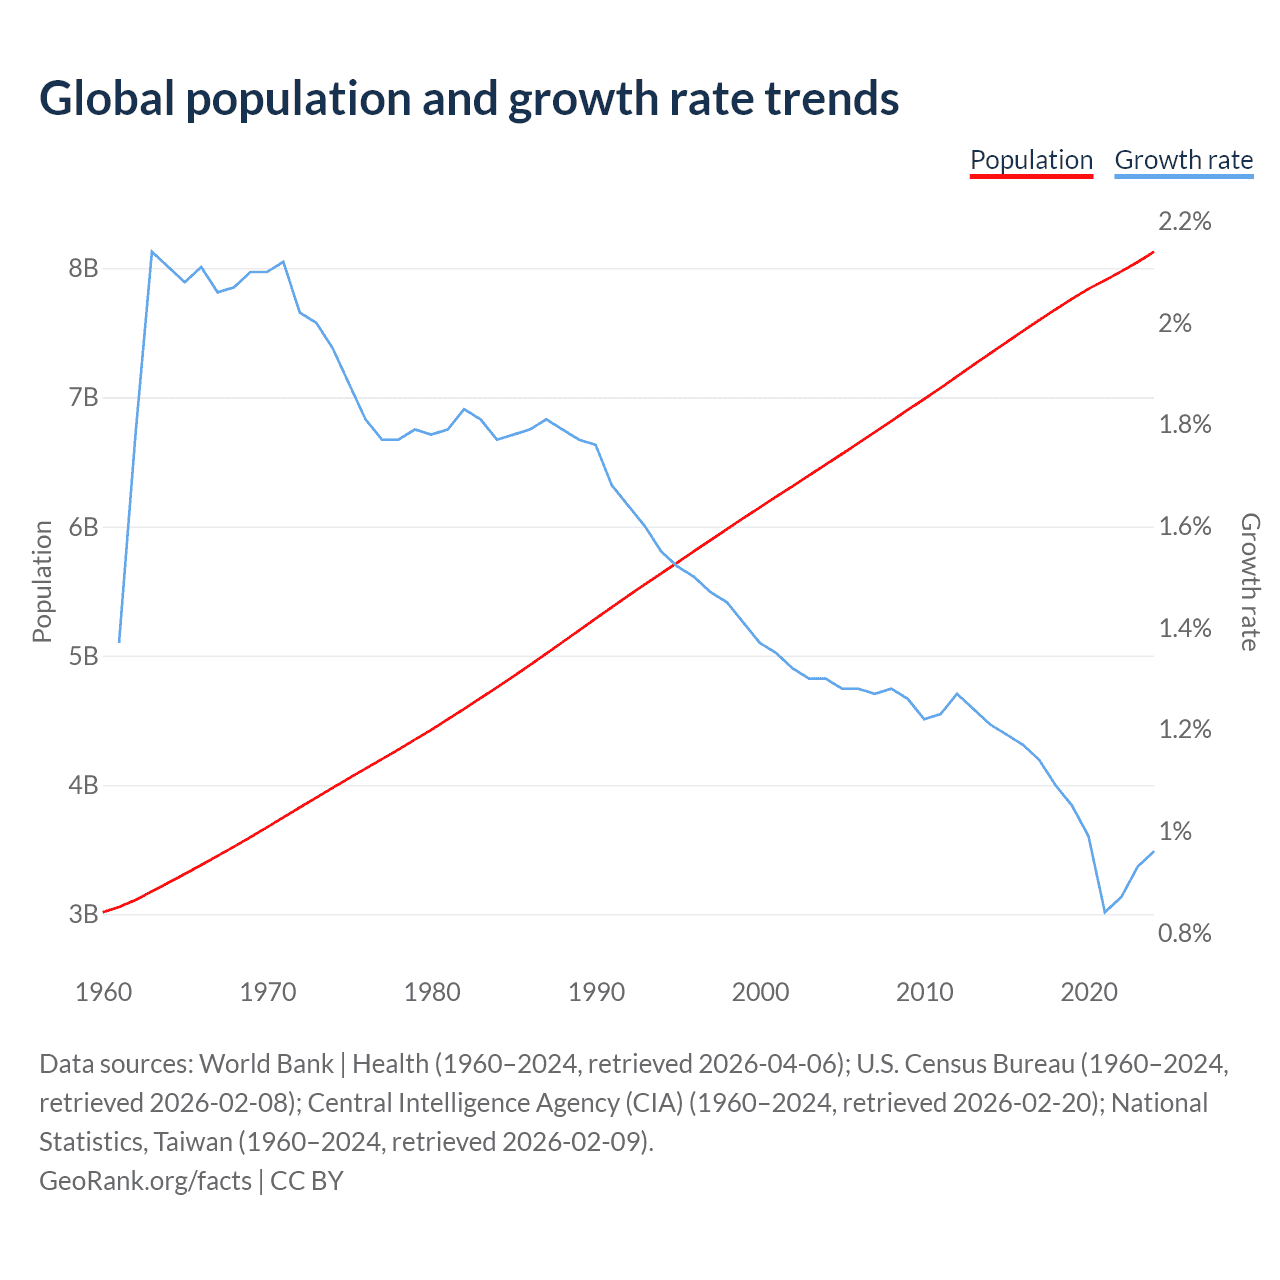
This chart shows the dynamics of global population and growth rates from 1960 to 2025. Total population has surged from 3.01B in 1960 to 8.2B today.
The annual growth rate peaked at 2.14% in 1963 and has steadily declined to 0.92% today, with projections of a continued decrease in the coming years.
Population growth
Top 5 countries’ GDP per capita growth
| Year | GDP per capita | ||||
|---|---|---|---|---|---|
| United States | China | Germany | Japan | United Kingdom | |
| 2025 | $90,027 | $13,862 | $60,496 | $35,951 | $57,602 |
| 2024 | $86,143 | $13,293 | $56,104 | $33,797 | $53,341 |
| 2023 | $83,041 | $12,951 | $54,777 | $35,215 | $49,920 |
| 2022 | $78,178 | $12,971 | $50,507 | $35,548 | $47,035 |
| 2021 | $71,486 | $12,887 | $52,349 | $41,581 | $47,696 |
| 2020 | $64,475 | $10,627 | $47,395 | $41,099 | $40,815 |
| 2019 | $65,605 | $10,343 | $47,656 | $41,425 | $43,161 |
| 2018 | $63,201 | $10,086 | $48,916 | $40,645 | $43,704 |
| 2017 | $60,322 | $8,980 | $45,554 | $39,680 | $40,918 |
| 2016 | $58,207 | $8,255 | $42,949 | $40,215 | $41,259 |
| 2015 | $57,040 | $8,175 | $41,930 | $35,665 | $45,256 |
| 2014 | $55,304 | $7,781 | $48,960 | $39,173 | $47,747 |
| 2013 | $53,410 | $7,147 | $47,207 | $41,369 | $43,608 |
| 2012 | $51,784 | $6,405 | $44,718 | $49,627 | $42,688 |
| 2011 | $50,066 | $5,704 | $47,631 | $49,122 | $42,296 |
| 2010 | $48,651 | $4,629 | $42,397 | $45,378 | $39,778 |
| 2009 | $47,195 | $3,898 | $42,472 | $41,678 | $39,009 |
| 2008 | $48,570 | $3,523 | $46,379 | $40,294 | $47,652 |
| 2007 | $48,050 | $2,735 | $42,351 | $36,130 | $50,629 |
| 2006 | $46,302 | $2,129 | $36,980 | $36,354 | $44,695 |
| 2005 | $44,123 | $1,778 | $35,084 | $38,159 | $42,240 |
| 2004 | $41,725 | $1,531 | $34,567 | $38,678 | $40,504 |
| 2003 | $39,490 | $1,307 | $30,711 | $35,809 | $34,557 |
| 2002 | $37,998 | $1,164 | $25,487 | $33,316 | $30,159 |
| 2001 | $37,134 | $1,065 | $23,878 | $34,910 | $28,014 |
| 2000 | $36,330 | $969 | $23,926 | $39,753 | $28,384 |
| 1999 | $34,484 | $881 | $26,965 | $37,029 | $28,858 |
| 1998 | $32,823 | $835 | $27,396 | $32,835 | $28,396 |
| 1997 | $31,430 | $787 | $27,047 | $36,331 | $26,910 |
| 1996 | $29,937 | $713 | $30,600 | $39,930 | $24,503 |
| 1995 | $28,661 | $613 | $31,747 | $44,947 | $23,253 |
| 1994 | $27,662 | $476 | $27,202 | $40,774 | $19,709 |
| 1993 | $26,353 | $379 | $25,617 | $37,111 | $18,389 |
| 1992 | $25,381 | $368 | $26,560 | $32,667 | $20,487 |
| 1991 | $24,293 | $334 | $23,443 | $30,048 | $19,901 |
| 1990 | $23,840 | $319 | $22,386 | $26,345 | $19,095 |
| 1989 | $22,857 | $311 | $17,829 | $25,798 | $16,239 |
| 1988 | $21,417 | $284 | $17,997 | $26,037 | $15,987 |
| 1987 | $20,039 | $252.3 | $16,739 | $21,587 | $13,119 |
| 1986 | $19,071 | $282.4 | $13,511 | $17,819 | $10,611 |
| 1985 | $18,237 | $295 | $9,464 | $12,058 | $8,652 |
| 1984 | $17,121 | $251.2 | $9,347 | $11,443 | $8,179 |
| 1983 | $15,544 | $225.9 | $9,900 | $10,876 | $8,692 |
| 1982 | $14,434 | $203.7 | $9,950 | $9,986 | $9,146 |
| 1981 | $13,976 | $197.4 | $10,246 | $10,806 | $9,599 |
| 1980 | $12,613 | $195.1 | $12,183 | $9,872 | $10,032 |
| 1979 | $11,674 | $184.3 | $11,322 | $9,497 | $7,805 |
| 1978 | $10,565 | $156.7 | $9,517 | $9,202 | $5,977 |
| 1977 | $9,453 | $185.7 | $7,711 | $6,609 | $4,681 |
| 1976 | $8,592 | $165.7 | $6,659 | $5,422 | $4,138 |
| 1975 | $7,801 | $178.6 | $6,259 | $4,876 | $4,300 |
| 1974 | $7,226 | $160.4 | $5,660 | $4,542 | $3,666 |
| 1973 | $6,726 | $157.3 | $5,065 | $4,147 | $3,426 |
| 1972 | $6,094 | $132.1 | $3,824 | $3,095 | $3,030 |
| 1971 | $5,609 | $118.8 | $3,204 | $2,370 | $2,650 |
| 1970 | $5,234 | $113.3 | $2,771 | $2,145 | $2,348 |
| 1969 | $5,020 | $100.3 | $2,281 | $1,841 | $2,101 |
| 1968 | $4,685 | $91.6 | $2,025 | $1,586 | $1,952 |
| 1967 | $4,326 | $96.8 | $1,886 | $1,354 | $2,059 |
| 1966 | $4,136 | $104.5 | $1,871 | $1,168 | $1,987 |
| 1965 | $3,818 | $98.7 | $1,774 | $1,015 | $1,874 |
| 1964 | $3,565 | $85.7 | $1,637 | $922 | $1,748 |
| 1963 | $3,366 | $74.5 | $1,502 | $792 | $1,613 |
| 1962 | $3,236 | $71.1 | $1,431 | $699 | $1,526 |
| 1961 | $3,059 | $76 | $1,316 | $622 | $1,472 |
| 1960 | $3,000 | $89.7 | $1,162 | $519 | $1,398 |
Data sources: World Bank | Economy & Growth (1960–2025, retrieved 2026-07-08); U.S. Census Bureau (1960–2025, retrieved 2026-07-08).
GeoRank.org/facts | CC BY
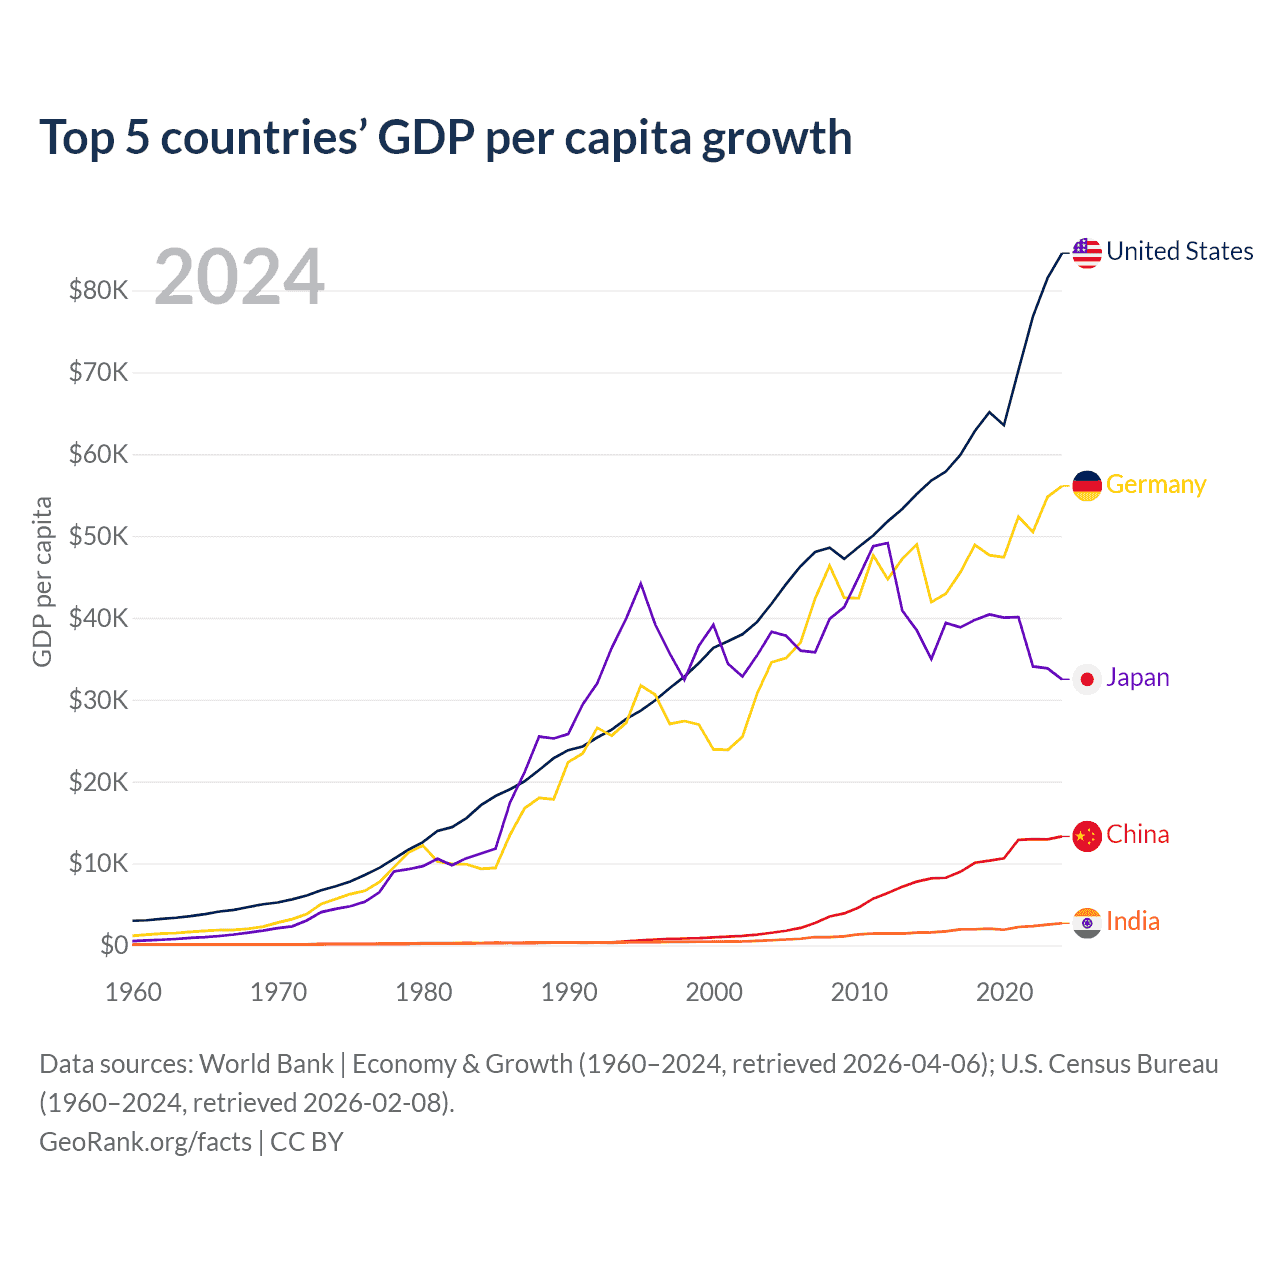
Global GDP per capita was $14,406 in 2025, up from $10,192 in 2015, a 41.3% increase over the decade. Total world GDP reached $118T in 2025, compared with $75.8T in 2015.
In 2025, GDP per capita was $90,027 in the United States, $13,862 in China, $60,496 in Germany, $35,951 in Japan, and $57,602 in the United Kingdom. Compared with 10 years ago, this is an increase of 57.8% for the United States, 69.6% for China, 44.3% for Germany, 0.8% for Japan, and 27.3% for the United Kingdom.
GDP per capita
Life expectancy across countries
| Year | Life expectancy, years | |||||
|---|---|---|---|---|---|---|
| Germany | United States | China | Brazil | India | Nigeria | |
| 2026 | 81.9 | 79.8 | 79 | 76.4 | 72.7 | 55 |
| 2025 | 81.7 | 79.6 | 78.4 | 76.2 | 72.5 | 54.8 |
| 2024 | 81.5 | 79.5 | 78 | 76 | 72.2 | 54.6 |
| 2023 | 81.4 | 79.3 | 78 | 75.8 | 72 | 54.5 |
| 2022 | 80.6 | 78 | 78.2 | 74.9 | 71.7 | 54.1 |
| 2021 | 81.1 | 76.4 | 78.1 | 73 | 67.3 | 53.5 |
| 2020 | 81 | 77 | 78 | 74.5 | 70.2 | 53.1 |
| 2019 | 81.2 | 78.9 | 77.9 | 75.8 | 70.7 | 53 |
| 2018 | 80.9 | 78.8 | 77.7 | 75.6 | 70.4 | 52.7 |
| 2017 | 80.9 | 78.6 | 77.2 | 75.4 | 70.1 | 52.4 |
| 2016 | 80.8 | 78.7 | 77.2 | 75.1 | 69.7 | 52.2 |
| 2015 | 80.6 | 78.7 | 77 | 75.1 | 69.3 | 51.9 |
| 2014 | 80.9 | 78.9 | 76.7 | 74.8 | 68.9 | 51.9 |
| 2013 | 80.5 | 78.8 | 76.5 | 74.6 | 68.5 | 51.8 |
| 2012 | 80.5 | 78.8 | 76.2 | 74.3 | 68.1 | 51.7 |
| 2011 | 80.4 | 78.7 | 75.9 | 74 | 67.6 | 51.5 |
| 2010 | 80.1 | 78.7 | 75.7 | 73.8 | 67.2 | 51.3 |
| 2009 | 79.9 | 78.5 | 75.3 | 73.5 | 66.7 | 51.1 |
| 2008 | 79.8 | 78.1 | 74.8 | 73.1 | 66.2 | 50.7 |
| 2007 | 79.7 | 78 | 74.8 | 72.7 | 65.8 | 50.4 |
| 2006 | 79.6 | 77.8 | 74.4 | 72.3 | 65.4 | 49.9 |
| 2005 | 79.3 | 77.5 | 74.1 | 71.8 | 64.9 | 49.5 |
| 2004 | 79.1 | 77.5 | 73.7 | 71.4 | 64.5 | 49.1 |
| 2003 | 78.5 | 77.1 | 73.4 | 70.9 | 64.1 | 48.6 |
| 2002 | 78.5 | 77 | 73 | 70.4 | 63.6 | 48 |
| 2001 | 78.4 | 76.9 | 72.7 | 70 | 63.2 | 47.5 |
| 2000 | 78.1 | 76.8 | 72.3 | 69.6 | 62.7 | 47.1 |
| 1999 | 77.8 | 76.7 | 72 | 69.2 | 62.3 | 46.6 |
| 1998 | 77.6 | 76.7 | 71.6 | 68.8 | 61.9 | 46.1 |
| 1997 | 77.2 | 76.5 | 71.2 | 68.5 | 61.4 | 46 |
| 1996 | 76.8 | 76.2 | 70.8 | 68.1 | 61 | 45.8 |
| 1995 | 76.6 | 75.9 | 70.4 | 67.7 | 60.6 | 45.9 |
| 1994 | 76.4 | 75.7 | 69.8 | 67.3 | 60.2 | 45.7 |
| 1993 | 76.1 | 75.6 | 69.5 | 66.9 | 59.8 | 45.8 |
| 1992 | 76 | 75.8 | 69.1 | 66.5 | 59.4 | 45.6 |
| 1991 | 75.6 | 75.5 | 68.6 | 66.2 | 59 | 45.5 |
| 1990 | 75.3 | 75.4 | 68.2 | 65.9 | 58.6 | 45.7 |
| 1989 | 75.5 | 75.1 | 67.9 | 65.5 | 58.2 | 45.8 |
| 1988 | 75.3 | 74.8 | 67.6 | 65.2 | 57.7 | 45.8 |
| 1987 | 75.1 | 74.9 | 67.3 | 64.8 | 57.3 | 45.9 |
| 1986 | 74.7 | 74.7 | 66.9 | 64.4 | 56.8 | 46 |
| 1985 | 74.5 | 74.7 | 66.5 | 64 | 56.3 | 46.2 |
| 1984 | 74.4 | 74.7 | 66.1 | 63.6 | 55.8 | 46.3 |
| 1983 | 73.9 | 74.6 | 65.7 | 63.1 | 55.3 | 46.4 |
| 1982 | 73.6 | 74.5 | 65.2 | 62.7 | 54.7 | 46.4 |
| 1981 | 73.3 | 74.1 | 64.8 | 62.3 | 54.2 | 46.3 |
| 1980 | 73.1 | 73.7 | 64.2 | 61.8 | 53.6 | 46 |
| 1979 | 72.9 | 73.8 | 63.7 | 61.4 | 53 | 45.7 |
| 1978 | 72.6 | 73.4 | 63.1 | 60.9 | 52.4 | 45.3 |
| 1977 | 72.6 | 73.2 | 62.5 | 60.5 | 51.8 | 44.8 |
| 1976 | 72 | 72.8 | 61.2 | 60 | 51.3 | 44.2 |
| 1975 | 71.5 | 72.5 | 61 | 59.6 | 50.8 | 43.1 |
| 1974 | 71.7 | 72 | 60.2 | 59.1 | 50.3 | 42.5 |
| 1973 | 71.4 | 71.4 | 59.5 | 58.7 | 49.6 | 41.8 |
| 1972 | 71.1 | 71.2 | 58.6 | 58.3 | 49.2 | 41.3 |
| 1971 | 70.9 | 71.1 | 57.7 | 57.8 | 48.9 | 40.6 |
| 1970 | 70.7 | 70.7 | 56.8 | 57.3 | 48.6 | 40 |
| 1969 | 70.5 | 70.5 | 56 | 56.9 | 48.3 | 38.9 |
| 1968 | 70.6 | 70.2 | 55.2 | 56.5 | 47.9 | 38.6 |
| 1967 | 71 | 70.5 | 54.4 | 56 | 46.2 | 37.5 |
| 1966 | 70.7 | 70.2 | 53.7 | 55.6 | 45.9 | 38.4 |
| 1965 | 70.6 | 70.2 | 53 | 55.2 | 45.6 | 38.2 |
| 1964 | 70.6 | 70.2 | 52.3 | 54.8 | 46.7 | 38 |
| 1963 | 70.1 | 69.9 | 51.7 | 54.5 | 46.5 | 37.8 |
| 1962 | 70 | 70.1 | 51 | 54 | 46.1 | 37.6 |
| 1961 | 69.8 | 70.3 | 40.2 | 53.6 | 45.8 | 37.4 |
| 1960 | 69.3 | 69.8 | 33.4 | 53.2 | 45.6 | 37.2 |
| 1959 | 69.3 | 69.9 | 40.2 | 52.7 | 45.3 | 37 |
| 1958 | 69.2 | 69.7 | 48.8 | 52.2 | 44.8 | 36.8 |
| 1957 | 68.5 | 69.4 | 48.4 | 51.8 | 44.4 | 36.6 |
| 1956 | 68.6 | 69.6 | 47.8 | 51.3 | 44.1 | 36.5 |
| 1955 | 68.3 | 69.6 | 47.2 | 50.9 | 43.7 | 36.3 |
| 1954 | 68.1 | 69.5 | 46.8 | 50.4 | 43.2 | 36.2 |
| 1953 | 67.8 | 68.7 | 45.9 | 50 | 42.4 | 36 |
| 1952 | 67.5 | 68.4 | 45.3 | 49.6 | 42.1 | 35.9 |
| 1951 | 67.1 | 68.2 | 44.6 | 49 | 41.6 | 35.7 |
| 1950 | 66.8 | 68.1 | 43.8 | 48.5 | 41.2 | 35.5 |
Data sources: United Nations | World Population Prospects (1950–2026, retrieved 2026-07-08).
GeoRank.org/facts | CC BY
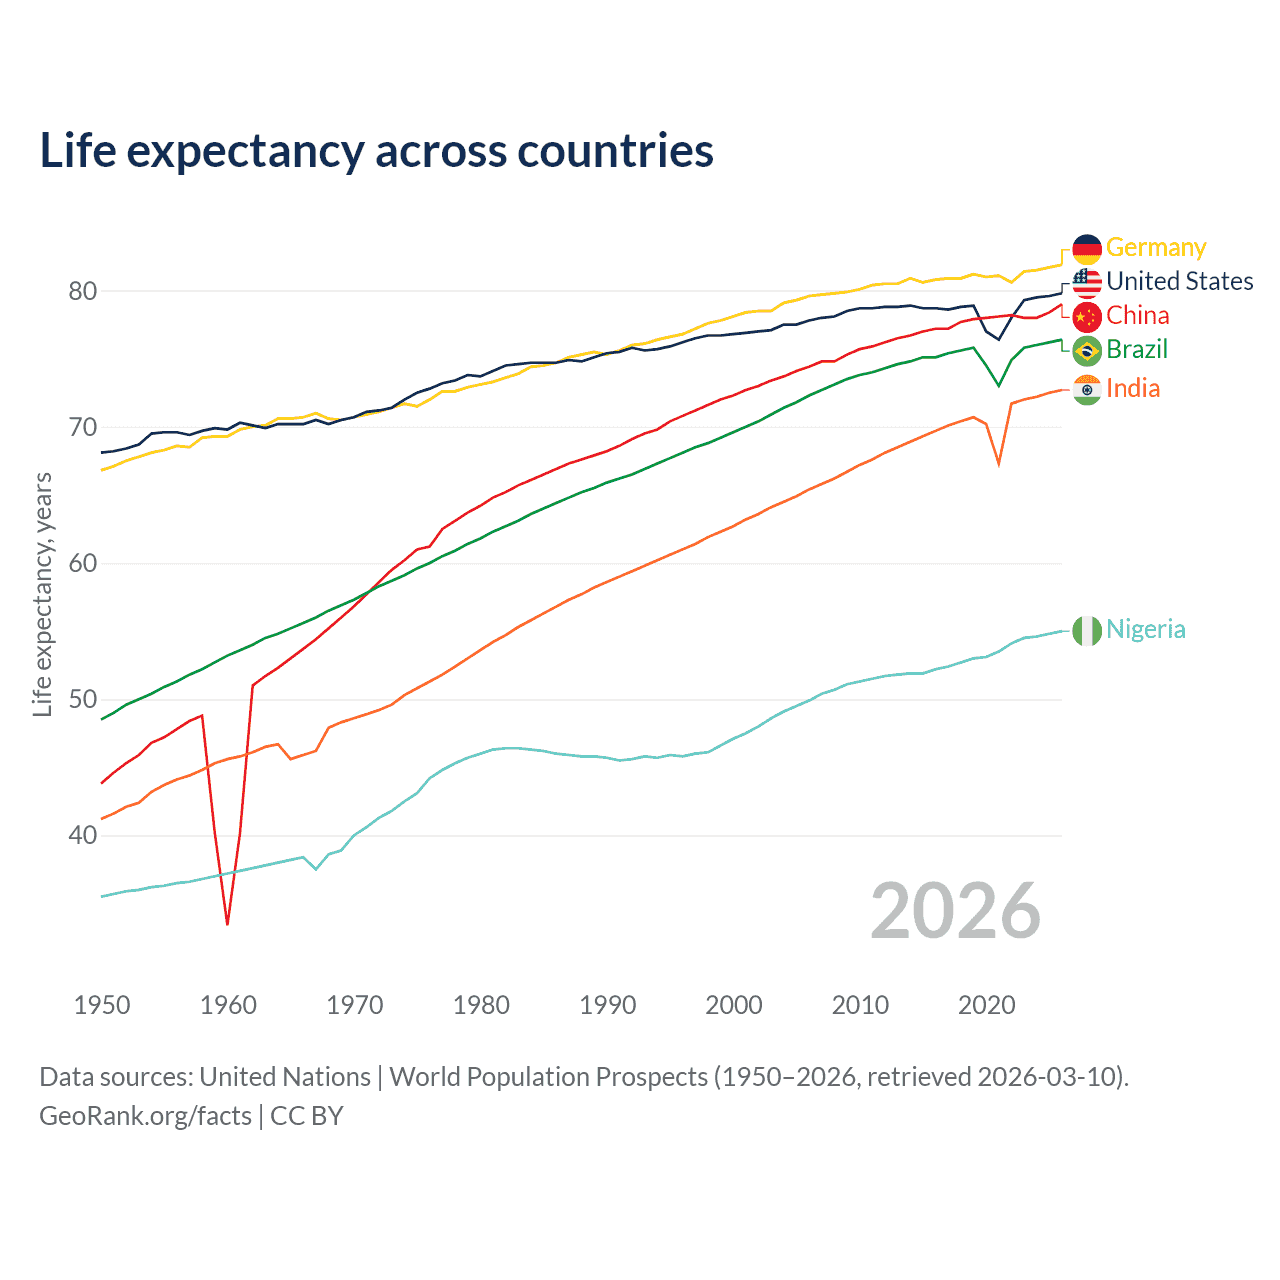
We picked 6 countries to compare life expectancy trends across regions. Germany leads with a life expectancy at birth of 81.9 years in 2026, followed by the United States at 79.8, China at 79, Brazil at 76.4, India at 72.7, and Nigeria at 55.
Over the past 20 years, life expectancy has risen by 2.28 years in Germany, 1.96 in the United States, 4.62 in China, 4.08 in Brazil, 7.34 in India, and 5.08 in Nigeria — yet Nigeria's life expectancy remains 11.9 years lower than Germany's today.
Life expectancy
Countries below replacement-level fertility
| Year | Fertility rate | ||||||
|---|---|---|---|---|---|---|---|
| India | China | United States | Russia | Mexico | France | South Korea | |
| 2024 | 1.96 | 1.01 | 1.63 | 1.42 | 1.89 | 1.61 | 0.75 |
| 2023 | 1.98 | 1 | 1.62 | 1.41 | 1.91 | 1.66 | 0.72 |
| 2022 | 1.99 | 1.03 | 1.66 | 1.42 | 1.94 | 1.78 | 0.78 |
| 2021 | 2.01 | 1.12 | 1.66 | 1.51 | 1.97 | 1.83 | 0.81 |
| 2020 | 2.05 | 1.24 | 1.64 | 1.51 | 1.99 | 1.82 | 0.84 |
| 2019 | 2.12 | 1.5 | 1.71 | 1.5 | 2.02 | 1.86 | 0.92 |
| 2018 | 2.18 | 1.54 | 1.73 | 1.58 | 2.03 | 1.87 | 0.98 |
| 2017 | 2.19 | 1.8 | 1.77 | 1.62 | 2.04 | 1.89 | 1.05 |
| 2016 | 2.28 | 1.77 | 1.82 | 1.76 | 2.09 | 1.92 | 1.17 |
| 2015 | 2.29 | 1.67 | 1.84 | 1.78 | 2.14 | 1.96 | 1.24 |
| 2014 | 2.29 | 1.77 | 1.86 | 1.75 | 2.21 | 2 | 1.21 |
| 2013 | 2.4 | 1.71 | 1.86 | 1.71 | 2.27 | 1.99 | 1.19 |
| 2012 | 2.47 | 1.8 | 1.88 | 1.69 | 2.29 | 2.01 | 1.3 |
| 2011 | 2.53 | 1.67 | 1.89 | 1.58 | 2.32 | 2.01 | 1.24 |
| 2010 | 2.6 | 1.69 | 1.93 | 1.57 | 2.34 | 2.03 | 1.23 |
| 2009 | 2.67 | 1.71 | 2 | 1.54 | 2.36 | 2 | 1.15 |
| 2008 | 2.71 | 1.7 | 2.07 | 1.5 | 2.39 | 2.01 | 1.19 |
| 2007 | 2.78 | 1.67 | 2.12 | 1.42 | 2.42 | 1.98 | 1.26 |
| 2006 | 2.87 | 1.64 | 2.11 | 1.31 | 2.46 | 2 | 1.13 |
| 2005 | 2.96 | 1.62 | 2.06 | 1.29 | 2.5 | 1.94 | 1.09 |
| 2004 | 3.05 | 1.61 | 2.05 | 1.34 | 2.54 | 1.92 | 1.16 |
| 2003 | 3.12 | 1.57 | 2.05 | 1.32 | 2.58 | 1.89 | 1.19 |
| 2002 | 3.22 | 1.57 | 2.02 | 1.29 | 2.63 | 1.88 | 1.18 |
| 2001 | 3.3 | 1.56 | 2.03 | 1.22 | 2.67 | 1.9 | 1.31 |
| 2000 | 3.35 | 1.63 | 2.06 | 1.2 | 2.71 | 1.89 | 1.48 |
| 1999 | 3.38 | 1.53 | 2.01 | 1.16 | 2.76 | 1.81 | 1.43 |
| 1998 | 3.45 | 1.52 | 2 | 1.23 | 2.82 | 1.78 | 1.46 |
| 1997 | 3.51 | 1.53 | 1.97 | 1.22 | 2.89 | 1.77 | 1.54 |
| 1996 | 3.58 | 1.55 | 1.98 | 1.27 | 2.96 | 1.75 | 1.57 |
| 1995 | 3.65 | 1.59 | 1.98 | 1.34 | 3.04 | 1.74 | 1.63 |
| 1994 | 3.72 | 1.63 | 2 | 1.4 | 3.13 | 1.73 | 1.66 |
| 1993 | 3.8 | 1.69 | 2.02 | 1.39 | 3.21 | 1.73 | 1.65 |
| 1992 | 3.88 | 1.78 | 2.05 | 1.55 | 3.29 | 1.74 | 1.76 |
| 1991 | 3.96 | 1.93 | 2.06 | 1.73 | 3.36 | 1.75 | 1.71 |
| 1990 | 4.05 | 2.51 | 2.08 | 1.89 | 3.44 | 1.77 | 1.57 |
| 1989 | 4.13 | 2.52 | 2.01 | 2.01 | 3.53 | 1.79 | 1.56 |
| 1988 | 4.22 | 2.54 | 1.93 | 2.12 | 3.64 | 1.81 | 1.55 |
| 1987 | 4.31 | 2.76 | 1.87 | 2.22 | 3.8 | 1.83 | 1.53 |
| 1986 | 4.4 | 2.72 | 1.84 | 2.15 | 3.97 | 1.85 | 1.58 |
| 1985 | 4.43 | 2.63 | 1.84 | 2.05 | 4.09 | 1.86 | 1.66 |
| 1984 | 4.52 | 2.61 | 1.81 | 2.06 | 4.18 | 1.86 | 1.74 |
| 1983 | 4.57 | 2.56 | 1.8 | 2.11 | 4.3 | 1.86 | 2.06 |
| 1982 | 4.62 | 2.97 | 1.83 | 2.04 | 4.43 | 1.86 | 2.39 |
| 1981 | 4.7 | 2.79 | 1.81 | 1.91 | 4.57 | 1.85 | 2.57 |
| 1980 | 4.78 | 2.74 | 1.84 | 1.89 | 4.74 | 1.85 | 2.82 |
| 1979 | 4.81 | 2.75 | 1.81 | 1.9 | 4.96 | 1.87 | 2.9 |
| 1978 | 4.89 | 2.72 | 1.76 | 1.92 | 5.2 | 1.89 | 2.64 |
| 1977 | 5.01 | 2.84 | 1.79 | 1.95 | 5.36 | 1.94 | 2.99 |
| 1976 | 5.13 | 3.24 | 1.74 | 1.97 | 5.54 | 2.01 | 3 |
| 1975 | 5.2 | 3.57 | 1.77 | 1.98 | 5.74 | 2.09 | 3.43 |
| 1974 | 5.33 | 4.17 | 1.84 | 2 | 5.95 | 2.18 | 3.77 |
| 1973 | 5.4 | 4.73 | 1.88 | 2.01 | 6.12 | 2.28 | 4.07 |
| 1972 | 5.48 | 5.11 | 2.01 | 2.04 | 6.28 | 2.38 | 4.12 |
| 1971 | 5.57 | 5.52 | 2.27 | 2.03 | 6.42 | 2.47 | 4.54 |
| 1970 | 5.62 | 6.09 | 2.48 | 1.99 | 6.53 | 2.55 | 4.53 |
| 1969 | 5.68 | 6.18 | 2.46 | 1.97 | 6.63 | 2.62 | 4.45 |
| 1968 | 5.76 | 6.51 | 2.46 | 1.99 | 6.71 | 2.69 | 4.51 |
| 1967 | 5.83 | 5.81 | 2.56 | 2.04 | 6.75 | 2.75 | 4.62 |
| 1966 | 5.88 | 6.31 | 2.72 | 2.1 | 6.79 | 2.8 | 4.78 |
| 1965 | 5.94 | 6.61 | 2.91 | 2.13 | 6.82 | 2.84 | 4.89 |
| 1964 | 5.98 | 6.67 | 3.19 | 2.18 | 6.83 | 2.87 | 5.07 |
| 1963 | 5.97 | 7.51 | 3.32 | 2.27 | 6.82 | 2.89 | 5.33 |
| 1962 | 5.95 | 6.09 | 3.46 | 2.36 | 6.8 | 2.89 | 5.56 |
| 1961 | 5.94 | 3.86 | 3.62 | 2.45 | 6.78 | 2.87 | 5.8 |
| 1960 | 5.92 | 4.45 | 3.65 | 2.52 | 6.76 | 2.85 | 5.99 |
Data sources: World Bank | Health (1960–2024, retrieved 2026-07-08).
GeoRank.org/facts | CC BY
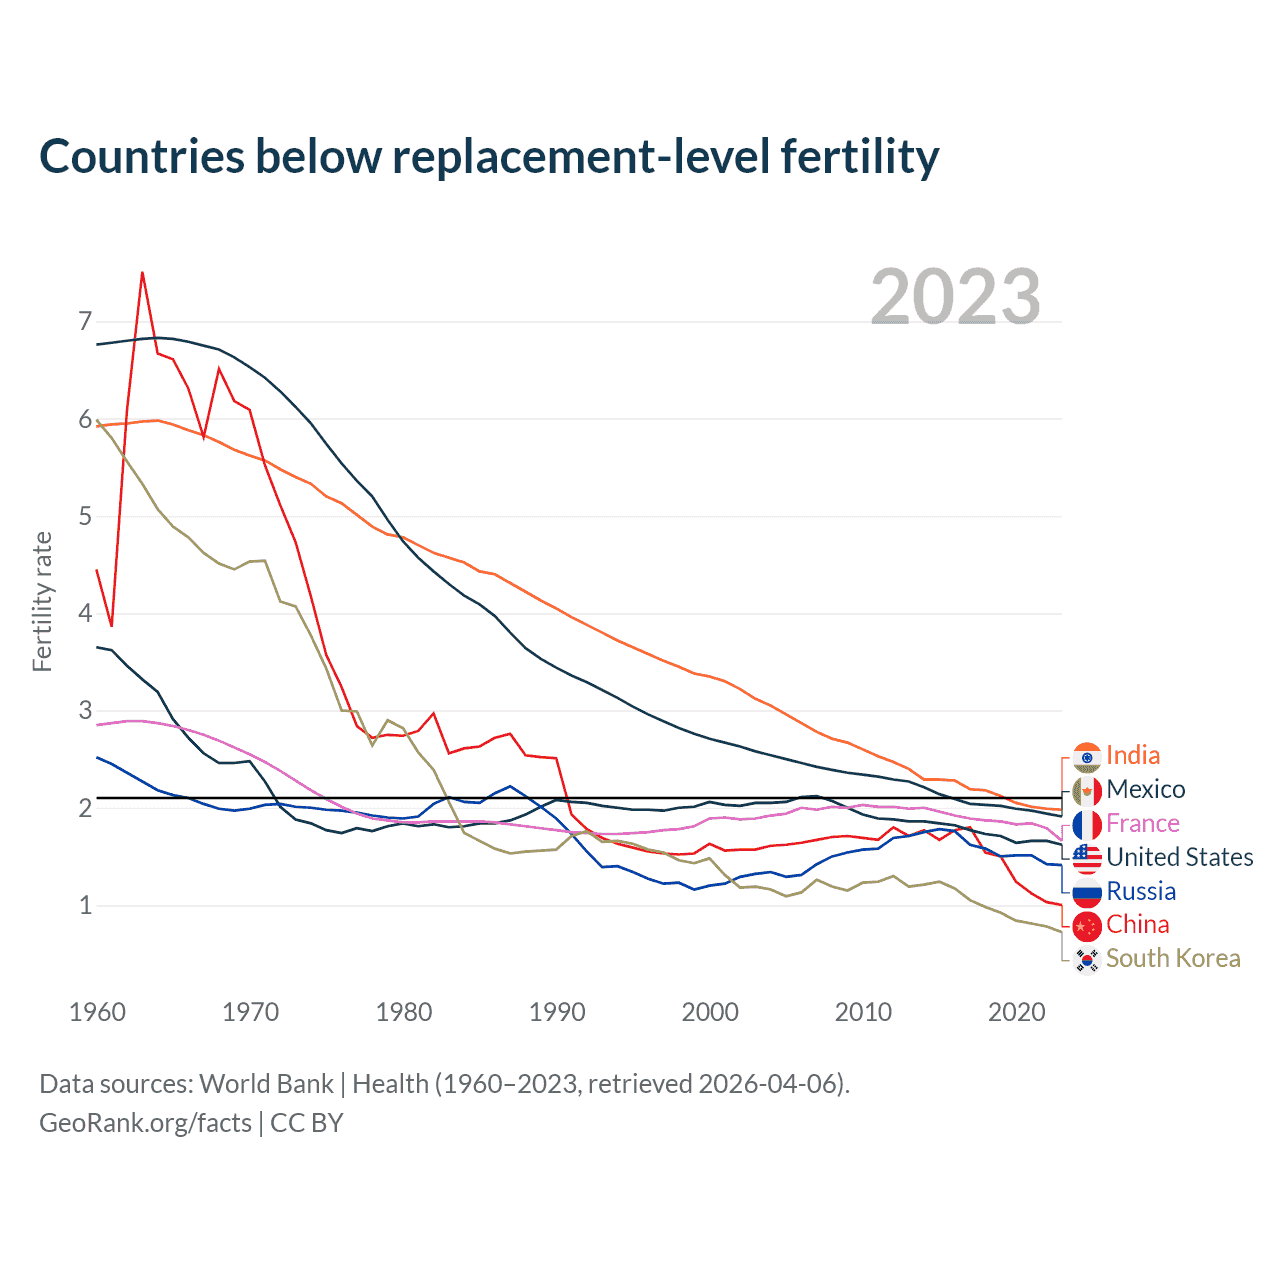
In 1960, all 7 countries in this group had fertility rates well above the replacement threshold of 2.1 children per woman: India at 5.92, China 4.45, the United States 3.65, Russia 6.76, Mexico 6.76, France 2.85, and South Korea 5.99. By 2024, each had dropped below the replacement level, reflecting the global trend among both developed and emerging nations.
Fertility rate
Median age comparison
| Year | Median age | |||||||
|---|---|---|---|---|---|---|---|---|
| Japan | Germany | Russia | China | United States | Brazil | Turkey | Nigeria | |
| 2025 | 50.8 | 46.5 | 41.4 | 41.1 | 39.5 | 35.8 | 34.5 | 19.2 |
| 2024 | 50.4 | 46.3 | 40.9 | 40.6 | 39.3 | 35.4 | 34 | 19 |
| 2023 | 50 | 46.2 | 40.5 | 40.1 | 39 | 34.9 | 33.5 | 18.8 |
| 2022 | 49.5 | 46 | 40.1 | 39.6 | 38.7 | 34.5 | 33.1 | 18.7 |
| 2021 | 49.1 | 45.9 | 39.9 | 39 | 38.5 | 34.1 | 32.7 | 18.5 |
| 2020 | 48.7 | 45.8 | 39.7 | 38.5 | 38.2 | 33.7 | 32.3 | 18.3 |
| 2019 | 48.3 | 45.8 | 39.4 | 38.1 | 38 | 33.2 | 31.8 | 18.2 |
| 2018 | 48 | 45.8 | 39.2 | 37.7 | 37.9 | 32.8 | 31.5 | 18 |
| 2017 | 47.6 | 45.8 | 39 | 37.4 | 37.7 | 32.4 | 31.2 | 17.9 |
| 2016 | 47.3 | 45.7 | 38.8 | 37.1 | 37.6 | 31.9 | 30.9 | 17.8 |
| 2015 | 47 | 45.7 | 38.7 | 36.7 | 37.5 | 31.5 | 30.6 | 17.8 |
| 2014 | 46.6 | 45.7 | 38.6 | 36.3 | 37.3 | 31 | 30.4 | 17.7 |
| 2013 | 46.2 | 45.5 | 38.4 | 36 | 37.2 | 30.6 | 30.1 | 17.7 |
| 2012 | 45.8 | 45.1 | 38.3 | 35.7 | 37.1 | 30.1 | 29.8 | 17.7 |
| 2011 | 45.5 | 44.6 | 38.1 | 35.5 | 37 | 29.7 | 29.5 | 17.7 |
| 2010 | 45.2 | 44.2 | 38 | 35.1 | 36.9 | 29.2 | 29.1 | 17.8 |
| 2009 | 44.9 | 43.9 | 37.9 | 34.7 | 36.7 | 28.8 | 28.6 | 17.8 |
| 2008 | 44.6 | 43.5 | 37.8 | 34.2 | 36.6 | 28.3 | 28.3 | 17.8 |
| 2007 | 44.2 | 43.1 | 37.7 | 33.7 | 36.5 | 27.9 | 27.9 | 17.9 |
| 2006 | 43.9 | 42.5 | 37.6 | 33.1 | 36.4 | 27.5 | 27.5 | 17.9 |
| 2005 | 43.6 | 42 | 37.4 | 32.6 | 36.2 | 27.1 | 27 | 17.9 |
| 2004 | 43.2 | 41.6 | 37.2 | 32.1 | 36 | 26.7 | 26.6 | 17.9 |
| 2003 | 42.8 | 41.2 | 37 | 31.6 | 35.8 | 26.3 | 26.2 | 17.9 |
| 2002 | 42.5 | 40.8 | 36.9 | 31.1 | 35.6 | 25.9 | 25.8 | 17.9 |
| 2001 | 42.1 | 40.4 | 36.8 | 30.5 | 35.5 | 25.5 | 25.4 | 17.9 |
| 2000 | 41.8 | 40 | 36.6 | 30 | 35.3 | 25.2 | 25 | 17.9 |
| 1999 | 41.4 | 39.7 | 36.3 | 29.4 | 35.1 | 24.9 | 24.7 | 17.9 |
| 1998 | 41 | 39.3 | 36 | 28.8 | 34.9 | 24.6 | 24.3 | 17.8 |
| 1997 | 40.7 | 38.9 | 35.7 | 28.3 | 34.6 | 24.3 | 24 | 17.7 |
| 1996 | 40.3 | 38.6 | 35.3 | 27.8 | 34.4 | 24 | 23.6 | 17.6 |
| 1995 | 40 | 38.4 | 35 | 27.2 | 34.1 | 23.7 | 23.3 | 17.6 |
| 1994 | 39.6 | 38.1 | 34.7 | 26.6 | 33.8 | 23.5 | 23 | 17.5 |
| 1993 | 39.2 | 37.9 | 34.4 | 26.1 | 33.6 | 23.2 | 22.7 | 17.4 |
| 1992 | 38.7 | 37.8 | 33.9 | 25.6 | 33.4 | 22.9 | 22.4 | 17.4 |
| 1991 | 38.2 | 37.7 | 33.6 | 25.1 | 33.2 | 22.7 | 22.1 | 17.3 |
| 1990 | 37.7 | 37.6 | 33.2 | 24.7 | 32.9 | 22.4 | 21.8 | 17.3 |
| 1989 | 37.2 | 37.6 | 32.9 | 24.4 | 32.7 | 22.1 | 21.6 | 17.3 |
| 1988 | 36.8 | 37.6 | 32.6 | 23.9 | 32.4 | 21.9 | 21.3 | 17.3 |
| 1987 | 36.3 | 37.4 | 32.4 | 23.6 | 32.1 | 21.7 | 21.1 | 17.3 |
| 1986 | 35.9 | 37.2 | 32.2 | 23.4 | 31.8 | 21.5 | 20.9 | 17.3 |
| 1985 | 35.4 | 37.1 | 32 | 23.2 | 31.5 | 21.2 | 20.6 | 17.3 |
| 1984 | 34.9 | 37 | 31.8 | 23 | 31.2 | 21 | 20.4 | 17.4 |
| 1983 | 34.3 | 36.7 | 31.7 | 22.6 | 30.9 | 20.8 | 20.2 | 17.5 |
| 1982 | 33.7 | 36.6 | 31.6 | 22.1 | 30.7 | 20.6 | 20 | 17.6 |
| 1981 | 33.1 | 36.5 | 31.4 | 21.8 | 30.4 | 20.4 | 19.9 | 17.7 |
| 1980 | 32.8 | 36.5 | 31.3 | 21.6 | 30.1 | 20.2 | 19.8 | 17.8 |
| 1979 | 32.4 | 36.4 | 31.1 | 21.4 | 29.9 | 20 | 19.7 | 17.9 |
| 1978 | 32 | 36.3 | 31 | 21.2 | 29.6 | 19.8 | 19.5 | 18 |
| 1977 | 31.5 | 36.1 | 30.9 | 20.8 | 29.2 | 19.6 | 19.4 | 18.2 |
| 1976 | 30.9 | 35.8 | 30.6 | 20.4 | 28.9 | 19.4 | 19.3 | 18.3 |
| 1975 | 30.6 | 35.5 | 30.7 | 20.1 | 28.7 | 19.2 | 19.1 | 18.4 |
| 1974 | 30.4 | 35 | 30.9 | 19.7 | 28.5 | 19.1 | 19 | 18.5 |
| 1973 | 30.2 | 34.7 | 31.1 | 19.5 | 28.3 | 18.9 | 18.9 | 18.6 |
| 1972 | 29.9 | 34.6 | 31.1 | 19.3 | 28 | 18.7 | 18.8 | 18.7 |
| 1971 | 29.6 | 34.4 | 31 | 19.2 | 27.9 | 18.5 | 18.7 | 18.8 |
| 1970 | 29.2 | 34.3 | 30.7 | 19.1 | 27.8 | 18.4 | 18.6 | 18.9 |
| 1969 | 28.9 | 34.1 | 30.3 | 19.1 | 27.9 | 18.2 | 18.6 | 19.1 |
| 1968 | 28.6 | 34.2 | 29.8 | 19.2 | 27.9 | 18.1 | 18.6 | 19.2 |
| 1967 | 28.4 | 34.3 | 29.2 | 19.2 | 27.9 | 18 | 18.7 | 19.2 |
| 1966 | 28 | 34.4 | 28.9 | 19.3 | 27.9 | 17.9 | 18.8 | 19.3 |
| 1965 | 27.6 | 34.4 | 28.6 | 19.6 | 28.1 | 17.9 | 18.9 | 19.3 |
| 1964 | 27.2 | 34.5 | 28.3 | 19.9 | 28.2 | 17.8 | 18.9 | 19.3 |
| 1963 | 26.9 | 34.6 | 28.1 | 20.4 | 28.5 | 17.8 | 19 | 19.3 |
| 1962 | 26.5 | 34.7 | 27.7 | 21 | 28.7 | 17.9 | 19.1 | 19.3 |
| 1961 | 26.2 | 34.7 | 27.4 | 21.1 | 29 | 17.9 | 19.3 | 19.3 |
| 1960 | 25.8 | 34.7 | 27.1 | 20.9 | 29.2 | 18 | 19.4 | 19.3 |
Data sources: World Bank | Health (1960–2025, retrieved 2026-07-08); U.S. Census Bureau (1960–2025, retrieved 2026-07-08).
GeoRank.org/facts | CC BY
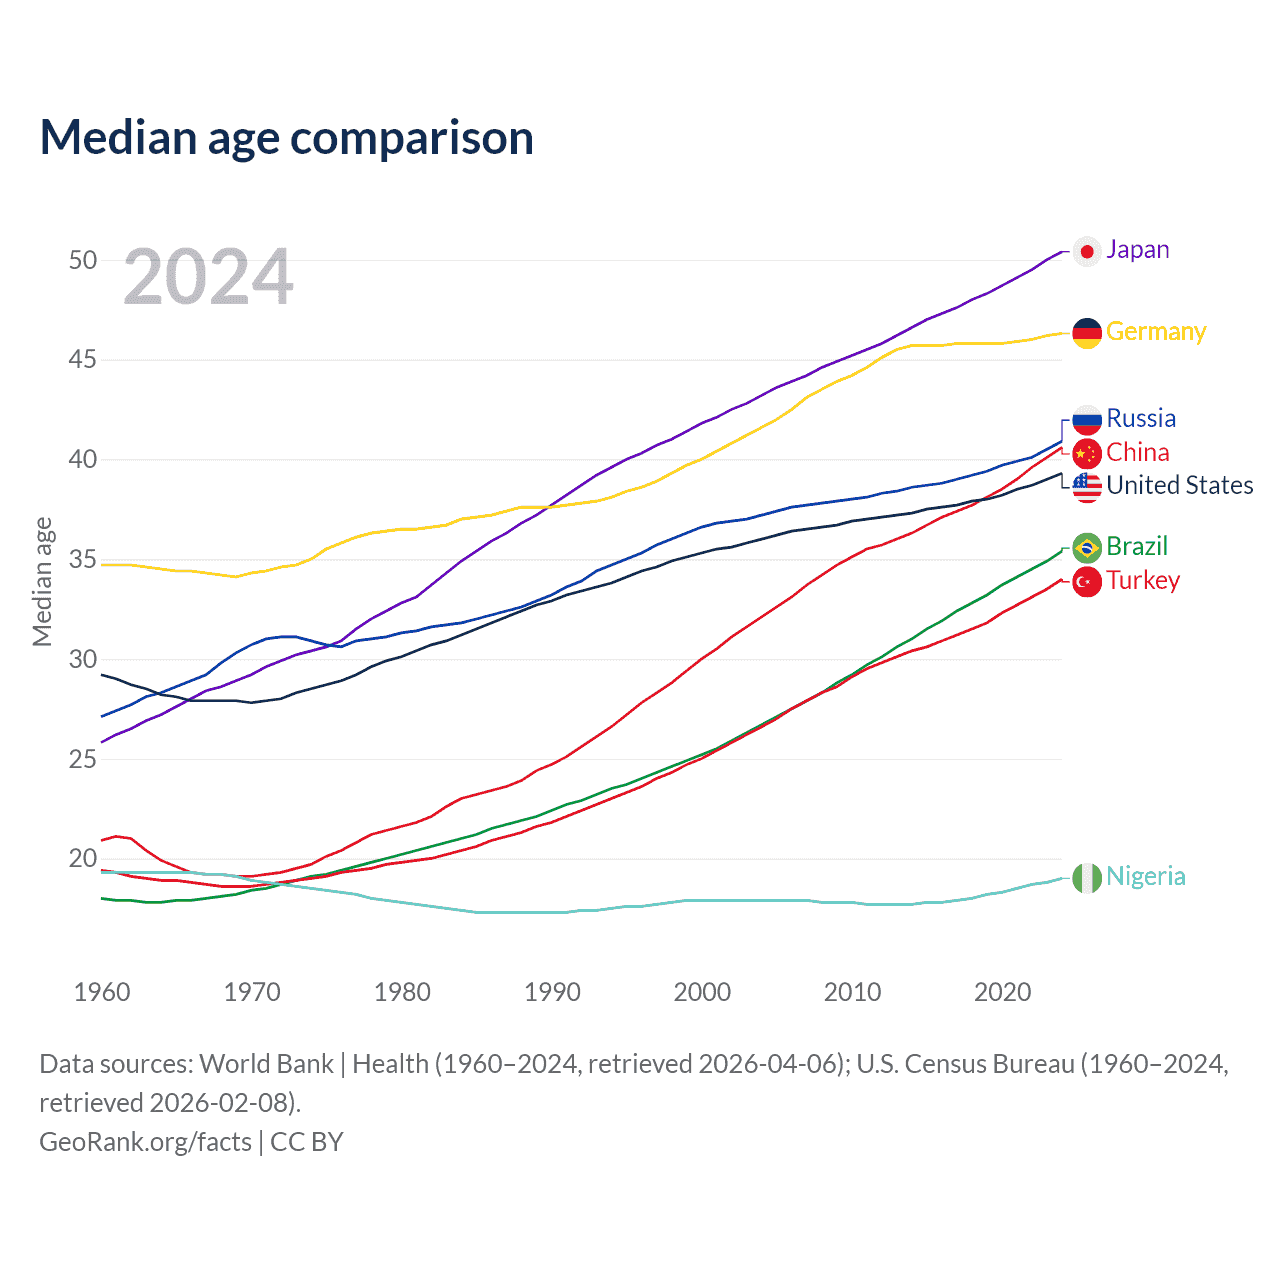
The median age differs significantly across countries and regions. Japan has a median age of 50.8 years, and Germany 46.5 years. Russia (41.4 years), China (41.1 years), and the United States (39.5 years) fall into a similar range. Brazil (35.8 years) and Turkey (34.5 years) are closer to the global median of 31.8 years, while Nigeria, at 19.2 years is 12.6 years younger than the world's median, similar to many other African countries.
Median age
Help us show the world through your eyes
Share a photo of your city and help others discover what it looks like to live there. Your contribution makes our data come alive.
Data sources:
- World Bank | Health (1960–2025, retrieved 2026-07-08)
- United Nations | World Population Prospects (1950–2026, retrieved 2026-07-08)
- U.S. Census Bureau (1960–2025, retrieved 2026-07-08)
- National Statistics, Taiwan (1960–2026, retrieved 2026-07-08)
- Central Intelligence Agency (CIA) (1960–2026, retrieved 2026-07-08)
Creative Commons Attribution (CC BY) — you’re free to copy, share, remix, adapt, and use even commercially as long as you give appropriate credit and clearly indicate if you made changes. Other sources may be subject to different license terms.