The world birth rate is 16.3 annual births per 1,000 people, and the total fertility rate is 2.19 — the average number of children a woman is expected to have over her lifetime based on current age-specific birth rates.
The fertility rate has been declining from 5.31 in 1963 to 2.19 now and is projected to fall below the replacement level of 2.1 children per woman by 2035.
The birth rate varies drastically by country and by region. South Korea has the lowest fertility rate of 0.75 lifetime births per woman with a total annual birth rate of 4.7 per 1,000 people; meanwhile, Chad has the highest fertility rate in the world at 6.03 and a birth rate of 43.3.
- The mean age of first-time mothers globally is 23.2 — it was 22.9 in 2017.
- The mean age at childbearing (for all the births, not just the first) is 28.3, a change from 27.2 in 1990.
- Annual births per 1,000 women ages 15-19 (adolescent birth rate or teenage mother rate) declined from 92.1 in 1960 to 38.3 in 2024.
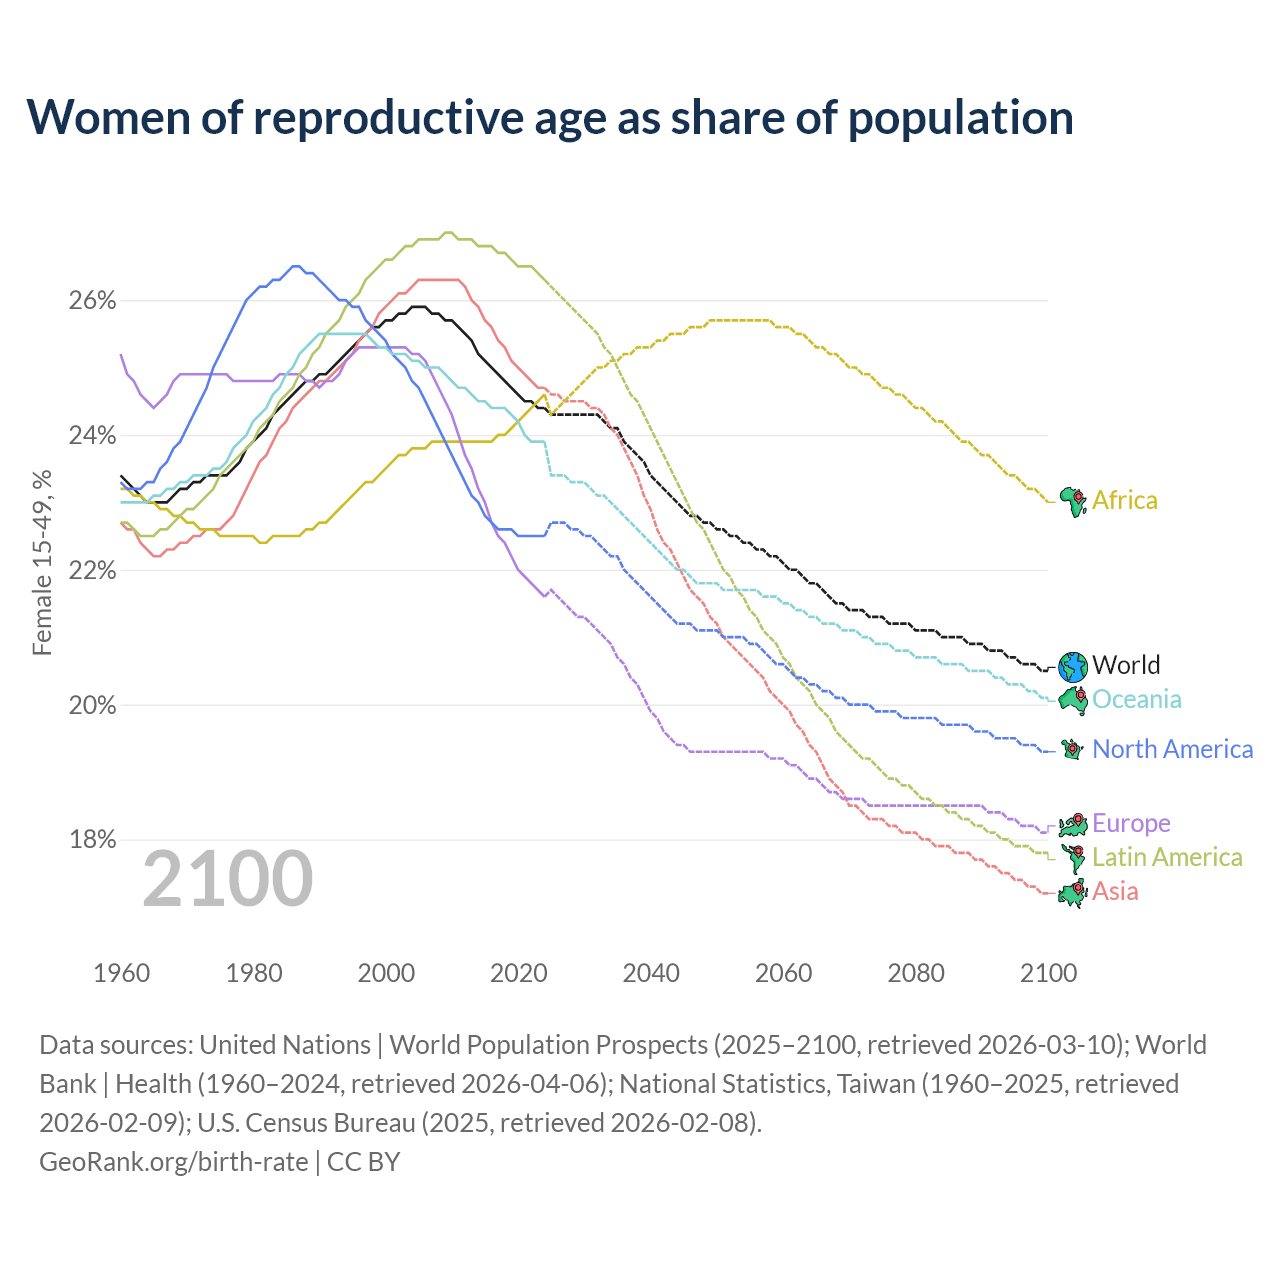
- 24.4% of the population in 2025 is composed of women of reproductive age (15-49), a change from 23.4% in 1960.
- There are approximately 4.2 births per second, 252.1 births per minute, 15,126 per hour, 363,025 per day, 2,541,176 per week, 10,890,756 per month, and 132,504,202 births per year worldwide. Check our world population clock page for the visualization of global birth and death rates.
- 54.1% of married women ages 15-49 use modern contraceptive methods.
- The global life expectancy has increased from 47.8 years in 1960 to around 73.8 years in 2026.
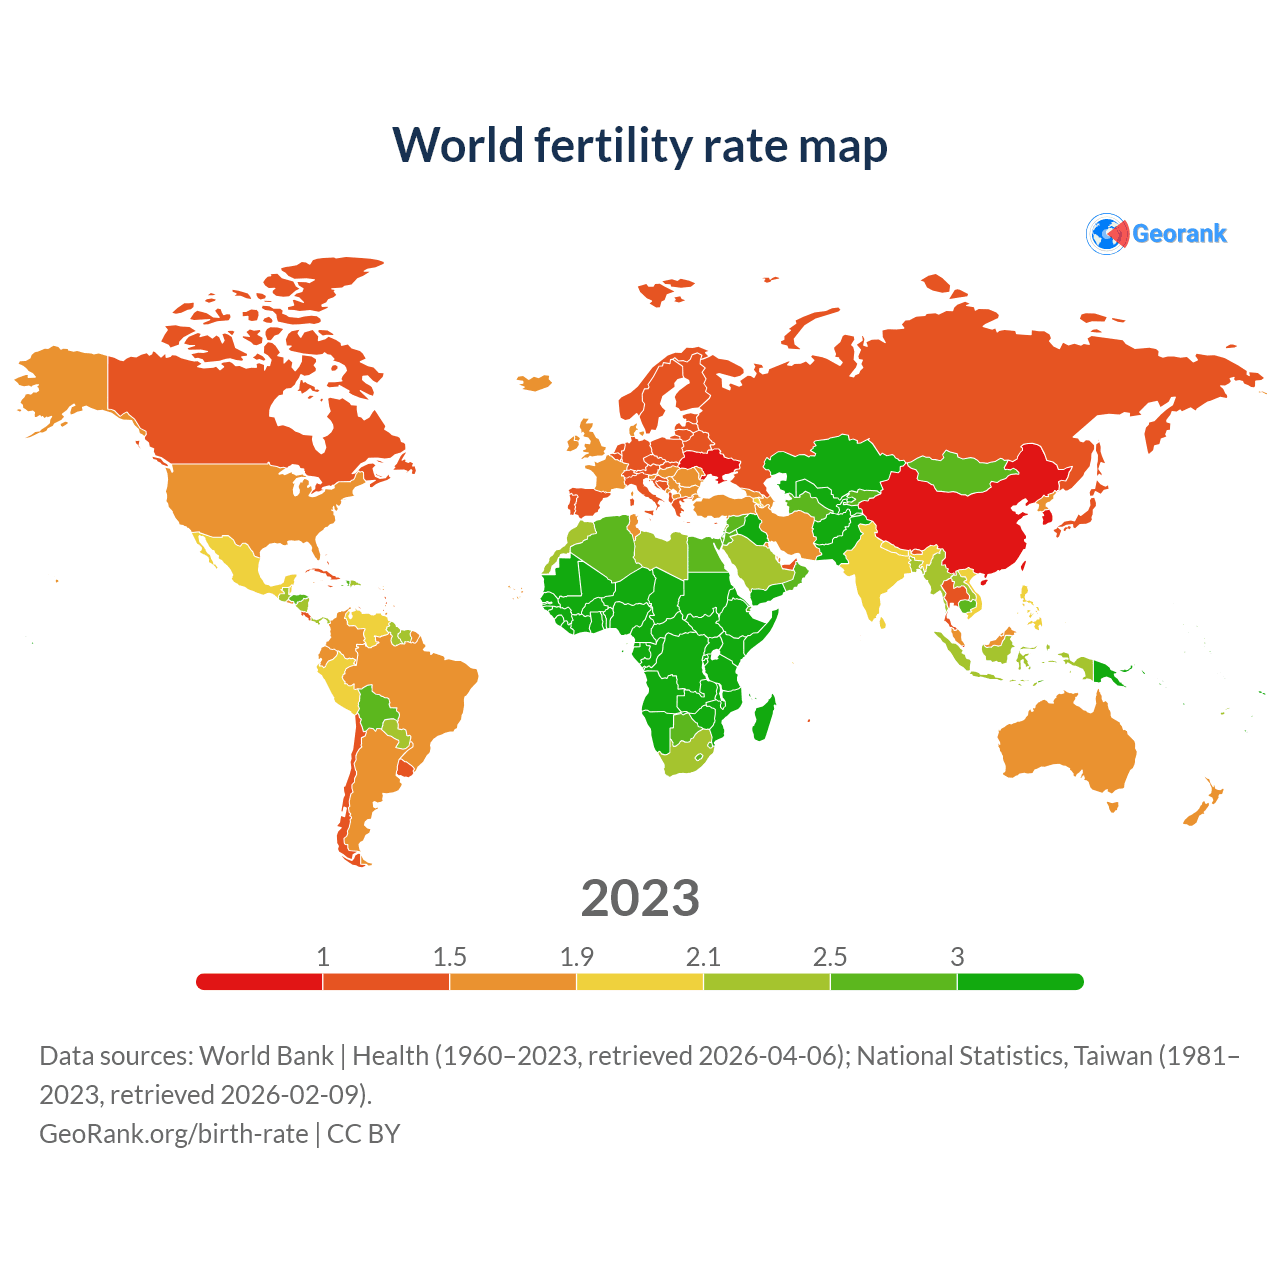
World fertility rate map
Data sources: World Bank | Health (1960–2024, retrieved 2026-07-08); National Statistics, Taiwan (1981–2024, retrieved 2026-07-08).
GeoRank.org/birth-rate | CC BY 
The map color-codes fertility rate by country. Only Africa and South & Southeast Asia remain above the replacement level of 2.1 children per woman, while the rest of the world has fallen below it.
103 of the world's 197 countries, accounting for 66.6% of the population, have a fertility rate below the replacement threshold.
List of countries ranked by fertility rate
The table below ranks 196 countries by fertility rates along with the average ages at first childbirth and natural population changes — changes from births and deaths only, migration excluded.
| Rank | Country | Fertility rate | Birth rate | Age at first childbirth | Natural change | Population |
|---|---|---|---|---|---|---|
| 1 |
 Chad
Chad
|
6.03 | 43.3 | 18.1 | +653,307 | 21M |
| 2 |
 Somalia
|
6.01 | 42.3 | n/a | +619,793 | 19.7M |
| 3 |
 DR Congo
|
5.98 | 40.9 | 19.9 | +3,547,217 | 113M |
| 4 |
 CAR
CAR
|
5.95 | 46.2 | n/a | +196,244 | 5.51M |
| 5 |
 Niger
Niger
|
5.94 | 41.4 | 18.5 | +883,987 | 27.9M |
| 6 |
 Mali
Mali
|
5.51 | 39.5 | 19.2 | +759,375 | 25.2M |
| 7 |
 Angola
|
5.05 | 37.2 | 19.4 | +1,148,623 | 39M |
| 8 |
 Burundi
|
4.79 | 33.2 | 21.5 | +372,843 | 14.4M |
| 9 |
 Afghanistan
|
4.76 | 35 | 19.9 | +1,249,785 | 43.8M |
| 10 |
 Mozambique
|
4.69 | 37 | 19.2 | +1,043,109 | 35.6M |
| 11 |
 Mauritania
|
4.63 | 34 | 21.8 | +147,927 | 5.32M |
| 12 |
 Tanzania
|
4.54 | 34.8 | 19.9 | +1,993,730 | 70.5M |
| 13 |
 Yemen
Yemen
|
4.5 | 34.4 | 20.8 | +1,202,276 | 41.8M |
| 14 |
 Benin
Benin
|
4.48 | 33.4 | 20.5 | +357,359 | 14.8M |
| 15 |
 Nigeria
|
4.38 | 32.5 | 20.4 | +4,851,833 | 238M |
| 16 |
 Sudan
Sudan
|
4.26 | 33 | n/a | +1,345,019 | 51.7M |
| 17 |
 Cameroon
|
4.26 | 33.3 | 20.1 | +766,304 | 29.9M |
| 18 |
 Ivory Coast
|
4.23 | 31.6 | 19.6 | +765,049 | 32.7M |
| 19 |
 Uganda
|
4.17 | 34.4 | 19.4 | +1,483,898 | 51.4M |
| 20 |
 Guinea
|
4.13 | 33.3 | 19.9 | +358,497 | 15.1M |
| 21 |
 Togo
Togo
|
4.12 | 32.1 | 25 | +198,184 | 8.59M |
| 22 |
 Equatorial Guinea
|
4.12 | 30 | n/a | +41,906 | 1.94M |
| 23 |
 Burkina Faso
|
4.11 | 31.3 | 20.1 | +551,536 | 24.1M |
| 24 |
 Congo
Congo
|
4.11 | 30.4 | 19.6 | +153,150 | 6.48M |
| 25 |
 Zambia
|
4.04 | 32.7 | 19.2 | +587,419 | 21.9M |
| 26 |
 Madagascar
|
3.91 | 31.7 | 19.5 | +774,926 | 32.7M |
| 27 |
 Ethiopia
|
3.91 | 31.5 | 19.3 | +3,379,409 | 135M |
| 28 |
 Gambia
|
3.91 | 29.9 | 20.7 | +65,157 | 2.82M |
| 29 |
 Liberia
|
3.86 | 30.6 | 19.1 | +126,631 | 5.73M |
| 30 |
 Comoros
|
3.82 | 28.2 | 23 | +18,294 | 883K |
| 31 |
 Samoa
Samoa
|
3.8 | 25 | 23.6 | +4,101 | 219K |
| 32 |
 South Sudan
|
3.79 | 29.2 | n/a | +231,714 | 12.2M |
| 33 |
 Senegal
|
3.77 | 29.2 | 21.9 | +438,108 | 18.9M |
| 34 |
 Guinea-Bissau
|
3.76 | 29.6 | n/a | +49,642 | 2.25M |
| 35 |
 Sierra Leone
|
3.7 | 30.1 | 19.6 | +189,234 | 8.82M |
| 36 |
 Eritrea
|
3.68 | 28.7 | 21.3 | +80,343 | 3.61M |
| 37 |
 Zimbabwe
|
3.67 | 29.9 | 20.3 | +372,494 | 17M |
| 38 |
 Rwanda
|
3.65 | 28.1 | 23 | +316,025 | 14.6M |
| 39 |
 Sao Tome
|
3.6 | 28.1 | 19.4 | +5,315 | 240K |
| 40 |
 Gabon
Gabon
|
3.59 | 27.1 | 19.6 | +53,067 | 2.59M |
| 41 |
 Malawi
|
3.59 | 31.1 | 19.1 | +559,811 | 22.2M |
| 42 |
 Vanuatu
|
3.57 | 27.7 | n/a | +7,419 | 335K |
| 43 |
 Pakistan
|
3.55 | 27.4 | 22.8 | +5,268,361 | 255M |
| 44 |
 Solomon Islands
|
3.51 | 26.7 | 22.6 | +17,715 | 839K |
| 45 |
 Uzbekistan
|
3.49 | 25.6 | 23.5 | +709,893 | 37.1M |
| 46 |
 Ghana
Ghana
|
3.34 | 25.9 | 22.1 | +651,057 | 35.1M |
| 47 |
 Nauru
Nauru
|
3.29 | 24.6 | 22.1 | +203 | 12K |
| 48 |
 Palestine
|
3.25 | 26.5 | n/a | +108,930 | 5.41M |
| 49 |
 Iraq
Iraq
|
3.22 | 25.6 | n/a | +985,943 | 47M |
| 50 |
 Namibia
|
3.21 | 25.9 | 21.6 | +59,739 | 3.09M |
| 51 |
 Tuvalu
|
3.17 | 22 | 23.5 | +122 | 9.49K |
| 52 |
 Kenya
Kenya
|
3.17 | 27 | 20.3 | +1,116,695 | 57.5M |
| 53 |
 Kiribati
|
3.12 | 25.3 | 23.1 | +2,455 | 136K |
| 54 |
 Tonga
Tonga
|
3.1 | 23 | 24.9 | +1,729 | 104K |
| 55 |
 Papua New Guinea
|
3.07 | 24.3 | 21.9 | +187,595 | 10.8M |
| 56 |
 Tajikistan
|
3.04 | 25.3 | 23.2 | +219,677 | 10.8M |
| 57 |
 Kazakhstan
|
2.98 | 19.5 | 29.5 | +264,079 | 20.8M |
| 58 |
 Israel
|
2.87 | 18.6 | 27.8 | +133,029 | 10.1M |
| 59 |
 Marshall Islands
|
2.86 | 20.1 | 20.7 | +487 | 36.3K |
| 60 |
 Egypt
Egypt
|
2.74 | 20.9 | 22.6 | +1,795,738 | 118M |
| 61 |
 Algeria
|
2.72 | 18.8 | n/a | +665,653 | 47.4M |
| 62 |
 Eswatini
|
2.72 | 23.6 | 19.5 | +19,782 | 1.26M |
| 63 |
 Botswana
|
2.7 | 24.4 | 19 | +46,951 | 2.56M |
| 64 |
 Syria
Syria
|
2.7 | 23.2 | n/a | +449,784 | 25.6M |
| 65 |
 Lesotho
|
2.66 | 23.8 | 20.9 | +31,050 | 2.36M |
| 66 |
 Turkmenistan
|
2.66 | 20.9 | 24.1 | +112,942 | 7.62M |
| 67 |
 East Timor
|
2.63 | 21.8 | 23 | +20,378 | 1.42M |
| 68 |
 Haiti
Haiti
|
2.63 | 21.9 | 22.4 | +166,463 | 11.9M |
| 69 |
 Djibouti
|
2.62 | 20.9 | n/a | +15,712 | 1.18M |
| 70 |
 Jordan
|
2.6 | 20.5 | 24.6 | +200,223 | 11.5M |
| 71 |
 Kyrgyzstan
|
2.6 | 19.4 | 22.6 | +108,328 | 7.34M |
| 72 |
 Cambodia
|
2.55 | 20.3 | 23.3 | +244,386 | 17.8M |
| 73 |
 Bolivia
|
2.52 | 21 | 21.1 | +171,974 | 12.6M |
| 74 |
 Oman
Oman
|
2.51 | 16.8 | n/a | +78,557 | 5.49M |
| 75 |
 Mongolia
|
2.5 | 16.9 | 20.5 | +40,182 | 3.57M |
| 76 |
 Honduras
|
2.48 | 21.6 | 20.3 | +185,444 | 11M |
| 77 |
 Paraguay
|
2.42 | 19.7 | 22.9 | +97,223 | 7.01M |
| 78 |
 Laos
Laos
|
2.4 | 20.9 | n/a | +114,574 | 7.87M |
| 79 |
 Guyana
|
2.4 | 19.9 | 20.8 | +10,310 | 836K |
| 80 |
 Saudi Arabia
|
2.31 | 16.5 | n/a | +499,782 | 37M |
| 81 |
 Libya
Libya
|
2.3 | 16.5 | n/a | +73,522 | 7.46M |
| 82 |
 Guatemala
|
2.29 | 20.6 | 20.6 | +290,066 | 18.7M |
| 83 |
 Fiji
Fiji
|
2.27 | 17.9 | n/a | +7,758 | 933K |
| 84 |
 Suriname
|
2.23 | 17.2 | n/a | +6,541 | 640K |
| 85 |
 Lebanon
|
2.23 | 16 | n/a | +57,613 | 5.85M |
| 86 |
 Dominican Republic
|
2.22 | 17.6 | 20.9 | +129,943 | 11.5M |
| 87 |
 Morocco
|
2.21 | 16.4 | n/a | +406,555 | 38.4M |
| 88 |
 Nicaragua
|
2.21 | 19.1 | 19.2 | +100,318 | 7.01M |
| 89 |
 South Africa
|
2.21 | 18.5 | n/a | +591,618 | 64.7M |
| 90 |
 Bangladesh
|
2.14 | 20 | 18.6 | +2,583,129 | 176M |
| 91 |
 Indonesia
|
2.12 | 15.8 | 22.4 | +2,307,025 | 286M |
| 92 |
 Panama
|
2.11 | 15.9 | n/a | +49,459 | 4.57M |
| 93 |
 Monaco
|
2.1 | 9.56 | 32.5 | -409 | 38.3K |
| 94 |
 Myanmar
|
2.1 | 16.5 | 24.7 | +397,197 | 54.9M |
| 95 |
 Venezuela
|
2.08 | 15.2 | n/a | +214,547 | 28.5M |
| 96 |
 Belize
|
2.02 | 18.1 | n/a | +5,460 | 423K |
| 97 |
 Peru
Peru
|
1.97 | 15.8 | 21.9 | +347,517 | 34.6M |
| 98 |
 India
India
|
1.96 | 16 | 21.2 | +13,630,090 | 1.46B |
| 99 |
 Nepal
Nepal
|
1.96 | 19 | 20.4 | +355,516 | 29.6M |
| 100 |
 Sri Lanka
|
1.95 | 10.1 | 25.6 | +50,407 | 21.8M |
| 101 |
 Vietnam
|
1.9 | 13.4 | n/a | +684,393 | 102M |
| 102 |
 Philippines
|
1.89 | 15.9 | 23.6 | +1,105,612 | 117M |
| 103 |
 Mexico
|
1.89 | 15.5 | 21.3 | +1,209,810 | 132M |
| 104 |
 Palau
Palau
|
1.88 | 10.7 | n/a | -18 | 17.7K |
| 105 |
 Seychelles
|
1.85 | 11 | n/a | +485 | 123K |
| 106 |
 Tunisia
|
1.82 | 13.4 | n/a | +88,910 | 12.3M |
| 107 |
 Ecuador
|
1.81 | 14.8 | n/a | +174,336 | 18.3M |
| 108 |
 Bahrain
|
1.81 | 12 | n/a | +15,606 | 1.6M |
| 109 |
 Georgia
|
1.8 | 11.3 | 26.2 | -2,085 | 3.94M |
| 110 |
 Montenegro
|
1.8 | 11.2 | 26.3 | +624 | 623K |
| 111 |
 North Korea
|
1.78 | 12.9 | n/a | +79,496 | 26.6M |
| 112 |
 El Salvador
|
1.77 | 15.6 | 20.8 | +51,510 | 6.37M |
| 113 |
 Saint Vincent
|
1.76 | 12 | n/a | +42 | 99.9K |
| 114 |
 Brunei
|
1.73 | 13.3 | n/a | +3,699 | 466K |
| 115 |
 Moldova
|
1.73 | 10.6 | 25.1 | -7,767 | 2.36M |
| 116 |
 Bulgaria
|
1.72 | 8.3 | 26.9 | -47,023 | 6.43M |
| 117 |
 Qatar
Qatar
|
1.72 | 9.52 | n/a | +24,214 | 2.97M |
| 118 |
 Barbados
|
1.71 | 11.1 | n/a | +251 | 283K |
| 119 |
 Armenia
|
1.7 | 11.1 | 25.7 | +8,190 | 3.09M |
| 120 |
 Iran
Iran
|
1.68 | 12.6 | n/a | +715,785 | 92.4M |
| 121 |
 Serbia
|
1.64 | 9.2 | 28.5 | -37,543 | 6.55M |
| 122 |
 Colombia
|
1.63 | 13.3 | 21.7 | +411,721 | 53.4M |
| 123 |
 United States
|
1.63 | 10.6 | 27.3 | +544,178 | 342M |
| 124 |
 Brazil
|
1.61 | 12.1 | n/a | +1,073,773 | 213M |
| 125 |
 France
|
1.61 | 9.7 | 29.3 | +20,566 | 68.7M |
| 126 |
 Antigua
|
1.58 | 11.7 | n/a | +442 | 94.2K |
| 127 |
 New Zealand
|
1.57 | 11 | 27.8 | +20,631 | 5.32M |
| 128 |
 Iceland
|
1.56 | 11.2 | 28.9 | +1,700 | 392K |
| 129 |
 Kuwait
|
1.56 | 10 | n/a | +41,627 | 4.87M |
| 130 |
 Maldives
|
1.56 | 10.6 | 23.2 | +4,340 | 530K |
| 131 |
 United Kingdom
|
1.55 | 9.89 | 29 | +13,233 | 69.5M |
| 132 |
 Malaysia
|
1.54 | 12.4 | n/a | +252,068 | 36M |
| 133 |
 Trinidad
|
1.54 | 10.5 | n/a | +2,469 | 1.37M |
| 134 |
 Saint Kitts
|
1.53 | 11.7 | n/a | +82 | 46.9K |
| 135 |
 Cayman Islands
|
1.53 | 11.6 | n/a | +498 | 75.8K |
| 136 |
 Slovenia
|
1.52 | 7.9 | 29.1 | -4,680 | 2.13M |
| 137 |
 Cape Verde
|
1.51 | 12.2 | n/a | +3,741 | 527K |
| 138 |
 Argentina
|
1.5 | 11.1 | n/a | +153,265 | 45.9M |
| 139 |
 Bosnia
|
1.49 | 7.72 | 28 | -18,359 | 3.14M |
| 140 |
 Australia
|
1.48 | 10.7 | 28.7 | +103,773 | 27.6M |
| 141 |
 Dominica
|
1.48 | 11 | n/a | -109 | 65.9K |
| 142 |
 Turkey
|
1.48 | 11 | 27.3 | +453,249 | 85.9M |
| 143 |
 Grenada
|
1.47 | 11.5 | n/a | +300 | 117K |
| 144 |
 Denmark
|
1.47 | 9.5 | 30.3 | +0 | 6.01M |
| 145 |
 Ireland
|
1.47 | 10 | 31.2 | +18,885 | 5.48M |
| 146 |
 Croatia
|
1.46 | 8.3 | 29.5 | -18,944 | 3.88M |
| 147 |
 Slovakia
|
1.46 | 8.5 | 27.4 | -7,591 | 5.41M |
| 148 |
 Norway
|
1.45 | 9.7 | 30.2 | +10,030 | 5.61M |
| 149 |
 Bhutan
|
1.45 | 12.5 | n/a | +5,113 | 797K |
| 150 |
 Cuba
Cuba
|
1.45 | 8.62 | n/a | -19,270 | 10.9M |
| 151 |
 Belgium
|
1.44 | 9.2 | 29.6 | -3,557 | 11.9M |
| 152 |
 Mauritius
|
1.44 | 10.3 | n/a | +374 | 1.24M |
| 153 |
 Azerbaijan
|
1.43 | 10 | 24.6 | +42,852 | 10.2M |
| 154 |
 Netherlands
|
1.43 | 9.2 | 30.5 | -7,197 | 18.1M |
| 155 |
 Sweden
|
1.43 | 9.3 | 30.2 | +7,399 | 10.6M |
| 156 |
 Russia
|
1.42 | 8.4 | 25.2 | -574,678 | 144M |
| 157 |
 Hungary
|
1.41 | 8.2 | 29 | -49,723 | 9.51M |
| 158 |
 Portugal
|
1.41 | 7.9 | 30.3 | -34,223 | 10.8M |
| 159 |
 Curacao
|
1.4 | 7.2 | n/a | -453 | 156K |
| 160 |
 North Macedonia
|
1.4 | 8.8 | 27.8 | -4,196 | 1.82M |
| 161 |
 Uruguay
|
1.4 | 9.8 | n/a | -443 | 3.38M |
| 162 |
 Romania
|
1.39 | 7.5 | 27.2 | -100,975 | 19M |
| 163 |
 Saint Lucia
|
1.39 | 11.2 | n/a | +449 | 180K |
| 164 |
 Cyprus
|
1.38 | 10.5 | 30.1 | +4,756 | 1.37M |
| 165 |
 Bahamas
|
1.37 | 10.8 | n/a | +821 | 403K |
| 166 |
 Liechtenstein
|
1.37 | 8.4 | 31.3 | +36 | 41K |
| 167 |
 Czech Republic
|
1.36 | 7.7 | 29 | -28,353 | 10.9M |
| 168 |
 Germany
|
1.36 | 8.1 | 29.9 | -334,066 | 83.5M |
| 169 |
 Jamaica
|
1.35 | 11.5 | 21.2 | +9,210 | 2.84M |
| 170 |
 Albania
|
1.34 | 10.1 | 26.6 | +3,979 | 2.35M |
| 171 |
 Costa Rica
|
1.32 | 9.99 | n/a | +22,699 | 5.15M |
| 172 |
 Austria
|
1.31 | 8.4 | 30 | -11,013 | 9.21M |
| 173 |
 Switzerland
|
1.29 | 8.7 | 31.3 | +6,304 | 9.09M |
| 174 |
 Canada
|
1.25 | 8.9 | 30 | +41,262 | 41.7M |
| 175 |
 Finland
|
1.25 | 7.8 | 30 | -14,612 | 5.65M |
| 176 |
 Luxembourg
|
1.25 | 9.5 | 31.6 | +1,963 | 687K |
| 177 |
 Greece
|
1.24 | 6.6 | 31.2 | -57,229 | 10.4M |
| 178 |
 Latvia
|
1.24 | 6.9 | 28.1 | -13,809 | 1.85M |
| 179 |
 Belarus
|
1.22 | 7.03 | 26.9 | -55,755 | 9.09M |
| 180 |
 UAE
UAE
|
1.21 | 9.82 | n/a | +97,197 | 11.5M |
| 181 |
 Thailand
|
1.2 | 8.12 | 23.3 | -65,720 | 71.6M |
| 182 |
 Estonia
|
1.18 | 7.1 | 28.9 | -6,038 | 1.37M |
| 183 |
 Italy
Italy
|
1.18 | 6.3 | 31.9 | -277,077 | 58.9M |
| 184 |
 San Marino
|
1.16 | 4.2 | 31.5 | -112 | 34.1K |
| 185 |
 Japan
Japan
|
1.15 | 5.7 | 30.7 | -942,213 | 123M |
| 186 |
 Chile
Chile
|
1.14 | 8.72 | n/a | +42,356 | 19.9M |
| 187 |
 Poland
|
1.14 | 6.9 | 28.7 | -157,205 | 36.4M |
| 188 |
 Lithuania
|
1.11 | 6.6 | 28.7 | -18,485 | 2.89M |
| 189 |
 Spain
Spain
|
1.1 | 6.5 | 31.5 | -117,237 | 49.4M |
| 190 |
 Andorra
|
1.09 | 6.85 | 32.9 | +58 | 82.9K |
| 191 |
 China
China
|
1.01 | 6.77 | n/a | -1,394,886 | 1.41B |
| 192 |
 Malta
Malta
|
1.01 | 7.7 | 29.9 | +228 | 580K |
| 193 |
 Ukraine
|
0.99 | 5.47 | 26.2 | -308,069 | 39M |
| 194 |
 Singapore
|
0.97 | 7.4 | 30.5 | +8,451 | 6.11M |
| 195 |
 Taiwan
|
0.89 | 5.76 | n/a | -67,188 | 23.3M |
| 196 |
 South Korea
|
0.75 | 4.7 | 32.2 | -119,027 | 51.7M |
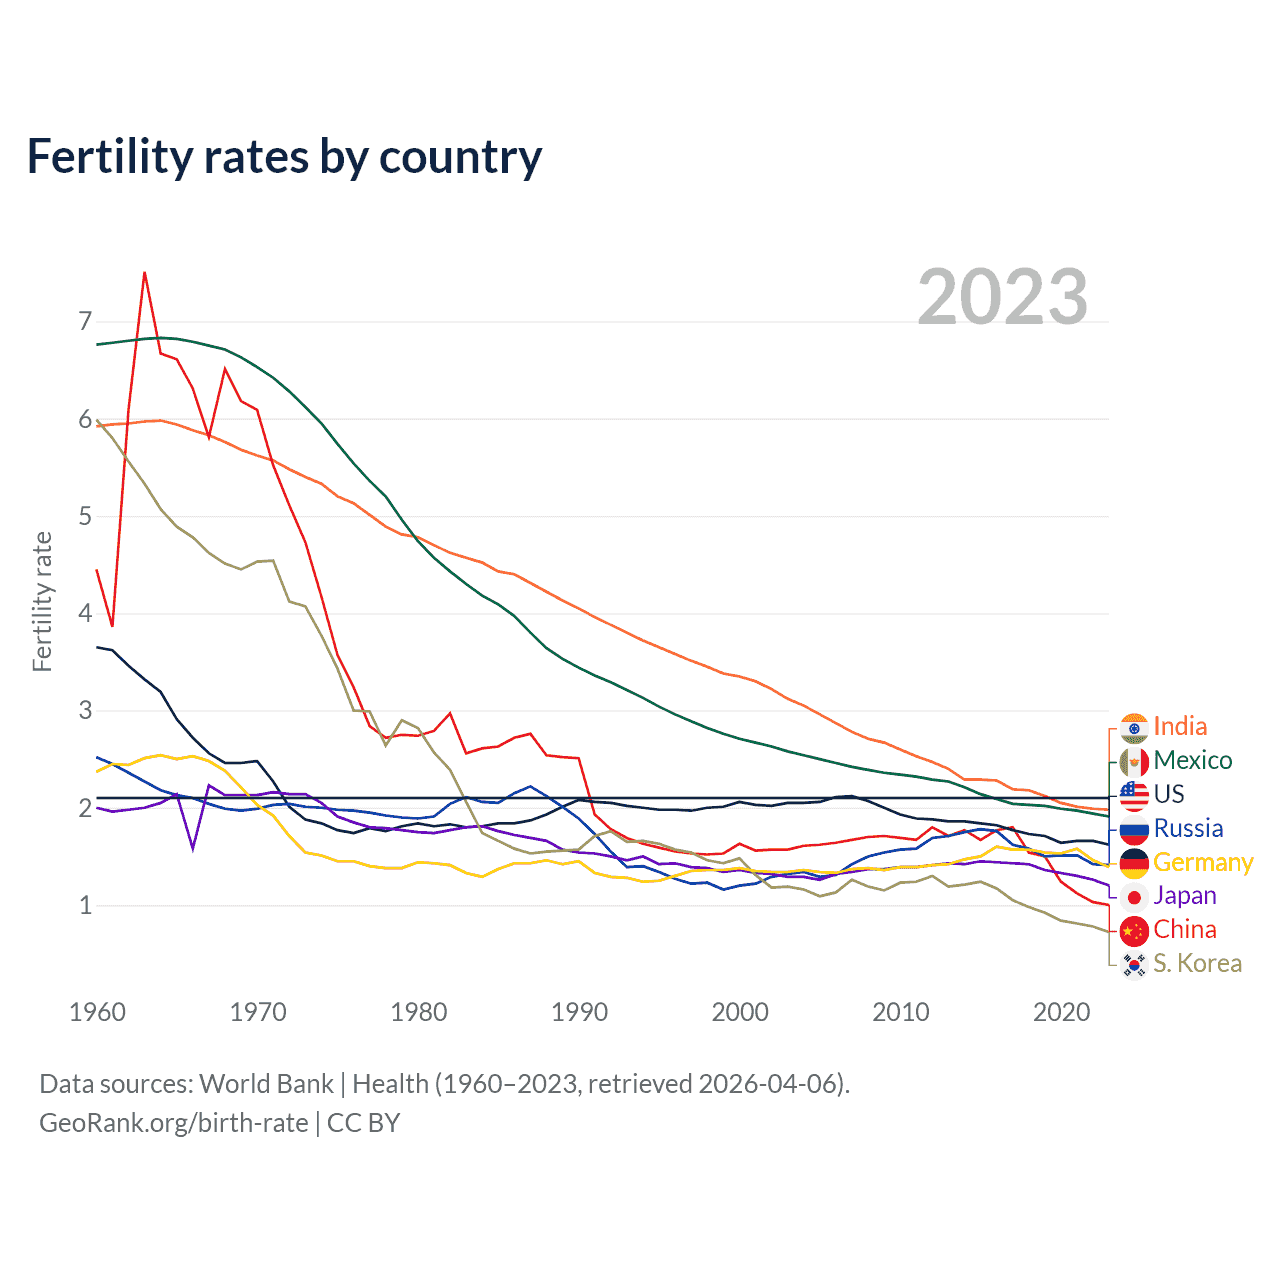
Fertility rates by country
| Year | Fertility rate | |||||||
|---|---|---|---|---|---|---|---|---|
| India | China | United States | Russia | Mexico | Japan | South Korea | Germany | |
| 2024 | 1.96 | 1.01 | 1.63 | 1.42 | 1.89 | 1.15 | 0.75 | 1.36 |
| 2023 | 1.98 | 1 | 1.62 | 1.41 | 1.91 | 1.2 | 0.72 | 1.39 |
| 2022 | 1.99 | 1.03 | 1.66 | 1.42 | 1.94 | 1.26 | 0.78 | 1.46 |
| 2021 | 2.01 | 1.12 | 1.66 | 1.51 | 1.97 | 1.3 | 0.81 | 1.58 |
| 2020 | 2.05 | 1.24 | 1.64 | 1.51 | 1.99 | 1.33 | 0.84 | 1.53 |
| 2019 | 2.12 | 1.5 | 1.71 | 1.5 | 2.02 | 1.36 | 0.92 | 1.54 |
| 2018 | 2.18 | 1.54 | 1.73 | 1.58 | 2.03 | 1.42 | 0.98 | 1.57 |
| 2017 | 2.19 | 1.8 | 1.77 | 1.62 | 2.04 | 1.43 | 1.05 | 1.57 |
| 2016 | 2.28 | 1.77 | 1.82 | 1.76 | 2.09 | 1.44 | 1.17 | 1.6 |
| 2015 | 2.29 | 1.67 | 1.84 | 1.78 | 2.14 | 1.45 | 1.24 | 1.5 |
| 2014 | 2.29 | 1.77 | 1.86 | 1.75 | 2.21 | 1.42 | 1.21 | 1.47 |
| 2013 | 2.4 | 1.71 | 1.86 | 1.71 | 2.27 | 1.43 | 1.19 | 1.42 |
| 2012 | 2.47 | 1.8 | 1.88 | 1.69 | 2.29 | 1.41 | 1.3 | 1.41 |
| 2011 | 2.53 | 1.67 | 1.89 | 1.58 | 2.32 | 1.39 | 1.24 | 1.39 |
| 2010 | 2.6 | 1.69 | 1.93 | 1.57 | 2.34 | 1.39 | 1.23 | 1.39 |
| 2009 | 2.67 | 1.71 | 2 | 1.54 | 2.36 | 1.37 | 1.15 | 1.36 |
| 2008 | 2.71 | 1.7 | 2.07 | 1.5 | 2.39 | 1.37 | 1.19 | 1.38 |
| 2007 | 2.78 | 1.67 | 2.12 | 1.42 | 2.42 | 1.34 | 1.26 | 1.37 |
| 2006 | 2.87 | 1.64 | 2.11 | 1.31 | 2.46 | 1.32 | 1.13 | 1.33 |
| 2005 | 2.96 | 1.62 | 2.06 | 1.29 | 2.5 | 1.26 | 1.09 | 1.34 |
| 2004 | 3.05 | 1.61 | 2.05 | 1.34 | 2.54 | 1.29 | 1.16 | 1.36 |
| 2003 | 3.12 | 1.57 | 2.05 | 1.32 | 2.58 | 1.29 | 1.19 | 1.34 |
| 2002 | 3.22 | 1.57 | 2.02 | 1.29 | 2.63 | 1.32 | 1.18 | 1.34 |
| 2001 | 3.3 | 1.56 | 2.03 | 1.22 | 2.67 | 1.33 | 1.31 | 1.35 |
| 2000 | 3.35 | 1.63 | 2.06 | 1.2 | 2.71 | 1.36 | 1.48 | 1.38 |
| 1999 | 3.38 | 1.53 | 2.01 | 1.16 | 2.76 | 1.34 | 1.43 | 1.36 |
| 1998 | 3.45 | 1.52 | 2 | 1.23 | 2.82 | 1.38 | 1.46 | 1.36 |
| 1997 | 3.51 | 1.53 | 1.97 | 1.22 | 2.89 | 1.39 | 1.54 | 1.35 |
| 1996 | 3.58 | 1.55 | 1.98 | 1.27 | 2.96 | 1.43 | 1.57 | 1.3 |
| 1995 | 3.65 | 1.59 | 1.98 | 1.34 | 3.04 | 1.42 | 1.63 | 1.25 |
| 1994 | 3.72 | 1.63 | 2 | 1.4 | 3.13 | 1.5 | 1.66 | 1.24 |
| 1993 | 3.8 | 1.69 | 2.02 | 1.39 | 3.21 | 1.46 | 1.65 | 1.28 |
| 1992 | 3.88 | 1.78 | 2.05 | 1.55 | 3.29 | 1.5 | 1.76 | 1.29 |
| 1991 | 3.96 | 1.93 | 2.06 | 1.73 | 3.36 | 1.53 | 1.71 | 1.33 |
| 1990 | 4.05 | 2.51 | 2.08 | 1.89 | 3.44 | 1.54 | 1.57 | 1.45 |
| 1989 | 4.13 | 2.52 | 2.01 | 2.01 | 3.53 | 1.57 | 1.56 | 1.42 |
| 1988 | 4.22 | 2.54 | 1.93 | 2.12 | 3.64 | 1.66 | 1.55 | 1.46 |
| 1987 | 4.31 | 2.76 | 1.87 | 2.22 | 3.8 | 1.69 | 1.53 | 1.43 |
| 1986 | 4.4 | 2.72 | 1.84 | 2.15 | 3.97 | 1.72 | 1.58 | 1.43 |
| 1985 | 4.43 | 2.63 | 1.84 | 2.05 | 4.09 | 1.76 | 1.66 | 1.37 |
| 1984 | 4.52 | 2.61 | 1.81 | 2.06 | 4.18 | 1.81 | 1.74 | 1.29 |
| 1983 | 4.57 | 2.56 | 1.8 | 2.11 | 4.3 | 1.8 | 2.06 | 1.33 |
| 1982 | 4.62 | 2.97 | 1.83 | 2.04 | 4.43 | 1.77 | 2.39 | 1.41 |
| 1981 | 4.7 | 2.79 | 1.81 | 1.91 | 4.57 | 1.74 | 2.57 | 1.43 |
| 1980 | 4.78 | 2.74 | 1.84 | 1.89 | 4.74 | 1.75 | 2.82 | 1.44 |
| 1979 | 4.81 | 2.75 | 1.81 | 1.9 | 4.96 | 1.77 | 2.9 | 1.38 |
| 1978 | 4.89 | 2.72 | 1.76 | 1.92 | 5.2 | 1.79 | 2.64 | 1.38 |
| 1977 | 5.01 | 2.84 | 1.79 | 1.95 | 5.36 | 1.8 | 2.99 | 1.4 |
| 1976 | 5.13 | 3.24 | 1.74 | 1.97 | 5.54 | 1.85 | 3 | 1.45 |
| 1975 | 5.2 | 3.57 | 1.77 | 1.98 | 5.74 | 1.91 | 3.43 | 1.45 |
| 1974 | 5.33 | 4.17 | 1.84 | 2 | 5.95 | 2.05 | 3.77 | 1.51 |
| 1973 | 5.4 | 4.73 | 1.88 | 2.01 | 6.12 | 2.14 | 4.07 | 1.54 |
| 1972 | 5.48 | 5.11 | 2.01 | 2.04 | 6.28 | 2.14 | 4.12 | 1.71 |
| 1971 | 5.57 | 5.52 | 2.27 | 2.03 | 6.42 | 2.16 | 4.54 | 1.92 |
| 1970 | 5.62 | 6.09 | 2.48 | 1.99 | 6.53 | 2.13 | 4.53 | 2.03 |
| 1969 | 5.68 | 6.18 | 2.46 | 1.97 | 6.63 | 2.13 | 4.45 | 2.21 |
| 1968 | 5.76 | 6.51 | 2.46 | 1.99 | 6.71 | 2.13 | 4.51 | 2.38 |
| 1967 | 5.83 | 5.81 | 2.56 | 2.04 | 6.75 | 2.23 | 4.62 | 2.48 |
| 1966 | 5.88 | 6.31 | 2.72 | 2.1 | 6.79 | 1.58 | 4.78 | 2.53 |
| 1965 | 5.94 | 6.61 | 2.91 | 2.13 | 6.82 | 2.14 | 4.89 | 2.5 |
| 1964 | 5.98 | 6.67 | 3.19 | 2.18 | 6.83 | 2.05 | 5.07 | 2.54 |
| 1963 | 5.97 | 7.51 | 3.32 | 2.27 | 6.82 | 2 | 5.33 | 2.51 |
| 1962 | 5.95 | 6.09 | 3.46 | 2.36 | 6.8 | 1.98 | 5.56 | 2.44 |
| 1961 | 5.94 | 3.86 | 3.62 | 2.45 | 6.78 | 1.96 | 5.8 | 2.45 |
| 1960 | 5.92 | 4.45 | 3.65 | 2.52 | 6.76 | 2 | 5.99 | 2.37 |
Data sources: World Bank | Health (1960–2024, retrieved 2026-07-08).
GeoRank.org/birth-rate | CC BY
On the comparison chart above, all countries besides Japan had fertility rates above 2.1 children per woman in 1960: India had a fertility rate of 5.92, China — 4.45, the United States — 3.65, Russia — 2.52, Mexico — 6.76, Germany — 2.37, and South Korea — 5.99. As of 2024, all these countries have fallen below the population replacement level along with most other developed nations.
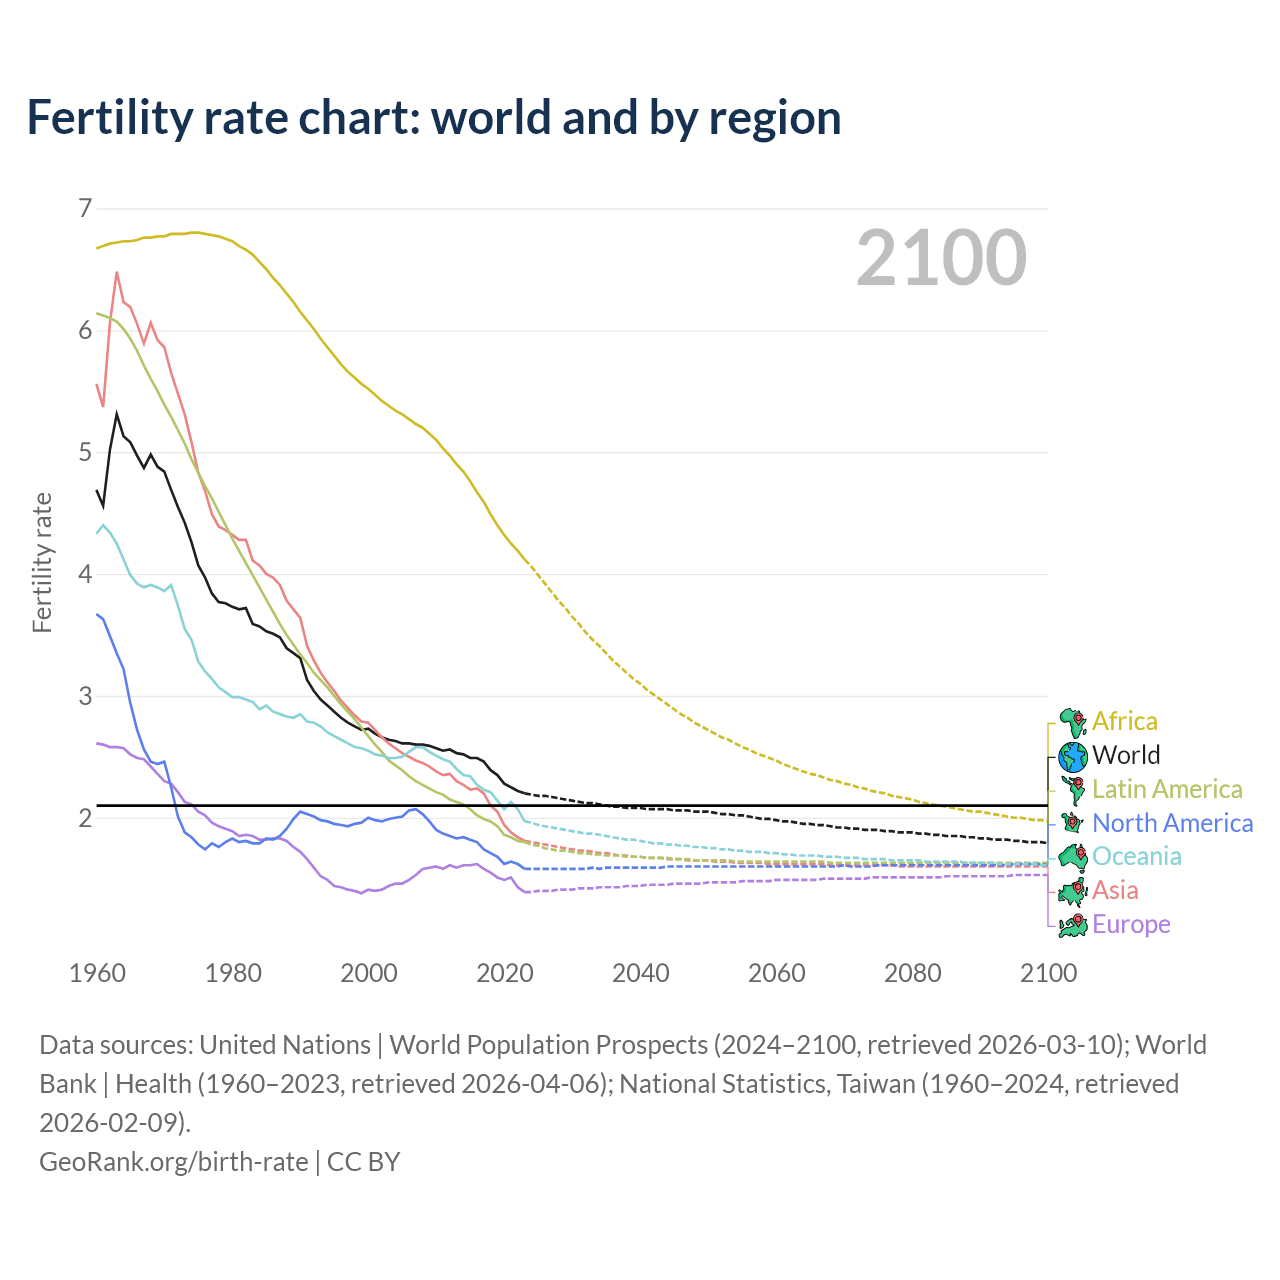
Fertility rate chart: world and by region
| Year | Fertility rate | ||||||
|---|---|---|---|---|---|---|---|
| World | Asia | Africa | Europe | Latin America | North America | Oceania | |
| 2100 | 1.79 | 1.6 | 1.97 | 1.5 | 1.63 | 1.62 | 1.6 |
| 2099 | 1.79 | 1.6 | 1.98 | 1.5 | 1.63 | 1.63 | 1.6 |
| 2098 | 1.8 | 1.6 | 1.98 | 1.5 | 1.63 | 1.62 | 1.61 |
| 2097 | 1.8 | 1.6 | 1.99 | 1.49 | 1.63 | 1.63 | 1.61 |
| 2096 | 1.8 | 1.6 | 2 | 1.49 | 1.63 | 1.62 | 1.61 |
| 2095 | 1.81 | 1.6 | 2.01 | 1.49 | 1.63 | 1.63 | 1.61 |
| 2094 | 1.81 | 1.6 | 2.01 | 1.49 | 1.63 | 1.62 | 1.61 |
| 2093 | 1.82 | 1.6 | 2.02 | 1.49 | 1.63 | 1.62 | 1.62 |
| 2092 | 1.82 | 1.6 | 2.03 | 1.49 | 1.63 | 1.62 | 1.62 |
| 2091 | 1.82 | 1.6 | 2.04 | 1.49 | 1.63 | 1.62 | 1.62 |
| 2090 | 1.83 | 1.6 | 2.05 | 1.49 | 1.63 | 1.62 | 1.62 |
| 2089 | 1.83 | 1.6 | 2.06 | 1.49 | 1.63 | 1.62 | 1.62 |
| 2088 | 1.84 | 1.6 | 2.06 | 1.49 | 1.63 | 1.62 | 1.62 |
| 2087 | 1.84 | 1.6 | 2.07 | 1.49 | 1.63 | 1.62 | 1.63 |
| 2086 | 1.85 | 1.6 | 2.08 | 1.48 | 1.63 | 1.62 | 1.63 |
| 2085 | 1.85 | 1.6 | 2.09 | 1.48 | 1.63 | 1.62 | 1.63 |
| 2084 | 1.85 | 1.6 | 2.1 | 1.48 | 1.63 | 1.62 | 1.63 |
| 2083 | 1.86 | 1.6 | 2.11 | 1.48 | 1.63 | 1.62 | 1.63 |
| 2082 | 1.86 | 1.6 | 2.12 | 1.48 | 1.63 | 1.62 | 1.63 |
| 2081 | 1.87 | 1.6 | 2.14 | 1.48 | 1.63 | 1.62 | 1.64 |
| 2080 | 1.87 | 1.6 | 2.15 | 1.48 | 1.63 | 1.62 | 1.64 |
| 2079 | 1.87 | 1.6 | 2.16 | 1.48 | 1.63 | 1.62 | 1.64 |
| 2078 | 1.88 | 1.6 | 2.17 | 1.48 | 1.63 | 1.62 | 1.64 |
| 2077 | 1.88 | 1.61 | 2.18 | 1.48 | 1.63 | 1.62 | 1.64 |
| 2076 | 1.89 | 1.61 | 2.2 | 1.47 | 1.63 | 1.62 | 1.65 |
| 2075 | 1.89 | 1.61 | 2.21 | 1.47 | 1.63 | 1.62 | 1.65 |
| 2074 | 1.9 | 1.61 | 2.22 | 1.47 | 1.63 | 1.61 | 1.65 |
| 2073 | 1.9 | 1.61 | 2.24 | 1.47 | 1.63 | 1.61 | 1.65 |
| 2072 | 1.91 | 1.61 | 2.25 | 1.47 | 1.63 | 1.61 | 1.66 |
| 2071 | 1.91 | 1.61 | 2.27 | 1.47 | 1.63 | 1.61 | 1.66 |
| 2070 | 1.91 | 1.61 | 2.28 | 1.47 | 1.63 | 1.62 | 1.66 |
| 2069 | 1.92 | 1.61 | 2.3 | 1.47 | 1.63 | 1.61 | 1.67 |
| 2068 | 1.93 | 1.61 | 2.32 | 1.46 | 1.63 | 1.61 | 1.67 |
| 2067 | 1.93 | 1.61 | 2.33 | 1.46 | 1.64 | 1.61 | 1.67 |
| 2066 | 1.94 | 1.62 | 2.35 | 1.46 | 1.64 | 1.61 | 1.68 |
| 2065 | 1.94 | 1.62 | 2.37 | 1.46 | 1.64 | 1.61 | 1.68 |
| 2064 | 1.95 | 1.62 | 2.39 | 1.46 | 1.64 | 1.61 | 1.68 |
| 2063 | 1.96 | 1.62 | 2.4 | 1.46 | 1.64 | 1.61 | 1.69 |
| 2062 | 1.96 | 1.62 | 2.43 | 1.46 | 1.64 | 1.61 | 1.69 |
| 2061 | 1.97 | 1.62 | 2.45 | 1.46 | 1.64 | 1.61 | 1.69 |
| 2060 | 1.98 | 1.62 | 2.47 | 1.45 | 1.64 | 1.61 | 1.7 |
| 2059 | 1.98 | 1.62 | 2.49 | 1.45 | 1.64 | 1.61 | 1.7 |
| 2058 | 1.99 | 1.63 | 2.51 | 1.45 | 1.64 | 1.61 | 1.71 |
| 2057 | 2 | 1.63 | 2.53 | 1.45 | 1.64 | 1.61 | 1.71 |
| 2056 | 2 | 1.63 | 2.56 | 1.45 | 1.64 | 1.61 | 1.71 |
| 2055 | 2.01 | 1.63 | 2.58 | 1.44 | 1.64 | 1.61 | 1.72 |
| 2054 | 2.02 | 1.63 | 2.61 | 1.44 | 1.65 | 1.61 | 1.72 |
| 2053 | 2.02 | 1.64 | 2.64 | 1.44 | 1.65 | 1.61 | 1.73 |
| 2052 | 2.03 | 1.64 | 2.67 | 1.44 | 1.65 | 1.61 | 1.73 |
| 2051 | 2.04 | 1.64 | 2.69 | 1.44 | 1.65 | 1.61 | 1.74 |
| 2050 | 2.04 | 1.65 | 2.72 | 1.44 | 1.65 | 1.61 | 1.74 |
| 2049 | 2.05 | 1.65 | 2.76 | 1.43 | 1.65 | 1.61 | 1.75 |
| 2048 | 2.05 | 1.65 | 2.79 | 1.43 | 1.66 | 1.61 | 1.75 |
| 2047 | 2.05 | 1.65 | 2.82 | 1.43 | 1.66 | 1.61 | 1.76 |
| 2046 | 2.06 | 1.66 | 2.86 | 1.43 | 1.66 | 1.61 | 1.76 |
| 2045 | 2.06 | 1.66 | 2.89 | 1.42 | 1.66 | 1.61 | 1.77 |
| 2044 | 2.06 | 1.66 | 2.93 | 1.42 | 1.67 | 1.6 | 1.77 |
| 2043 | 2.06 | 1.67 | 2.97 | 1.42 | 1.67 | 1.6 | 1.78 |
| 2042 | 2.07 | 1.67 | 3.01 | 1.42 | 1.67 | 1.6 | 1.79 |
| 2041 | 2.07 | 1.68 | 3.05 | 1.41 | 1.67 | 1.6 | 1.79 |
| 2040 | 2.07 | 1.68 | 3.1 | 1.41 | 1.68 | 1.6 | 1.8 |
| 2039 | 2.07 | 1.69 | 3.15 | 1.41 | 1.68 | 1.6 | 1.81 |
| 2038 | 2.08 | 1.69 | 3.19 | 1.41 | 1.68 | 1.6 | 1.82 |
| 2037 | 2.08 | 1.7 | 3.24 | 1.4 | 1.69 | 1.6 | 1.82 |
| 2036 | 2.09 | 1.7 | 3.3 | 1.4 | 1.69 | 1.6 | 1.83 |
| 2035 | 2.1 | 1.71 | 3.35 | 1.4 | 1.69 | 1.6 | 1.84 |
| 2034 | 2.1 | 1.71 | 3.41 | 1.39 | 1.7 | 1.59 | 1.85 |
| 2033 | 2.11 | 1.72 | 3.47 | 1.39 | 1.7 | 1.59 | 1.86 |
| 2032 | 2.12 | 1.73 | 3.53 | 1.39 | 1.71 | 1.59 | 1.87 |
| 2031 | 2.13 | 1.73 | 3.59 | 1.38 | 1.71 | 1.59 | 1.87 |
| 2030 | 2.14 | 1.74 | 3.65 | 1.38 | 1.72 | 1.59 | 1.88 |
| 2029 | 2.15 | 1.75 | 3.72 | 1.38 | 1.73 | 1.59 | 1.89 |
| 2028 | 2.15 | 1.76 | 3.78 | 1.38 | 1.73 | 1.59 | 1.91 |
| 2027 | 2.16 | 1.77 | 3.85 | 1.37 | 1.74 | 1.58 | 1.91 |
| 2026 | 2.17 | 1.78 | 3.92 | 1.37 | 1.76 | 1.59 | 1.92 |
| 2025 | 2.18 | 1.79 | 3.99 | 1.36 | 1.77 | 1.59 | 1.94 |
| 2024 | 2.19 | 1.81 | 4.06 | 1.36 | 1.79 | 1.59 | 1.95 |
| 2023 | 2.2 | 1.82 | 4.13 | 1.39 | 1.8 | 1.58 | 1.97 |
| 2022 | 2.22 | 1.84 | 4.19 | 1.43 | 1.81 | 1.62 | 2.08 |
| 2021 | 2.25 | 1.89 | 4.26 | 1.51 | 1.84 | 1.64 | 2.13 |
| 2020 | 2.28 | 1.94 | 4.33 | 1.49 | 1.86 | 1.62 | 2.07 |
| 2019 | 2.35 | 2.06 | 4.41 | 1.51 | 1.93 | 1.68 | 2.14 |
| 2018 | 2.39 | 2.11 | 4.5 | 1.55 | 1.97 | 1.71 | 2.21 |
| 2017 | 2.46 | 2.2 | 4.6 | 1.58 | 1.99 | 1.74 | 2.23 |
| 2016 | 2.49 | 2.24 | 4.68 | 1.62 | 2.02 | 1.8 | 2.27 |
| 2015 | 2.49 | 2.23 | 4.77 | 1.61 | 2.07 | 1.82 | 2.34 |
| 2014 | 2.52 | 2.28 | 4.84 | 1.61 | 2.11 | 1.84 | 2.35 |
| 2013 | 2.52 | 2.3 | 4.91 | 1.59 | 2.13 | 1.83 | 2.4 |
| 2012 | 2.56 | 2.36 | 4.98 | 1.61 | 2.15 | 1.85 | 2.46 |
| 2011 | 2.55 | 2.35 | 5.04 | 1.58 | 2.19 | 1.87 | 2.48 |
| 2010 | 2.57 | 2.39 | 5.1 | 1.6 | 2.21 | 1.9 | 2.51 |
| 2009 | 2.59 | 2.43 | 5.16 | 1.59 | 2.24 | 1.97 | 2.54 |
| 2008 | 2.6 | 2.45 | 5.21 | 1.58 | 2.27 | 2.03 | 2.58 |
| 2007 | 2.6 | 2.47 | 5.24 | 1.53 | 2.3 | 2.07 | 2.58 |
| 2006 | 2.61 | 2.5 | 5.28 | 1.49 | 2.34 | 2.06 | 2.54 |
| 2005 | 2.61 | 2.53 | 5.32 | 1.46 | 2.39 | 2.01 | 2.5 |
| 2004 | 2.63 | 2.58 | 5.35 | 1.46 | 2.43 | 2 | 2.49 |
| 2003 | 2.64 | 2.61 | 5.39 | 1.44 | 2.48 | 1.99 | 2.49 |
| 2002 | 2.66 | 2.67 | 5.43 | 1.41 | 2.54 | 1.97 | 2.51 |
| 2001 | 2.69 | 2.72 | 5.48 | 1.4 | 2.6 | 1.98 | 2.52 |
| 2000 | 2.73 | 2.79 | 5.53 | 1.41 | 2.67 | 2 | 2.55 |
| 1999 | 2.72 | 2.8 | 5.57 | 1.38 | 2.74 | 1.96 | 2.57 |
| 1998 | 2.75 | 2.85 | 5.62 | 1.4 | 2.81 | 1.95 | 2.58 |
| 1997 | 2.78 | 2.91 | 5.67 | 1.41 | 2.87 | 1.93 | 2.61 |
| 1996 | 2.82 | 2.97 | 5.73 | 1.43 | 2.93 | 1.94 | 2.64 |
| 1995 | 2.87 | 3.05 | 5.8 | 1.44 | 3 | 1.94 | 2.67 |
| 1994 | 2.92 | 3.12 | 5.87 | 1.49 | 3.07 | 1.97 | 2.71 |
| 1993 | 2.97 | 3.2 | 5.94 | 1.52 | 3.13 | 1.98 | 2.75 |
| 1992 | 3.04 | 3.3 | 6.01 | 1.59 | 3.19 | 2.01 | 2.79 |
| 1991 | 3.13 | 3.42 | 6.08 | 1.66 | 3.27 | 2.03 | 2.79 |
| 1990 | 3.31 | 3.65 | 6.16 | 1.72 | 3.35 | 2.05 | 2.85 |
| 1989 | 3.35 | 3.71 | 6.23 | 1.76 | 3.42 | 1.99 | 2.82 |
| 1988 | 3.39 | 3.79 | 6.31 | 1.81 | 3.5 | 1.91 | 2.83 |
| 1987 | 3.48 | 3.92 | 6.37 | 1.83 | 3.59 | 1.85 | 2.85 |
| 1986 | 3.51 | 3.98 | 6.44 | 1.83 | 3.7 | 1.82 | 2.88 |
| 1985 | 3.53 | 4.01 | 6.5 | 1.82 | 3.79 | 1.83 | 2.92 |
| 1984 | 3.57 | 4.08 | 6.56 | 1.82 | 3.89 | 1.79 | 2.89 |
| 1983 | 3.59 | 4.12 | 6.62 | 1.85 | 3.99 | 1.79 | 2.95 |
| 1982 | 3.72 | 4.29 | 6.66 | 1.86 | 4.09 | 1.81 | 2.97 |
| 1981 | 3.71 | 4.29 | 6.7 | 1.85 | 4.19 | 1.8 | 3 |
| 1980 | 3.73 | 4.33 | 6.73 | 1.89 | 4.29 | 1.83 | 2.99 |
| 1979 | 3.76 | 4.37 | 6.75 | 1.91 | 4.4 | 1.8 | 3.03 |
| 1978 | 3.77 | 4.4 | 6.78 | 1.93 | 4.52 | 1.76 | 3.08 |
| 1977 | 3.84 | 4.5 | 6.79 | 1.96 | 4.62 | 1.79 | 3.15 |
| 1976 | 3.97 | 4.69 | 6.79 | 2.02 | 4.72 | 1.74 | 3.2 |
| 1975 | 4.07 | 4.84 | 6.8 | 2.05 | 4.83 | 1.78 | 3.28 |
| 1974 | 4.26 | 5.09 | 6.8 | 2.11 | 4.94 | 1.84 | 3.46 |
| 1973 | 4.42 | 5.32 | 6.79 | 2.13 | 5.07 | 1.88 | 3.55 |
| 1972 | 4.55 | 5.49 | 6.79 | 2.21 | 5.18 | 2.01 | 3.75 |
| 1971 | 4.69 | 5.66 | 6.79 | 2.28 | 5.29 | 2.25 | 3.91 |
| 1970 | 4.84 | 5.86 | 6.78 | 2.3 | 5.39 | 2.46 | 3.86 |
| 1969 | 4.88 | 5.93 | 6.77 | 2.36 | 5.5 | 2.44 | 3.9 |
| 1968 | 4.98 | 6.06 | 6.76 | 2.42 | 5.6 | 2.46 | 3.91 |
| 1967 | 4.87 | 5.89 | 6.76 | 2.48 | 5.72 | 2.56 | 3.89 |
| 1966 | 4.97 | 6.05 | 6.74 | 2.49 | 5.83 | 2.72 | 3.92 |
| 1965 | 5.08 | 6.19 | 6.73 | 2.52 | 5.93 | 2.94 | 3.99 |
| 1964 | 5.13 | 6.23 | 6.72 | 2.57 | 6.01 | 3.22 | 4.12 |
| 1963 | 5.31 | 6.48 | 6.72 | 2.58 | 6.07 | 3.35 | 4.26 |
| 1962 | 5.02 | 6.06 | 6.71 | 2.58 | 6.11 | 3.49 | 4.34 |
| 1961 | 4.56 | 5.38 | 6.69 | 2.6 | 6.12 | 3.63 | 4.4 |
| 1960 | 4.69 | 5.56 | 6.67 | 2.61 | 6.14 | 3.67 | 4.33 |
Data sources: United Nations | World Population Prospects (2025–2100, retrieved 2026-07-08); World Bank | Health (1960–2024, retrieved 2026-07-08); National Statistics, Taiwan (1960–2024, retrieved 2026-07-08).
GeoRank.org/birth-rate | CC BY
Of the top 30 countries by birth rate, 28 are in Africa. It's estimated that Africa will add 2.25B people by 2100, while most regions will stagnate or even decline in population, depending on migration. The chart above showcases the global year-by-year historical fertility rates with a regional breakdown and projection.
Global birth rates by women's age
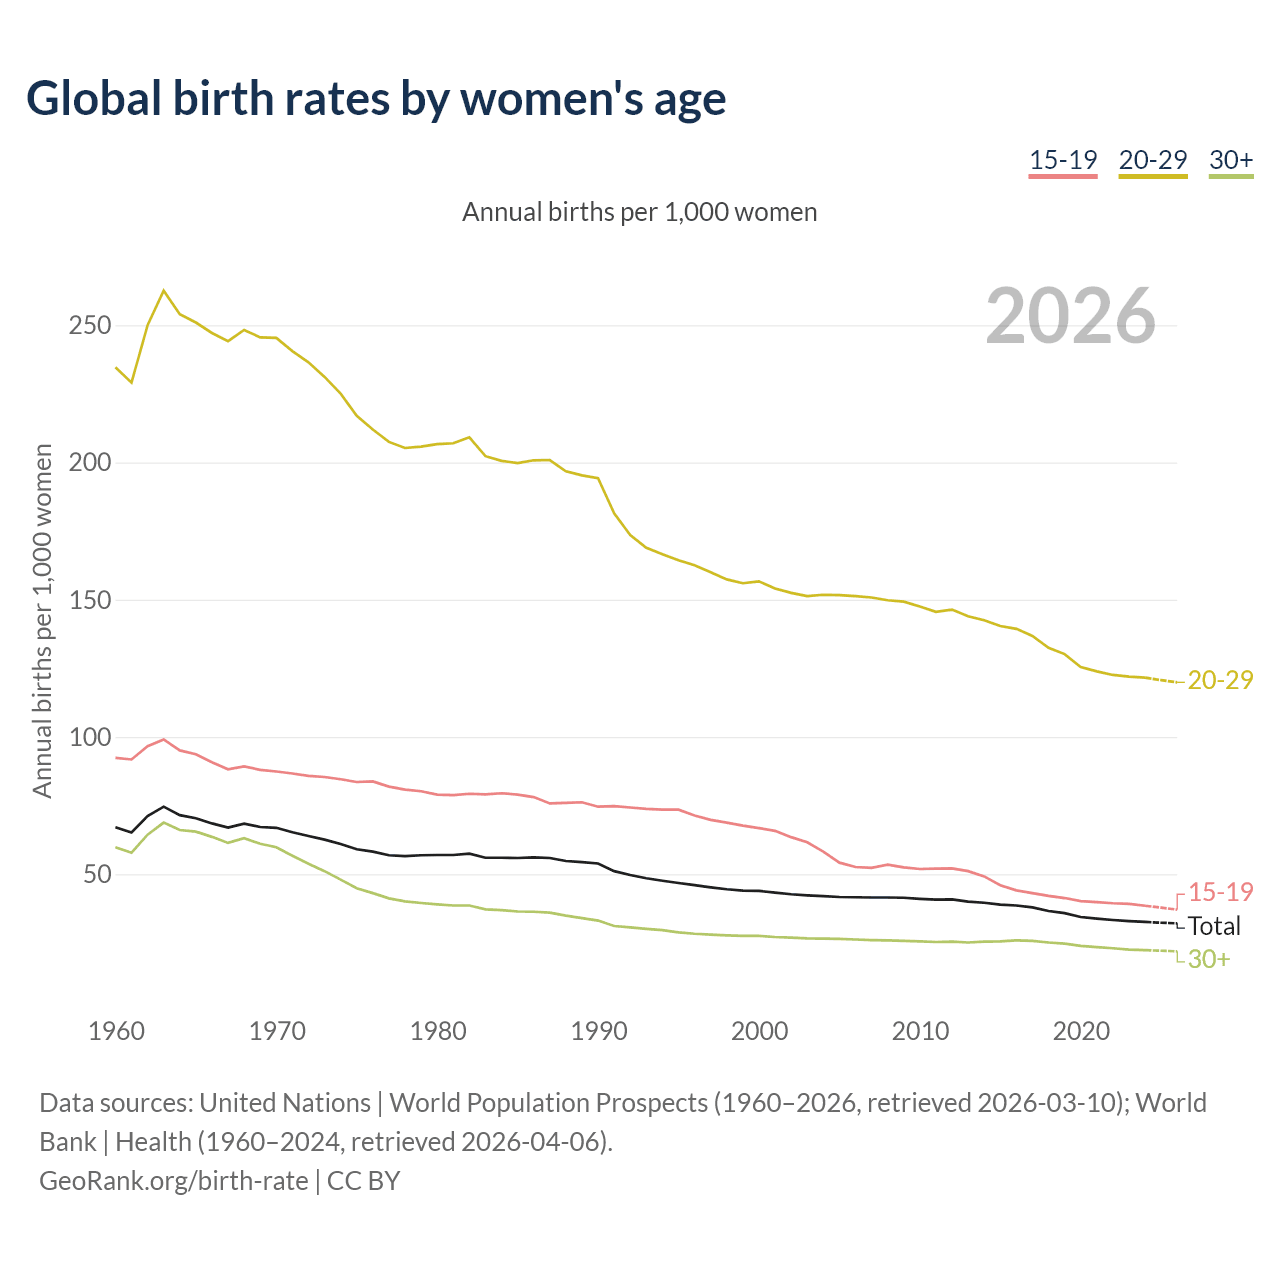
Annual births per 1,000 women
| Year | Annual births per 1,000 women | |||
|---|---|---|---|---|
| Total per 1,000 women | 15-19 | 20-29 | 30+ | |
| 2026 | 32.1 | 37.1 | 119.9 | 21.9 |
| 2025 | 32.3 | 37.8 | 120.7 | 22.1 |
| 2024 | 32.6 | 38.5 | 121.6 | 22.3 |
| 2023 | 32.9 | 39.2 | 122 | 22.5 |
| 2022 | 33.3 | 39.4 | 122.6 | 23 |
| 2021 | 33.8 | 39.8 | 123.9 | 23.4 |
| 2020 | 34.4 | 40.2 | 125.5 | 23.9 |
| 2019 | 35.8 | 41.3 | 130.2 | 24.7 |
| 2018 | 36.6 | 42.1 | 132.5 | 25.1 |
| 2017 | 37.9 | 43.1 | 136.8 | 25.7 |
| 2016 | 38.6 | 44.1 | 139.4 | 25.9 |
| 2015 | 38.9 | 46 | 140.4 | 25.5 |
| 2014 | 39.6 | 49.2 | 142.5 | 25.4 |
| 2013 | 40 | 51.1 | 144 | 25.1 |
| 2012 | 40.8 | 52.1 | 146.4 | 25.4 |
| 2011 | 40.7 | 52 | 145.6 | 25.3 |
| 2010 | 41 | 51.9 | 147.5 | 25.5 |
| 2009 | 41.4 | 52.5 | 149.3 | 25.7 |
| 2008 | 41.5 | 53.5 | 149.8 | 25.9 |
| 2007 | 41.5 | 52.3 | 150.8 | 26 |
| 2006 | 41.6 | 52.6 | 151.3 | 26.2 |
| 2005 | 41.7 | 54.2 | 151.7 | 26.4 |
| 2004 | 42 | 58.2 | 151.8 | 26.5 |
| 2003 | 42.3 | 61.6 | 151.3 | 26.6 |
| 2002 | 42.7 | 63.5 | 152.5 | 26.9 |
| 2001 | 43.3 | 65.8 | 154.1 | 27.1 |
| 2000 | 43.9 | 66.8 | 156.7 | 27.5 |
| 1999 | 44 | 67.7 | 156 | 27.5 |
| 1998 | 44.5 | 68.8 | 157.4 | 27.7 |
| 1997 | 45.2 | 69.8 | 160 | 28 |
| 1996 | 46 | 71.4 | 162.6 | 28.3 |
| 1995 | 46.8 | 73.5 | 164.4 | 28.8 |
| 1994 | 47.6 | 73.5 | 166.6 | 29.6 |
| 1993 | 48.5 | 73.8 | 168.9 | 30.1 |
| 1992 | 49.7 | 74.3 | 173.6 | 30.6 |
| 1991 | 51.1 | 74.8 | 181.5 | 31.1 |
| 1990 | 53.9 | 74.6 | 194.3 | 33.1 |
| 1989 | 54.4 | 76.2 | 195.3 | 34 |
| 1988 | 54.8 | 76 | 196.8 | 34.9 |
| 1987 | 55.9 | 75.8 | 200.9 | 36 |
| 1986 | 56.1 | 78.1 | 200.8 | 36.3 |
| 1985 | 55.9 | 79 | 199.8 | 36.4 |
| 1984 | 56 | 79.5 | 200.6 | 36.9 |
| 1983 | 56 | 79.1 | 202.3 | 37.2 |
| 1982 | 57.5 | 79.3 | 209.2 | 38.6 |
| 1981 | 57 | 78.8 | 207 | 38.6 |
| 1980 | 57 | 79 | 206.7 | 39 |
| 1979 | 56.9 | 80.2 | 205.8 | 39.5 |
| 1978 | 56.6 | 80.8 | 205.3 | 40.1 |
| 1977 | 56.9 | 81.9 | 207.5 | 41.2 |
| 1976 | 58.2 | 83.8 | 212 | 43.1 |
| 1975 | 59.1 | 83.6 | 217 | 44.9 |
| 1974 | 61 | 84.6 | 225.1 | 48 |
| 1973 | 62.6 | 85.4 | 231.2 | 51.1 |
| 1972 | 63.9 | 85.8 | 236.5 | 53.8 |
| 1971 | 65.3 | 86.7 | 240.6 | 56.7 |
| 1970 | 66.9 | 87.4 | 245.4 | 59.8 |
| 1969 | 67.2 | 88 | 245.6 | 61.1 |
| 1968 | 68.4 | 89.3 | 248.3 | 63.1 |
| 1967 | 67 | 88.2 | 244.2 | 61.4 |
| 1966 | 68.5 | 90.8 | 247.2 | 63.6 |
| 1965 | 70.4 | 93.7 | 251 | 65.5 |
| 1964 | 71.5 | 95.1 | 254 | 66.1 |
| 1963 | 74.6 | 99.1 | 262.6 | 68.8 |
| 1962 | 71.2 | 96.6 | 250 | 64.4 |
| 1961 | 65.2 | 91.8 | 229.1 | 57.8 |
| 1960 | 67.1 | 92.4 | 234.7 | 59.8 |
Data sources: United Nations | World Population Prospects (1960–2026, retrieved 2026-07-08); World Bank | Health (1960–2025, retrieved 2026-07-08).
GeoRank.org/birth-rate | CC BY
Birth rates have declined across all age groups. From 1960 to 2026, the global birth rate per 1,000 women ages 15-19 dropped from 92.4 to 37.1. For women ages 20-29, it decreased from 234.7 to 119.9, and for those ages 30 and older, it fell from 59.8 to 21.9.
Accounting for age distribution, 9.02% of all births in 2026 will be to women under age 20, 54.2% to women ages 20-29, and 36.8% to women ages 30 and above. In 1990, the percentages were 13.3%, 61.7%, and 25% for the same age groups, respectively.
Absolute natural population change by country
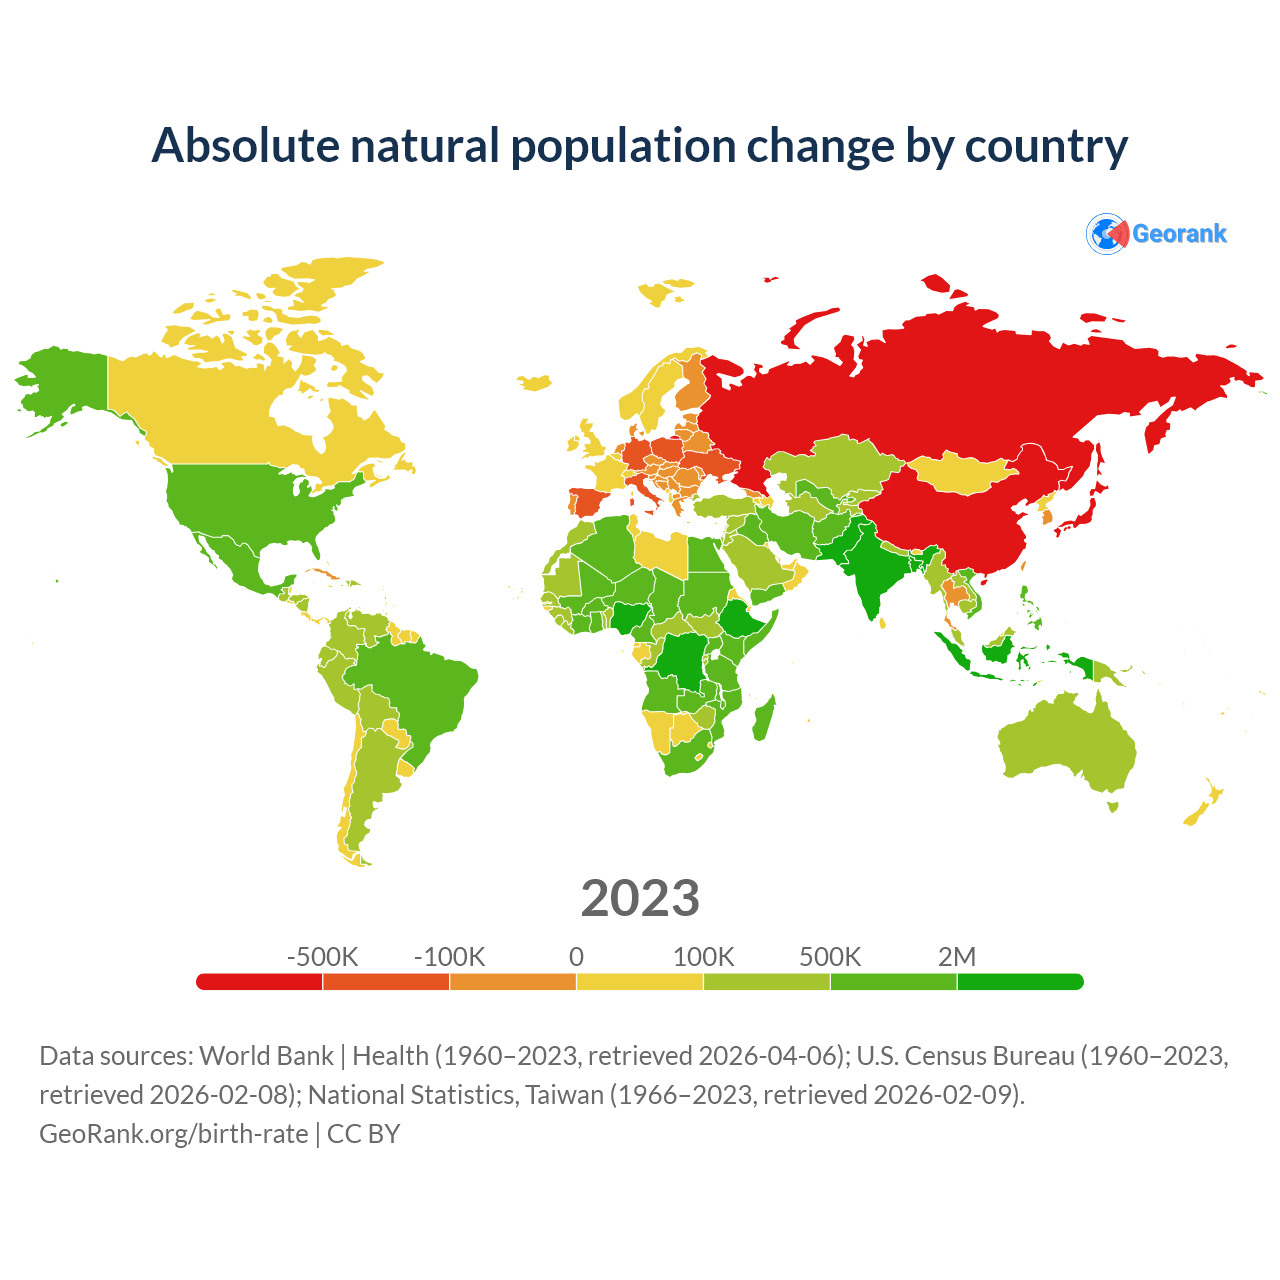
Data sources: World Bank | Health (1960–2024, retrieved 2026-07-08); U.S. Census Bureau (1960–2024, retrieved 2026-07-08); National Statistics, Taiwan (1966–2024, retrieved 2026-07-08).
GeoRank.org/birth-rate | CC BY
This map shows absolute natural population gain or loss by country for each year from 1960 to 2024, excluding migration.
Natural population change rate by country
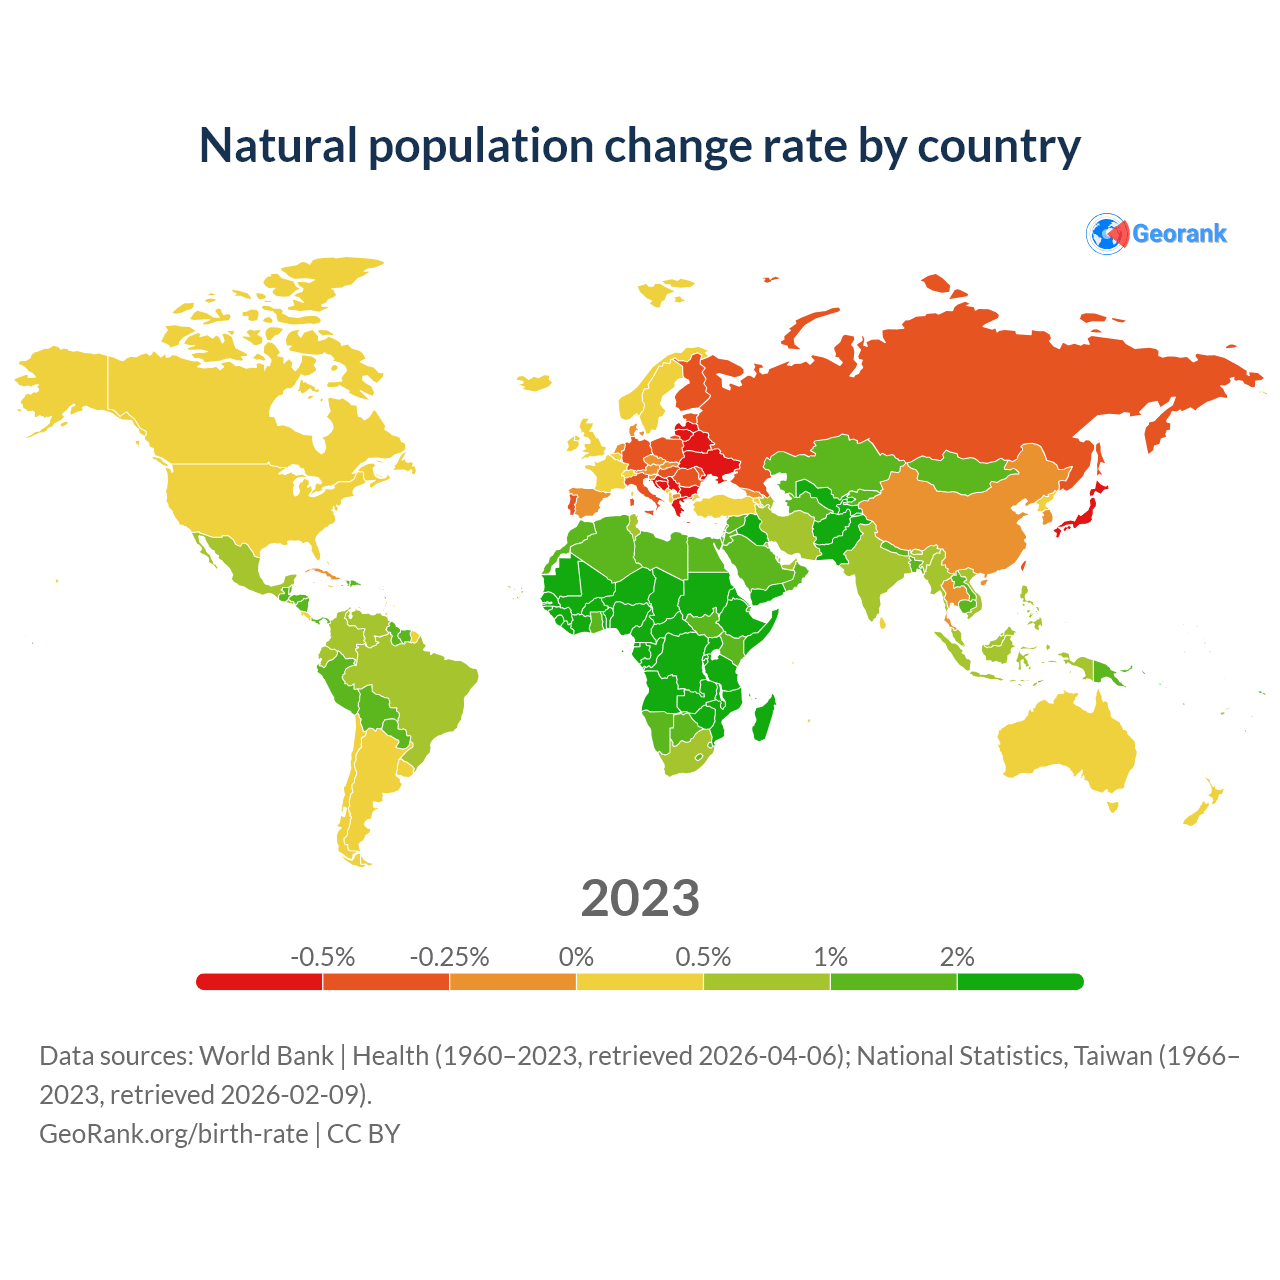
Data sources: World Bank | Health (1960–2024, retrieved 2026-07-08); National Statistics, Taiwan (1966–2024, retrieved 2026-07-08).
GeoRank.org/birth-rate | CC BY
This map shows natural population change rate by country for each year from 1960 to 2024, excluding migration.
Compare countries by 7 more topics
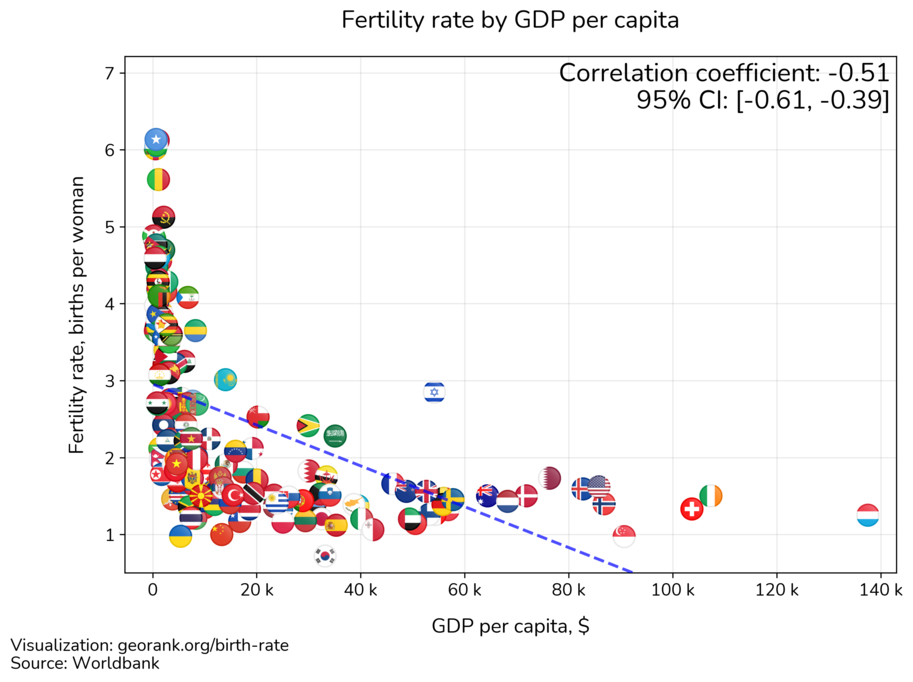
Fertility rate correlations
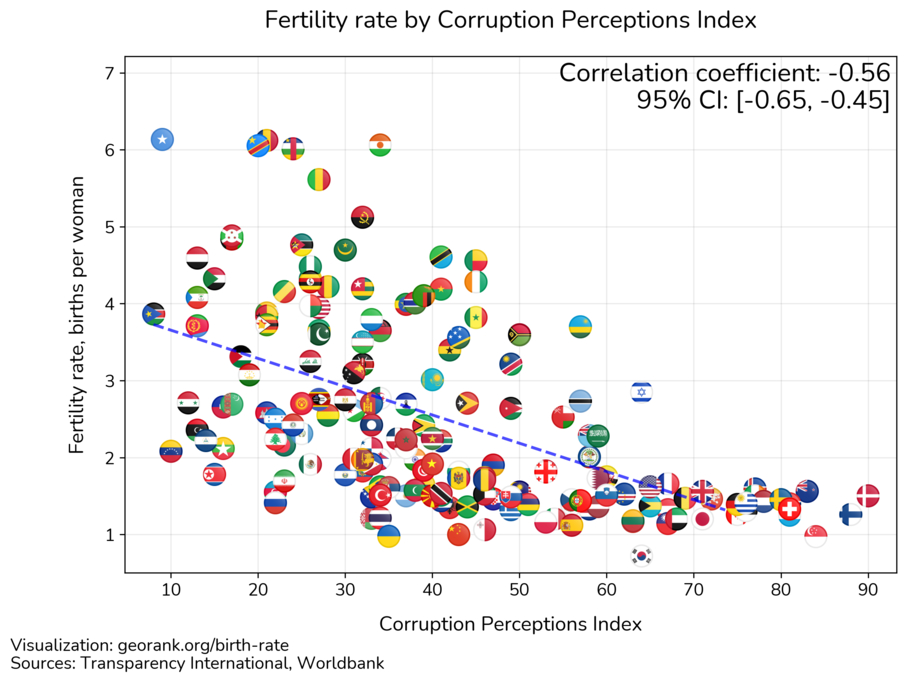
With a reminder that correlation does not imply causation, there are some birth rate related correlations. The closer the correlation coefficient is to +/-1, the stronger the correlation is.
Fertility rate and GDP per capita.
Correlation coefficient: -0.5 (95% Confidence Internal [CI] -0.61 to -0.38).
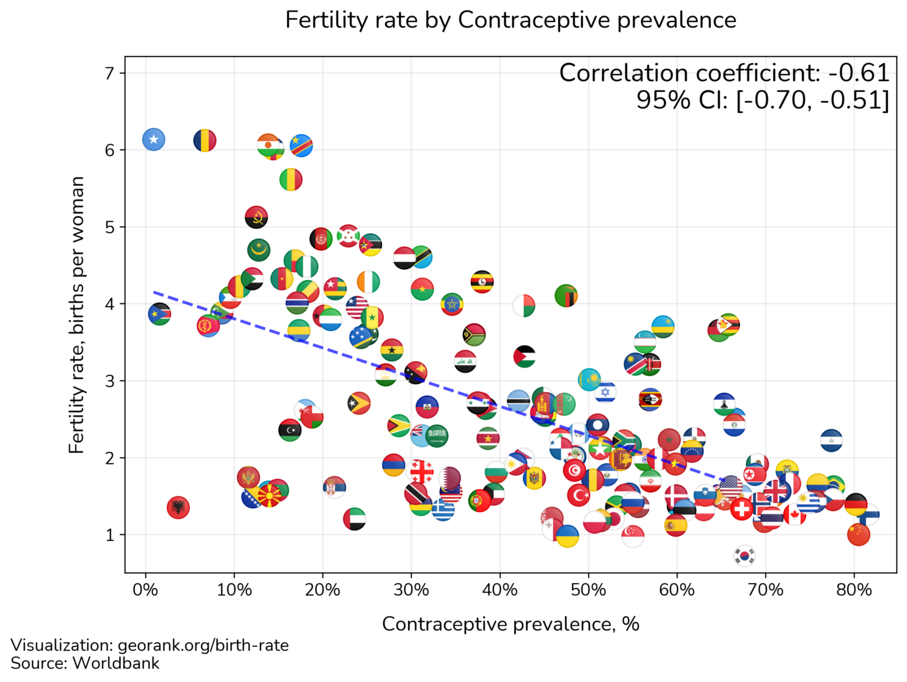
Fertility rate and Modern Contraceptive prevalence.
Correlation coefficient: -0.61 (95% [CI] -0.7 to -0.51).
Fertility rate and Corruption Perception Index (index higher — corruption lower).
Correlation coefficient: -0.57 (95% [CI] -0.66 to -0.46).
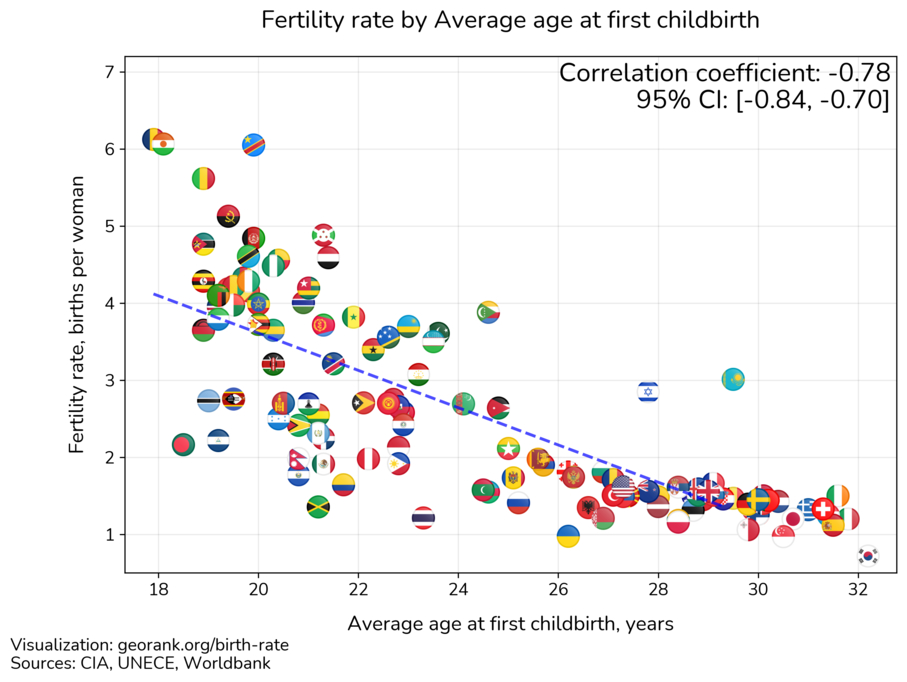
Fertility rate and average age at first childbirth.
Correlation coefficient: -0.76 (95% [CI] -0.83 to -0.68).
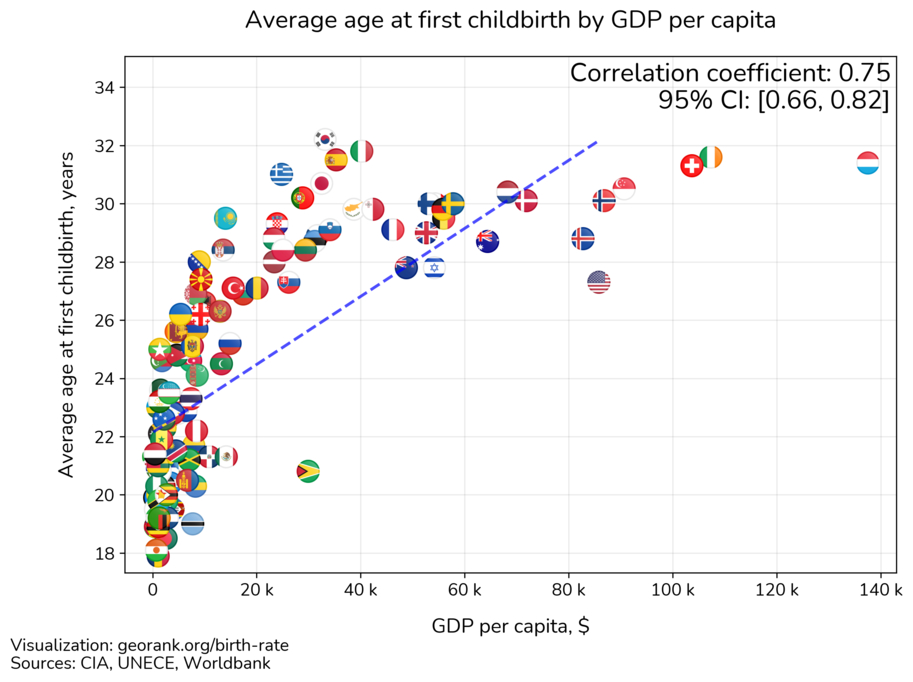
GDP per capita and average age at first childbirth.
Correlation coefficient: 0.75 (95% [CI] 0.66 to 0.82).
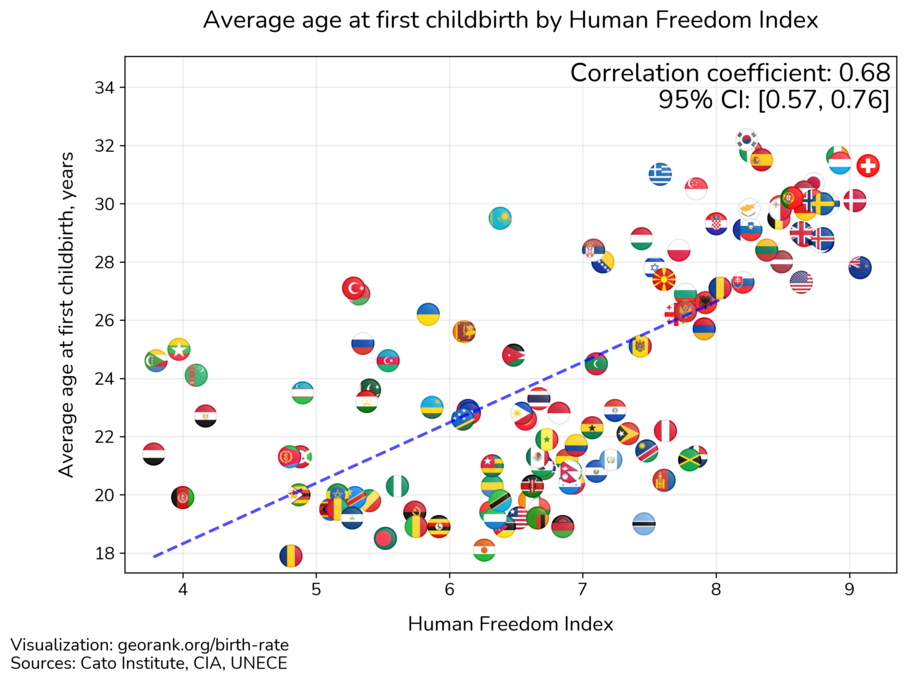
Human Freedom Index and average age at first childbirth.
Correlation coefficient: 0.68 (95% [CI] 0.57 to 0.76).
Women of reproductive age as share of population
| Year | Female 15-49, % | ||||||
|---|---|---|---|---|---|---|---|
| World | Asia | Africa | Europe | Latin America | North America | Oceania | |
| 2100 | 20.5% | 17.2% | 23.1% | 18% | 17.8% | 19.3% | 20.1% |
| 2099 | 20.5% | 17.2% | 23.1% | 18% | 17.8% | 19.3% | 20.1% |
| 2098 | 20.6% | 17.3% | 23.2% | 18.1% | 17.8% | 19.4% | 20.1% |
| 2097 | 20.6% | 17.3% | 23.3% | 18.1% | 17.9% | 19.4% | 20.2% |
| 2096 | 20.6% | 17.4% | 23.3% | 18.2% | 17.9% | 19.4% | 20.2% |
| 2095 | 20.7% | 17.5% | 23.4% | 18.2% | 18% | 19.5% | 20.2% |
| 2094 | 20.7% | 17.5% | 23.5% | 18.2% | 18% | 19.5% | 20.3% |
| 2093 | 20.7% | 17.6% | 23.5% | 18.3% | 18% | 19.5% | 20.3% |
| 2092 | 20.8% | 17.6% | 23.6% | 18.3% | 18.1% | 19.5% | 20.4% |
| 2091 | 20.8% | 17.7% | 23.7% | 18.4% | 18.1% | 19.6% | 20.4% |
| 2090 | 20.8% | 17.7% | 23.8% | 18.4% | 18.2% | 19.6% | 20.4% |
| 2089 | 20.9% | 17.7% | 23.8% | 18.4% | 18.2% | 19.6% | 20.5% |
| 2088 | 20.9% | 17.8% | 23.9% | 18.4% | 18.3% | 19.7% | 20.5% |
| 2087 | 20.9% | 17.8% | 24% | 18.4% | 18.3% | 19.7% | 20.5% |
| 2086 | 21% | 17.9% | 24% | 18.4% | 18.4% | 19.7% | 20.5% |
| 2085 | 21% | 17.9% | 24.1% | 18.5% | 18.4% | 19.7% | 20.6% |
| 2084 | 21% | 17.9% | 24.2% | 18.5% | 18.5% | 19.7% | 20.6% |
| 2083 | 21.1% | 18% | 24.2% | 18.5% | 18.5% | 19.8% | 20.6% |
| 2082 | 21.1% | 18% | 24.3% | 18.5% | 18.6% | 19.8% | 20.6% |
| 2081 | 21.1% | 18% | 24.4% | 18.5% | 18.6% | 19.8% | 20.6% |
| 2080 | 21.1% | 18.1% | 24.4% | 18.4% | 18.7% | 19.8% | 20.7% |
| 2079 | 21.2% | 18.1% | 24.5% | 18.4% | 18.8% | 19.8% | 20.7% |
| 2078 | 21.2% | 18.1% | 24.6% | 18.4% | 18.8% | 19.8% | 20.7% |
| 2077 | 21.2% | 18.2% | 24.6% | 18.4% | 18.9% | 19.9% | 20.8% |
| 2076 | 21.2% | 18.2% | 24.7% | 18.5% | 19% | 19.9% | 20.8% |
| 2075 | 21.3% | 18.3% | 24.8% | 18.5% | 19% | 19.9% | 20.8% |
| 2074 | 21.3% | 18.3% | 24.8% | 18.5% | 19.1% | 19.9% | 20.9% |
| 2073 | 21.3% | 18.4% | 24.9% | 18.5% | 19.2% | 20% | 20.9% |
| 2072 | 21.3% | 18.4% | 25% | 18.5% | 19.2% | 20% | 21% |
| 2071 | 21.4% | 18.5% | 25% | 18.5% | 19.3% | 20% | 21% |
| 2070 | 21.4% | 18.6% | 25.1% | 18.5% | 19.4% | 20% | 21% |
| 2069 | 21.5% | 18.7% | 25.1% | 18.6% | 19.5% | 20.1% | 21.1% |
| 2068 | 21.5% | 18.8% | 25.2% | 18.6% | 19.6% | 20.1% | 21.1% |
| 2067 | 21.6% | 19% | 25.3% | 18.7% | 19.8% | 20.2% | 21.1% |
| 2066 | 21.7% | 19.1% | 25.3% | 18.7% | 19.9% | 20.2% | 21.2% |
| 2065 | 21.7% | 19.3% | 25.4% | 18.8% | 20% | 20.3% | 21.2% |
| 2064 | 21.8% | 19.4% | 25.4% | 18.9% | 20.2% | 20.3% | 21.3% |
| 2063 | 21.9% | 19.6% | 25.5% | 18.9% | 20.3% | 20.4% | 21.3% |
| 2062 | 22% | 19.7% | 25.5% | 19% | 20.4% | 20.5% | 21.4% |
| 2061 | 22% | 19.9% | 25.6% | 19% | 20.6% | 20.5% | 21.4% |
| 2060 | 22.1% | 20% | 25.6% | 19.1% | 20.7% | 20.6% | 21.5% |
| 2059 | 22.2% | 20.1% | 25.7% | 19.1% | 20.9% | 20.6% | 21.5% |
| 2058 | 22.2% | 20.3% | 25.7% | 19.2% | 21% | 20.7% | 21.5% |
| 2057 | 22.3% | 20.4% | 25.7% | 19.2% | 21.1% | 20.8% | 21.6% |
| 2056 | 22.3% | 20.5% | 25.7% | 19.2% | 21.3% | 20.9% | 21.6% |
| 2055 | 22.4% | 20.6% | 25.8% | 19.2% | 21.4% | 20.9% | 21.6% |
| 2054 | 22.4% | 20.7% | 25.8% | 19.2% | 21.6% | 21% | 21.7% |
| 2053 | 22.5% | 20.8% | 25.8% | 19.2% | 21.7% | 21% | 21.7% |
| 2052 | 22.5% | 20.9% | 25.7% | 19.2% | 21.9% | 21% | 21.7% |
| 2051 | 22.6% | 21.1% | 25.7% | 19.2% | 22.1% | 21% | 21.7% |
| 2050 | 22.6% | 21.2% | 25.7% | 19.2% | 22.2% | 21.1% | 21.7% |
| 2049 | 22.7% | 21.3% | 25.7% | 19.2% | 22.4% | 21.1% | 21.7% |
| 2048 | 22.7% | 21.5% | 25.6% | 19.2% | 22.6% | 21.1% | 21.7% |
| 2047 | 22.8% | 21.6% | 25.6% | 19.2% | 22.8% | 21.1% | 21.8% |
| 2046 | 22.8% | 21.8% | 25.6% | 19.3% | 22.9% | 21.2% | 21.8% |
| 2045 | 22.9% | 21.9% | 25.6% | 19.3% | 23.1% | 21.2% | 21.9% |
| 2044 | 23% | 22.1% | 25.5% | 19.4% | 23.3% | 21.2% | 22% |
| 2043 | 23.1% | 22.3% | 25.5% | 19.4% | 23.5% | 21.3% | 22% |
| 2042 | 23.2% | 22.5% | 25.4% | 19.6% | 23.7% | 21.4% | 22.1% |
| 2041 | 23.3% | 22.7% | 25.4% | 19.7% | 23.9% | 21.5% | 22.2% |
| 2040 | 23.4% | 22.9% | 25.4% | 19.8% | 24.1% | 21.6% | 22.3% |
| 2039 | 23.5% | 23.1% | 25.3% | 20% | 24.3% | 21.7% | 22.4% |
| 2038 | 23.7% | 23.4% | 25.3% | 20.2% | 24.5% | 21.8% | 22.5% |
| 2037 | 23.8% | 23.6% | 25.2% | 20.4% | 24.7% | 21.9% | 22.6% |
| 2036 | 23.9% | 23.8% | 25.2% | 20.5% | 24.8% | 22% | 22.7% |
| 2035 | 24% | 24% | 25.1% | 20.7% | 25% | 22.2% | 22.8% |
| 2034 | 24.1% | 24.1% | 25.1% | 20.8% | 25.2% | 22.2% | 22.9% |
| 2033 | 24.2% | 24.3% | 25% | 20.9% | 25.3% | 22.3% | 23% |
| 2032 | 24.2% | 24.4% | 25% | 21% | 25.5% | 22.4% | 23.1% |
| 2031 | 24.3% | 24.4% | 24.9% | 21.1% | 25.6% | 22.5% | 23.1% |
| 2030 | 24.3% | 24.5% | 24.8% | 21.2% | 25.7% | 22.6% | 23.2% |
| 2029 | 24.3% | 24.5% | 24.7% | 21.3% | 25.8% | 22.6% | 23.2% |
| 2028 | 24.3% | 24.5% | 24.6% | 21.3% | 25.9% | 22.6% | 23.3% |
| 2027 | 24.3% | 24.5% | 24.6% | 21.4% | 26% | 22.7% | 23.3% |
| 2026 | 24.3% | 24.6% | 24.5% | 21.5% | 26.1% | 22.7% | 23.3% |
| 2025 | 24.4% | 24.6% | 24.7% | 21.5% | 26.2% | 22.5% | 23.8% |
| 2024 | 24.4% | 24.7% | 24.6% | 21.6% | 26.3% | 22.5% | 23.9% |
| 2023 | 24.4% | 24.7% | 24.5% | 21.7% | 26.4% | 22.5% | 23.9% |
| 2022 | 24.5% | 24.8% | 24.4% | 21.8% | 26.5% | 22.5% | 23.9% |
| 2021 | 24.5% | 24.9% | 24.3% | 21.9% | 26.5% | 22.5% | 24% |
| 2020 | 24.6% | 25% | 24.2% | 22% | 26.5% | 22.5% | 24.2% |
| 2019 | 24.7% | 25.1% | 24.1% | 22.2% | 26.6% | 22.6% | 24.3% |
| 2018 | 24.8% | 25.3% | 24% | 22.4% | 26.7% | 22.6% | 24.4% |
| 2017 | 24.9% | 25.4% | 24% | 22.5% | 26.7% | 22.6% | 24.4% |
| 2016 | 25% | 25.6% | 23.9% | 22.7% | 26.8% | 22.7% | 24.4% |
| 2015 | 25.1% | 25.7% | 23.9% | 23% | 26.8% | 22.8% | 24.5% |
| 2014 | 25.2% | 25.9% | 23.9% | 23.2% | 26.8% | 23% | 24.5% |
| 2013 | 25.4% | 26% | 23.9% | 23.5% | 26.9% | 23.1% | 24.6% |
| 2012 | 25.5% | 26.2% | 23.9% | 23.7% | 26.9% | 23.3% | 24.7% |
| 2011 | 25.6% | 26.3% | 23.9% | 24% | 26.9% | 23.5% | 24.7% |
| 2010 | 25.7% | 26.3% | 23.9% | 24.3% | 27% | 23.7% | 24.8% |
| 2009 | 25.7% | 26.3% | 23.9% | 24.5% | 27% | 23.9% | 24.9% |
| 2008 | 25.8% | 26.3% | 23.9% | 24.7% | 26.9% | 24.1% | 25% |
| 2007 | 25.8% | 26.3% | 23.8% | 24.9% | 26.9% | 24.3% | 25% |
| 2006 | 25.9% | 26.3% | 23.8% | 25.1% | 26.9% | 24.5% | 25% |
| 2005 | 25.9% | 26.3% | 23.8% | 25.2% | 26.9% | 24.7% | 25.1% |
| 2004 | 25.9% | 26.2% | 23.8% | 25.2% | 26.8% | 24.8% | 25.1% |
| 2003 | 25.8% | 26.1% | 23.7% | 25.3% | 26.8% | 25% | 25.2% |
| 2002 | 25.8% | 26% | 23.7% | 25.3% | 26.7% | 25.1% | 25.2% |
| 2001 | 25.7% | 26% | 23.6% | 25.3% | 26.6% | 25.2% | 25.2% |
| 2000 | 25.7% | 25.9% | 23.5% | 25.3% | 26.6% | 25.4% | 25.3% |
| 1999 | 25.6% | 25.8% | 23.4% | 25.3% | 26.5% | 25.5% | 25.3% |
| 1998 | 25.6% | 25.6% | 23.3% | 25.3% | 26.4% | 25.6% | 25.4% |
| 1997 | 25.5% | 25.5% | 23.3% | 25.3% | 26.3% | 25.7% | 25.5% |
| 1996 | 25.4% | 25.3% | 23.2% | 25.3% | 26.1% | 25.9% | 25.5% |
| 1995 | 25.3% | 25.2% | 23.1% | 25.2% | 26% | 25.9% | 25.5% |
| 1994 | 25.2% | 25.1% | 23% | 25.1% | 25.9% | 26% | 25.5% |
| 1993 | 25.1% | 25% | 22.9% | 24.9% | 25.7% | 26% | 25.5% |
| 1992 | 25% | 24.9% | 22.8% | 24.8% | 25.6% | 26.1% | 25.5% |
| 1991 | 24.9% | 24.8% | 22.7% | 24.8% | 25.5% | 26.2% | 25.5% |
| 1990 | 24.9% | 24.8% | 22.7% | 24.7% | 25.3% | 26.3% | 25.5% |
| 1989 | 24.8% | 24.7% | 22.6% | 24.8% | 25.2% | 26.4% | 25.4% |
| 1988 | 24.8% | 24.6% | 22.6% | 24.8% | 25% | 26.4% | 25.3% |
| 1987 | 24.7% | 24.5% | 22.5% | 24.9% | 24.9% | 26.5% | 25.2% |
| 1986 | 24.6% | 24.3% | 22.5% | 24.9% | 24.7% | 26.5% | 25% |
| 1985 | 24.5% | 24.2% | 22.5% | 24.9% | 24.6% | 26.4% | 24.9% |
| 1984 | 24.4% | 24% | 22.5% | 24.9% | 24.5% | 26.3% | 24.7% |
| 1983 | 24.3% | 23.9% | 22.5% | 24.8% | 24.3% | 26.3% | 24.6% |
| 1982 | 24.1% | 23.7% | 22.4% | 24.8% | 24.2% | 26.2% | 24.4% |
| 1981 | 24% | 23.6% | 22.4% | 24.8% | 24.1% | 26.2% | 24.3% |
| 1980 | 23.9% | 23.4% | 22.5% | 24.8% | 23.9% | 26.1% | 24.2% |
| 1979 | 23.8% | 23.2% | 22.5% | 24.8% | 23.8% | 26% | 24% |
| 1978 | 23.6% | 23% | 22.5% | 24.8% | 23.7% | 25.8% | 23.9% |
| 1977 | 23.5% | 22.8% | 22.5% | 24.8% | 23.6% | 25.6% | 23.8% |
| 1976 | 23.4% | 22.7% | 22.5% | 24.9% | 23.5% | 25.4% | 23.6% |
| 1975 | 23.4% | 22.6% | 22.5% | 24.9% | 23.3% | 25.2% | 23.5% |
| 1974 | 23.4% | 22.6% | 22.6% | 24.9% | 23.2% | 25% | 23.5% |
| 1973 | 23.4% | 22.6% | 22.6% | 24.9% | 23.1% | 24.7% | 23.4% |
| 1972 | 23.3% | 22.5% | 22.6% | 24.9% | 23% | 24.5% | 23.4% |
| 1971 | 23.3% | 22.5% | 22.7% | 24.9% | 22.9% | 24.3% | 23.4% |
| 1970 | 23.2% | 22.4% | 22.7% | 24.9% | 22.9% | 24.1% | 23.3% |
| 1969 | 23.2% | 22.4% | 22.8% | 24.9% | 22.8% | 23.9% | 23.3% |
| 1968 | 23.1% | 22.3% | 22.8% | 24.8% | 22.7% | 23.8% | 23.2% |
| 1967 | 23% | 22.3% | 22.9% | 24.6% | 22.6% | 23.6% | 23.2% |
| 1966 | 23% | 22.2% | 22.9% | 24.5% | 22.6% | 23.5% | 23.1% |
| 1965 | 23% | 22.2% | 23% | 24.4% | 22.5% | 23.3% | 23.1% |
| 1964 | 23% | 22.3% | 23% | 24.5% | 22.5% | 23.3% | 23% |
| 1963 | 23.1% | 22.4% | 23.1% | 24.6% | 22.5% | 23.2% | 23% |
| 1962 | 23.2% | 22.6% | 23.1% | 24.8% | 22.6% | 23.2% | 23% |
| 1961 | 23.3% | 22.6% | 23.2% | 24.9% | 22.6% | 23.2% | 23% |
| 1960 | 23.4% | 22.7% | 23.2% | 25.2% | 22.7% | 23.3% | 23% |
Data sources: United Nations | World Population Prospects (2026–2100, retrieved 2026-07-08); World Bank | Health (1960–2025, retrieved 2026-07-08); National Statistics, Taiwan (1960–2025, retrieved 2026-07-08).
GeoRank.org/birth-rate | CC BY
The share of women ages 15-49 globally was 23.4% in 1960, 24.9% in 1990, and 24.4% as of the latest data in 2025.
More about the demographics of the World.
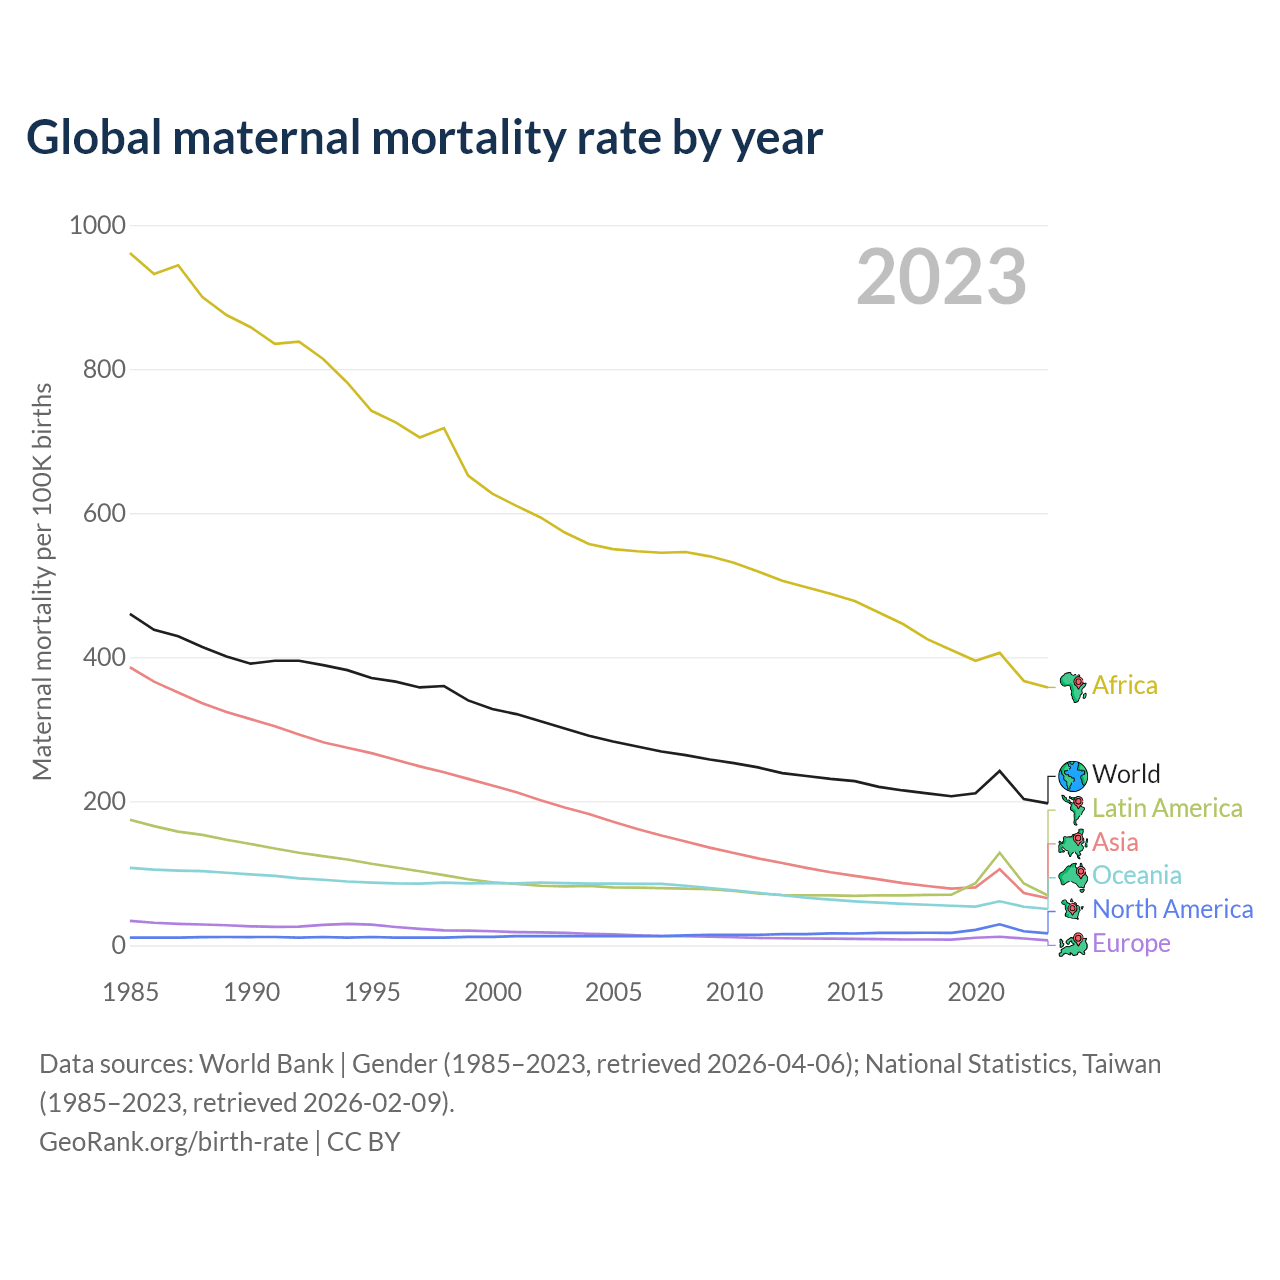
Global maternal mortality rate by year
| Year | Maternal mortality per 100K births | ||||||
|---|---|---|---|---|---|---|---|
| World | Asia | Africa | Europe | Latin America | North America | Oceania | |
| 2023 | 197 | 65.6 | 359 | 6.88 | 69.1 | 16.5 | 50.5 |
| 2022 | 203 | 72.9 | 368 | 9.49 | 85.8 | 19.5 | 53.8 |
| 2021 | 242 | 106.1 | 407 | 11.9 | 128.5 | 29.2 | 61.4 |
| 2020 | 211 | 80.9 | 395 | 10.5 | 86.4 | 21.5 | 54 |
| 2019 | 207 | 79 | 410 | 7.94 | 70.2 | 17.4 | 55.1 |
| 2018 | 211 | 82.7 | 425 | 8.1 | 70.1 | 17.5 | 56.5 |
| 2017 | 215 | 86.7 | 447 | 8.13 | 69.5 | 17.4 | 57.7 |
| 2016 | 220 | 91.9 | 463 | 8.64 | 69.6 | 17.4 | 59.4 |
| 2015 | 228 | 96.9 | 479 | 9.03 | 68.6 | 16.4 | 61.1 |
| 2014 | 231 | 101.8 | 489 | 9.33 | 69.5 | 16.5 | 63.6 |
| 2013 | 235 | 108 | 498 | 9.43 | 69.5 | 15.5 | 66.3 |
| 2012 | 239 | 114.6 | 507 | 9.85 | 70 | 15.5 | 69.7 |
| 2011 | 247 | 121.1 | 520 | 10.2 | 72.1 | 14.6 | 73 |
| 2010 | 253 | 128.7 | 532 | 11.2 | 75.6 | 14.6 | 76.7 |
| 2009 | 258 | 136.2 | 541 | 11.9 | 78.1 | 14.7 | 79.8 |
| 2008 | 264 | 144.7 | 547 | 12.6 | 78.8 | 13.8 | 82.9 |
| 2007 | 269 | 152.9 | 546 | 12.9 | 79.6 | 12.8 | 85.6 |
| 2006 | 276 | 162.1 | 548 | 13.8 | 80.3 | 12.8 | 85.4 |
| 2005 | 283 | 172.1 | 551 | 15.3 | 80.6 | 12.8 | 85.8 |
| 2004 | 291 | 183 | 558 | 16.1 | 82.6 | 12.7 | 86 |
| 2003 | 301 | 192 | 574 | 17.2 | 82 | 12.7 | 86.5 |
| 2002 | 311 | 202.2 | 595 | 17.9 | 82.8 | 12.7 | 87.4 |
| 2001 | 321 | 213.4 | 611 | 18.4 | 85.4 | 12.7 | 86.3 |
| 2000 | 328 | 222.7 | 628 | 19.5 | 87.5 | 11.7 | 86.6 |
| 1999 | 340 | 232 | 654 | 20.4 | 91.9 | 11.7 | 86.3 |
| 1998 | 360 | 241.1 | 719 | 20.8 | 97.5 | 10.8 | 87.3 |
| 1997 | 358 | 249.3 | 706 | 22.8 | 103 | 10.7 | 85.9 |
| 1996 | 366 | 258.5 | 727 | 25.5 | 108.1 | 10.8 | 86.1 |
| 1995 | 371 | 267.7 | 743 | 28.7 | 113.4 | 11.6 | 87.3 |
| 1994 | 382 | 275.3 | 782 | 29.8 | 119.3 | 10.7 | 88.8 |
| 1993 | 389 | 282.8 | 815 | 28.3 | 123.9 | 11.6 | 91.2 |
| 1992 | 395 | 293.5 | 839 | 26 | 128.7 | 10.7 | 93.1 |
| 1991 | 395 | 305 | 837 | 25.7 | 134.7 | 11.6 | 96.7 |
| 1990 | 391 | 315 | 859 | 26.4 | 140.9 | 11.5 | 98.6 |
| 1989 | 401 | 325 | 876 | 27.9 | 146.8 | 11.6 | 100.9 |
| 1988 | 414 | 337 | 901 | 28.9 | 153.5 | 11.5 | 103.1 |
| 1987 | 429 | 352 | 945 | 29.7 | 158 | 10.6 | 104 |
| 1986 | 438 | 367 | 933 | 31.3 | 165.7 | 10.6 | 105.5 |
| 1985 | 460 | 387 | 962 | 33.9 | 174.4 | 10.6 | 107.7 |
Data sources: World Bank | Gender (1985–2023, retrieved 2026-07-08); National Statistics, Taiwan (1985–2023, retrieved 2026-07-08).
GeoRank.org/birth-rate | CC BY
The world maternal mortality rate was 197 deaths per 100,000 live births in 2023 — a 0.2% chance of dying during childbirth or within 42 days of pregnancy termination. This is a -39.9% decrease compared to the year 2000.
There are significant regional differences in maternal mortality. In Africa, the risk of dying during childbirth is 52 times higher than in Europe, 22 times higher than in North America, and 5 times higher than in Asia or Latin America.
World under-five mortality rate by year
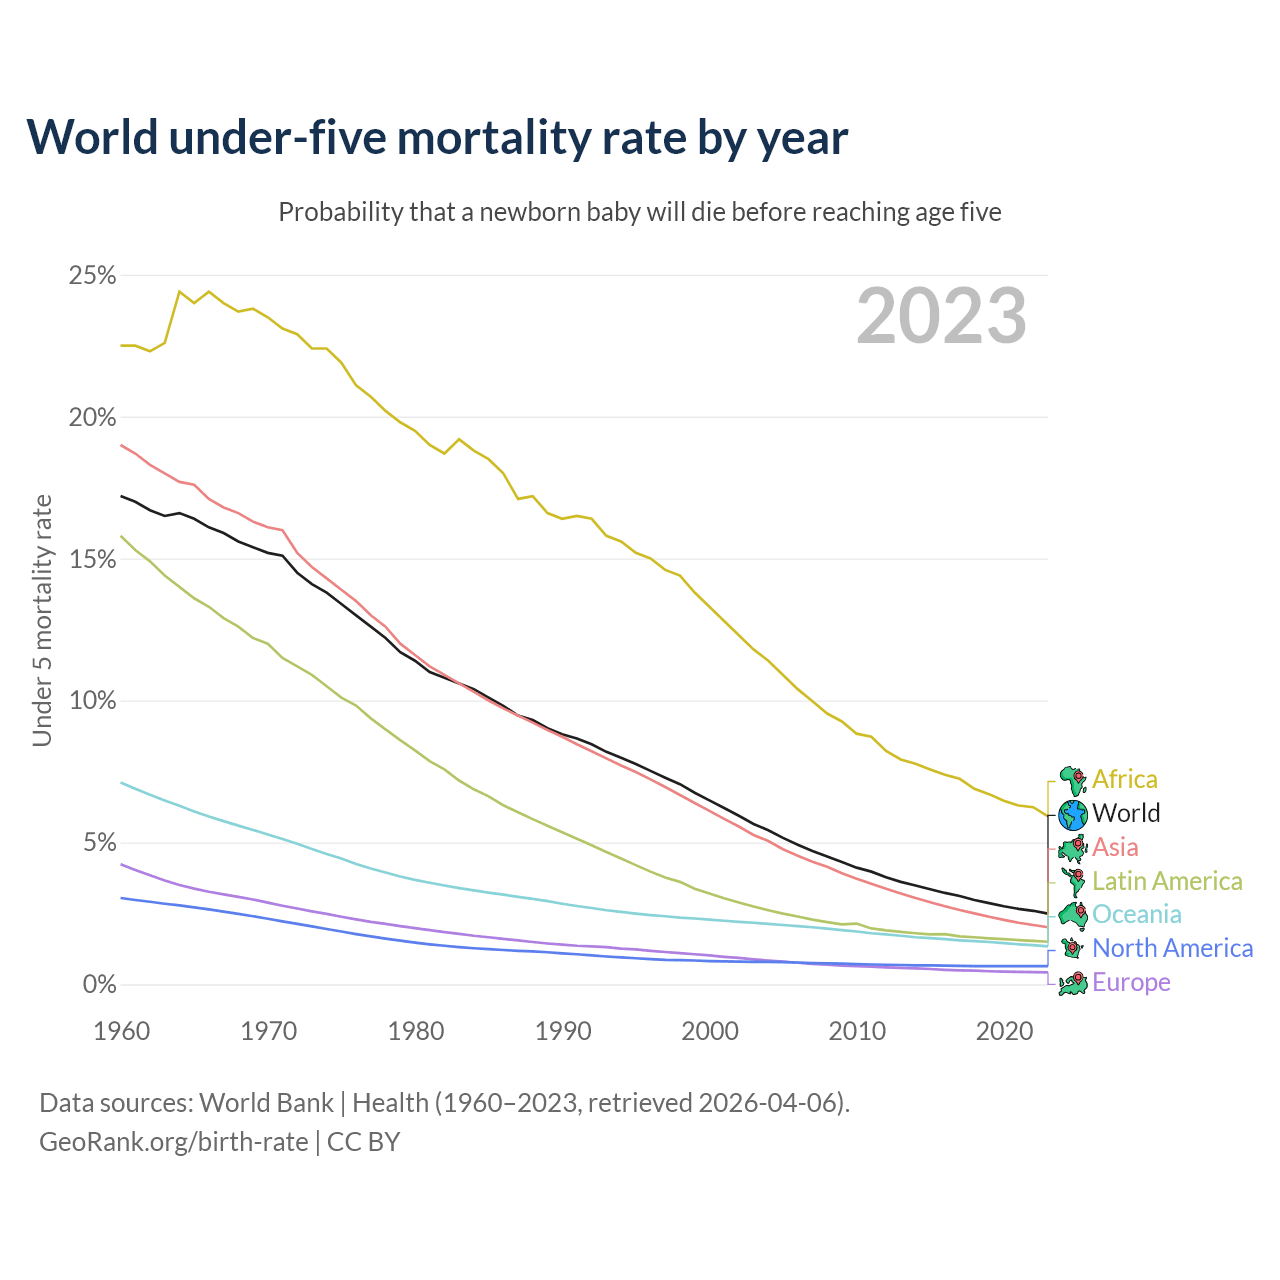
Probability that a newborn baby will die before reaching age five
| Year | Under 5 mortality rate | ||||||
|---|---|---|---|---|---|---|---|
| World | Asia | Africa | Europe | Latin America | North America | Oceania | |
| 2024 | 2.49% | 1.91% | 6.19% | 0.44% | 1.46% | 0.64% | 1.32% |
| 2023 | 2.58% | 2% | 6.38% | 0.44% | 1.49% | 0.64% | 1.36% |
| 2022 | 2.7% | 2.08% | 6.74% | 0.45% | 1.52% | 0.64% | 1.39% |
| 2021 | 2.75% | 2.17% | 6.71% | 0.45% | 1.55% | 0.64% | 1.42% |
| 2020 | 2.79% | 2.27% | 6.61% | 0.45% | 1.58% | 0.64% | 1.46% |
| 2019 | 2.89% | 2.38% | 6.76% | 0.46% | 1.61% | 0.64% | 1.5% |
| 2018 | 2.98% | 2.5% | 6.87% | 0.48% | 1.65% | 0.64% | 1.53% |
| 2017 | 3.11% | 2.62% | 7.15% | 0.49% | 1.68% | 0.65% | 1.56% |
| 2016 | 3.21% | 2.75% | 7.22% | 0.51% | 1.76% | 0.66% | 1.59% |
| 2015 | 3.32% | 2.89% | 7.36% | 0.54% | 1.74% | 0.66% | 1.76% |
| 2014 | 3.44% | 3.04% | 7.52% | 0.56% | 1.79% | 0.67% | 1.68% |
| 2013 | 3.56% | 3.2% | 7.64% | 0.58% | 1.84% | 0.68% | 1.72% |
| 2012 | 3.72% | 3.36% | 7.93% | 0.6% | 1.89% | 0.69% | 1.76% |
| 2011 | 3.92% | 3.53% | 8.43% | 0.62% | 1.95% | 0.7% | 1.81% |
| 2010 | 4.06% | 3.71% | 8.52% | 0.64% | 2.12% | 0.71% | 1.87% |
| 2009 | 4.26% | 3.91% | 8.95% | 0.66% | 2.09% | 0.73% | 1.92% |
| 2008 | 4.45% | 4.14% | 9.21% | 0.69% | 2.17% | 0.74% | 1.97% |
| 2007 | 4.65% | 4.31% | 9.64% | 0.72% | 2.26% | 0.75% | 2.01% |
| 2006 | 4.87% | 4.53% | 10.1% | 0.75% | 2.36% | 0.77% | 2.06% |
| 2005 | 5.12% | 4.76% | 10.6% | 0.8% | 2.47% | 0.78% | 2.1% |
| 2004 | 5.44% | 5.05% | 11.3% | 0.84% | 2.59% | 0.79% | 2.14% |
| 2003 | 5.67% | 5.26% | 11.8% | 0.88% | 2.72% | 0.79% | 2.17% |
| 2002 | 5.96% | 5.56% | 12.3% | 0.93% | 2.86% | 0.8% | 2.21% |
| 2001 | 6.26% | 5.84% | 13% | 0.97% | 3.01% | 0.81% | 2.25% |
| 2000 | 6.52% | 6.12% | 13.4% | 1.02% | 3.17% | 0.82% | 2.28% |
| 1999 | 6.8% | 6.4% | 13.9% | 1.06% | 3.35% | 0.84% | 2.32% |
| 1998 | 7.13% | 6.69% | 14.6% | 1.1% | 3.59% | 0.85% | 2.36% |
| 1997 | 7.34% | 6.96% | 14.8% | 1.14% | 3.74% | 0.86% | 2.63% |
| 1996 | 7.6% | 7.23% | 15.2% | 1.18% | 3.95% | 0.89% | 2.45% |
| 1995 | 7.77% | 7.5% | 15.2% | 1.22% | 4.17% | 0.92% | 2.5% |
| 1994 | 8% | 7.72% | 15.6% | 1.26% | 4.41% | 0.95% | 2.55% |
| 1993 | 8.26% | 7.98% | 16% | 1.31% | 4.64% | 0.98% | 2.62% |
| 1992 | 8.47% | 8.23% | 16.2% | 1.34% | 4.88% | 1.02% | 2.69% |
| 1991 | 8.67% | 8.49% | 16.3% | 1.35% | 5.11% | 1.06% | 2.77% |
| 1990 | 8.84% | 8.75% | 16.3% | 1.39% | 5.34% | 1.09% | 2.86% |
| 1989 | 9.06% | 8.99% | 16.6% | 1.44% | 5.57% | 1.13% | 2.94% |
| 1988 | 9.44% | 9.23% | 17.7% | 1.49% | 5.81% | 1.16% | 3.02% |
| 1987 | 9.51% | 9.5% | 17.1% | 1.55% | 6.05% | 1.18% | 3.1% |
| 1986 | 9.86% | 9.76% | 18% | 1.6% | 6.3% | 1.21% | 3.18% |
| 1985 | 10.2% | 10.1% | 18.5% | 1.65% | 6.61% | 1.24% | 3.25% |
| 1984 | 10.4% | 10.3% | 18.9% | 1.71% | 6.86% | 1.27% | 3.33% |
| 1983 | 10.7% | 10.6% | 19.4% | 1.77% | 7.17% | 1.31% | 3.42% |
| 1982 | 10.9% | 11% | 18.9% | 1.83% | 7.57% | 1.36% | 3.5% |
| 1981 | 11.2% | 11.3% | 19.3% | 1.91% | 7.86% | 1.41% | 3.6% |
| 1980 | 11.5% | 11.7% | 19.7% | 1.98% | 8.25% | 1.47% | 3.71% |
| 1979 | 11.8% | 12.1% | 19.8% | 2.05% | 8.6% | 1.54% | 3.83% |
| 1978 | 12.3% | 12.6% | 20.3% | 2.13% | 8.99% | 1.61% | 3.97% |
| 1977 | 12.6% | 13.1% | 20.7% | 2.2% | 9.37% | 1.69% | 4.11% |
| 1976 | 13.1% | 13.5% | 21.2% | 2.29% | 9.84% | 1.77% | 4.27% |
| 1975 | 13.6% | 14.1% | 22% | 2.38% | 10.2% | 1.86% | 4.46% |
| 1974 | 13.9% | 14.5% | 22.4% | 2.48% | 10.6% | 1.95% | 4.62% |
| 1973 | 14.2% | 14.7% | 22.8% | 2.57% | 10.9% | 2.04% | 4.8% |
| 1972 | 14.6% | 15.2% | 23.3% | 2.67% | 11.3% | 2.13% | 4.98% |
| 1971 | 15.1% | 16.1% | 23.2% | 2.77% | 11.6% | 2.23% | 5.15% |
| 1970 | 15.6% | 16.1% | 25.2% | 2.88% | 12.1% | 2.32% | 5.31% |
| 1969 | 15.8% | 16.3% | 25.6% | 2.99% | 12.2% | 2.4% | 5.47% |
| 1968 | 16% | 16.6% | 25.5% | 3.09% | 12.6% | 2.48% | 5.63% |
| 1967 | 15.9% | 16.9% | 24.2% | 3.17% | 12.9% | 2.56% | 5.78% |
| 1966 | 16.2% | 17.1% | 24.2% | 3.26% | 13.3% | 2.64% | 5.94% |
| 1965 | 16.5% | 17.6% | 24.1% | 3.36% | 13.7% | 2.71% | 6.11% |
| 1964 | 16.6% | 17.7% | 24.4% | 3.5% | 14.1% | 2.78% | 6.31% |
| 1963 | 16.5% | 18% | 22.7% | 3.67% | 14.5% | 2.84% | 6.5% |
| 1962 | 16.7% | 18.4% | 22.4% | 3.85% | 14.9% | 2.91% | 6.7% |
| 1961 | 17% | 18.7% | 22.5% | 4.04% | 15.3% | 2.97% | 6.91% |
| 1960 | 17.3% | 19.1% | 22.6% | 4.24% | 15.8% | 3.04% | 7.13% |
Data sources: World Bank | Health (1960–2024, retrieved 2026-07-08).
GeoRank.org/birth-rate | CC BY
The under-5 mortality rate was 24.9 deaths per 1,000 live births in 2024 — a 2.49% chance that a newborn baby will die before reaching age five. Down from 88.4 deaths per 1,000 live births in 1990.
Help us show the world through your eyes
Share a photo of your city and help others discover what it looks like to live there. Your contribution makes our data come alive.
Data sources:
- World Bank | Health (1960–2025, retrieved 2026-07-08)
- United Nations | World Population Prospects (1960–2100, retrieved 2026-07-08)
- National Statistics, Taiwan (1960–2025, retrieved 2026-07-08)
- Central Intelligence Agency (CIA) (2017–2025, retrieved 2026-07-08)
- U.S. Census Bureau (1960–2025, retrieved 2026-07-08)
- United Nations Economic Commission for Europe (UNECE) (2010–2025, retrieved 2026-07-08)
Creative Commons Attribution (CC BY) — you’re free to copy, share, remix, adapt, and use even commercially as long as you give appropriate credit and clearly indicate if you made changes. Other sources may be subject to different license terms.