Guinea has a birth rate of 33.3 (annual births per 1,000 people) and a fertility rate of 4.13 (the average number of children a woman is expected to have over her lifetime based on current age-specific birth rates).
In 1960, the fertility rate in Guinea was 6.11 children per woman — 1.48 times higher than in 2024.
Guinea birth rate statistics:
- Guinea is ranked 16/196 by birth rate now and was ranked 76/194 in 1960.
- The mean age at first birth in Guinea is 19.9 — it was 18.9 in 2017.
- The mean age at childbearing (for all the births, not just the first) is 28.1, a change from 29.6 in 1990.
- Annual births per 1,000 women ages 15-19 (adolescent birth rate or teenage mother rate) changed from 165.4 in 1960 to 116.8 in 2024.
- 24.7% of the population in 2025 is composed of women of reproductive age (15-49), a change from 23.9% in 1960.
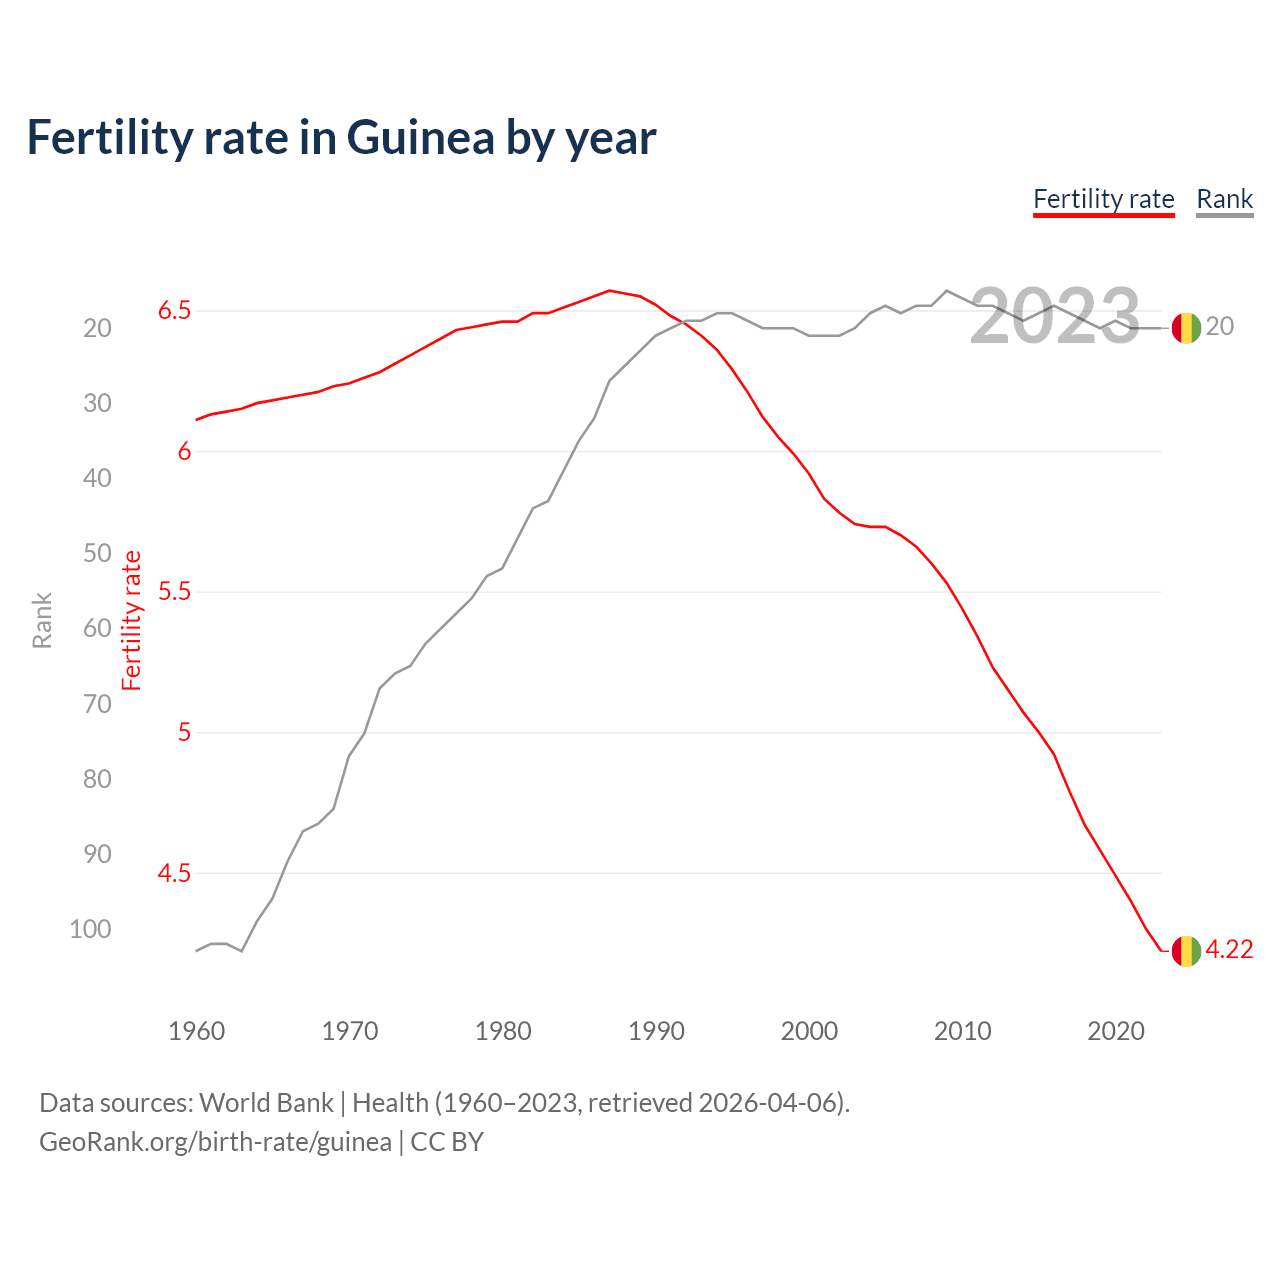
Fertility rate in Guinea by year
| Year | Fertility rate | Rank |
|---|---|---|
| 2024 | 4.13 | 20 |
| 2023 | 4.22 | 20 |
| 2022 | 4.3 | 20 |
| 2021 | 4.4 | 20 |
| 2020 | 4.49 | 19 |
| 2019 | 4.58 | 20 |
| 2018 | 4.67 | 19 |
| 2017 | 4.79 | 18 |
| 2016 | 4.92 | 17 |
| 2015 | 5 | 18 |
| 2014 | 5.07 | 19 |
| 2013 | 5.15 | 18 |
| 2012 | 5.23 | 17 |
| 2011 | 5.34 | 17 |
| 2010 | 5.44 | 16 |
| 2009 | 5.53 | 15 |
| 2008 | 5.6 | 17 |
| 2007 | 5.66 | 17 |
| 2006 | 5.7 | 18 |
| 2005 | 5.73 | 17 |
| 2004 | 5.73 | 18 |
| 2003 | 5.74 | 20 |
| 2002 | 5.78 | 21 |
| 2001 | 5.83 | 21 |
| 2000 | 5.92 | 21 |
| 1999 | 5.99 | 20 |
| 1998 | 6.05 | 20 |
| 1997 | 6.12 | 20 |
| 1996 | 6.21 | 19 |
| 1995 | 6.29 | 18 |
| 1994 | 6.36 | 18 |
| 1993 | 6.41 | 19 |
| 1992 | 6.45 | 19 |
| 1991 | 6.48 | 20 |
| 1990 | 6.52 | 21 |
| 1989 | 6.55 | 23 |
| 1988 | 6.56 | 25 |
| 1987 | 6.57 | 27 |
| 1986 | 6.55 | 32 |
| 1985 | 6.53 | 35 |
| 1984 | 6.51 | 39 |
| 1983 | 6.49 | 43 |
| 1982 | 6.49 | 44 |
| 1981 | 6.46 | 48 |
| 1980 | 6.46 | 52 |
| 1979 | 6.45 | 53 |
| 1978 | 6.44 | 56 |
| 1977 | 6.43 | 58 |
| 1976 | 6.4 | 60 |
| 1975 | 6.37 | 62 |
| 1974 | 6.34 | 65 |
| 1973 | 6.31 | 66 |
| 1972 | 6.28 | 68 |
| 1971 | 6.26 | 74 |
| 1970 | 6.24 | 77 |
| 1969 | 6.23 | 84 |
| 1968 | 6.21 | 86 |
| 1967 | 6.2 | 87 |
| 1966 | 6.19 | 91 |
| 1965 | 6.18 | 96 |
| 1964 | 6.17 | 99 |
| 1963 | 6.15 | 103 |
| 1962 | 6.14 | 102 |
| 1961 | 6.13 | 102 |
| 1960 | 6.11 | 103 |
Data sources: World Bank | Health (1960–2024, retrieved 2026-07-08).
GeoRank.org/birth-rate/guinea | CC BY 
According to the latest birth rate data available, the fertility rate in Guinea is 4.13, which is above the replacement level of 2.1 children per woman. In 1994, the fertility rate was 6.36 — a 35% decline in 30 years.
Check population clock for a dynamic visualization of the changing population.
The chart above shows the historical changes in fertility rate and ranking compared to other countries, where a lower rank number indicates a higher relative fertility rate.
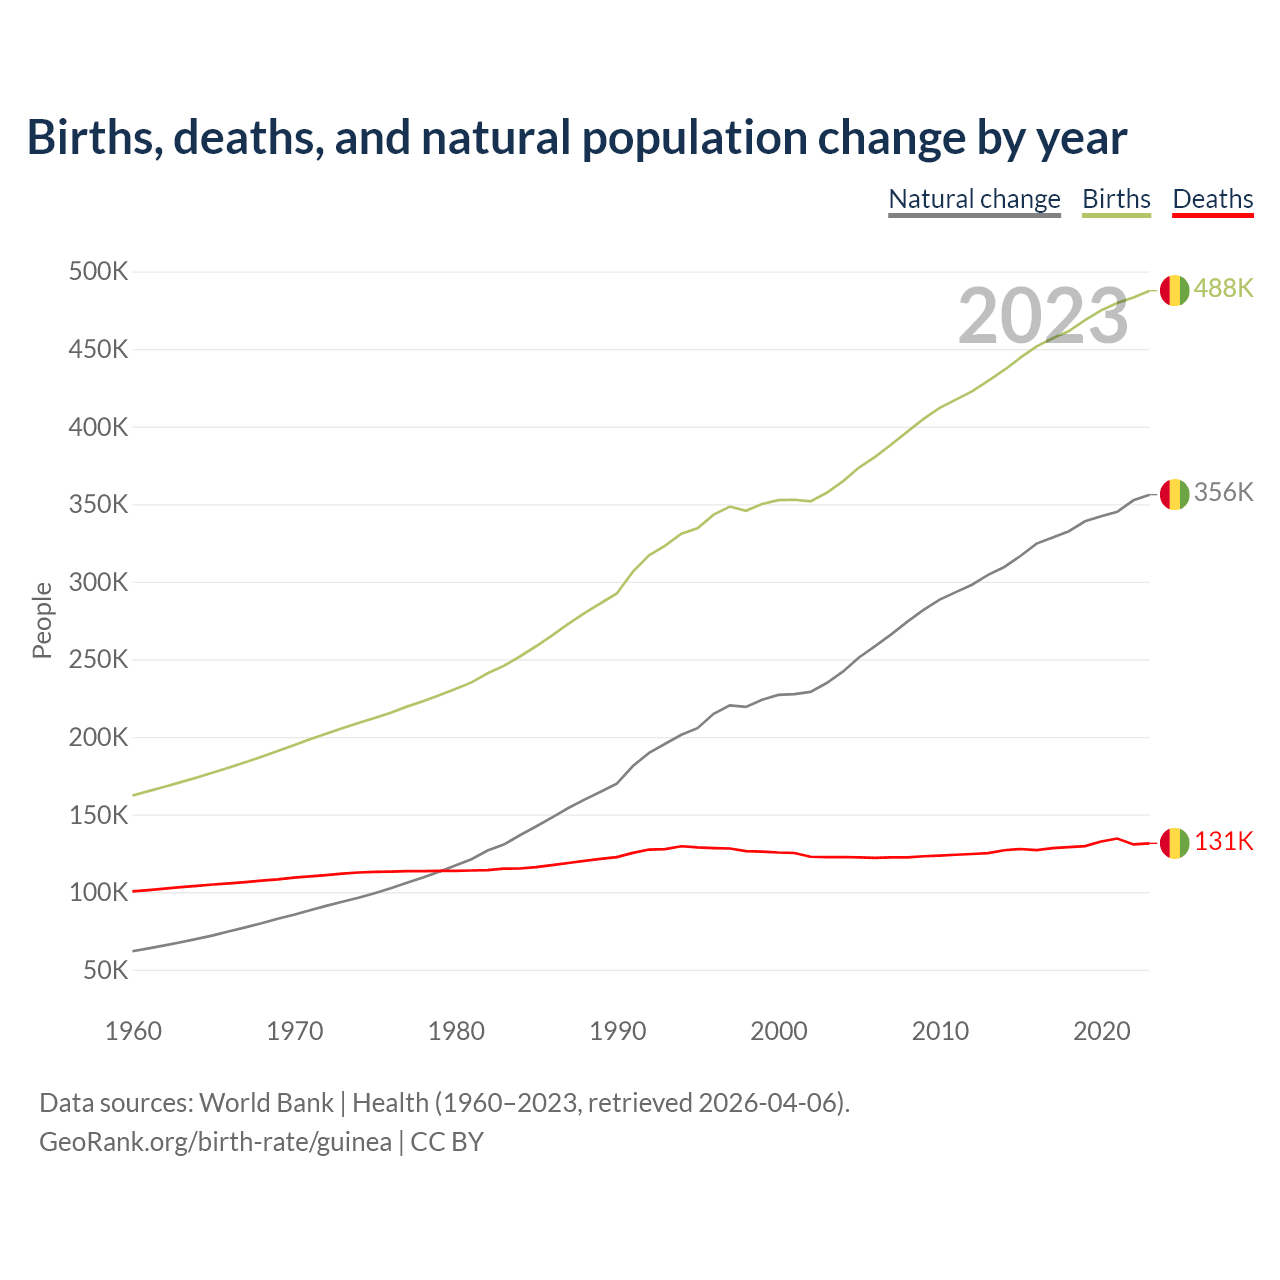
Births, deaths, and natural population change by year
| Year | People | ||
|---|---|---|---|
| Natural change | Births | Deaths | |
| 2024 | 358,497 | 491,703 | 133,206 |
| 2023 | 356,147 | 487,596 | 131,449 |
| 2022 | 352,517 | 483,229 | 130,712 |
| 2021 | 345,121 | 479,634 | 134,513 |
| 2020 | 342,289 | 474,917 | 132,628 |
| 2019 | 338,984 | 468,610 | 129,626 |
| 2018 | 332,585 | 461,551 | 128,966 |
| 2017 | 328,542 | 456,919 | 128,377 |
| 2016 | 324,608 | 451,700 | 127,092 |
| 2015 | 316,604 | 444,406 | 127,802 |
| 2014 | 309,539 | 436,498 | 126,959 |
| 2013 | 304,430 | 429,532 | 125,102 |
| 2012 | 298,094 | 422,665 | 124,571 |
| 2011 | 293,318 | 417,373 | 124,055 |
| 2010 | 288,512 | 412,048 | 123,536 |
| 2009 | 281,920 | 405,011 | 123,091 |
| 2008 | 274,327 | 396,746 | 122,419 |
| 2007 | 266,070 | 388,491 | 122,421 |
| 2006 | 258,518 | 380,545 | 122,027 |
| 2005 | 251,209 | 373,633 | 122,424 |
| 2004 | 242,075 | 364,720 | 122,645 |
| 2003 | 234,774 | 357,350 | 122,576 |
| 2002 | 229,022 | 351,820 | 122,798 |
| 2001 | 227,642 | 352,854 | 125,212 |
| 2000 | 227,081 | 352,603 | 125,522 |
| 1999 | 223,968 | 350,077 | 126,109 |
| 1998 | 219,385 | 345,771 | 126,386 |
| 1997 | 220,373 | 348,464 | 128,091 |
| 1996 | 214,896 | 343,249 | 128,353 |
| 1995 | 205,644 | 334,457 | 128,813 |
| 1994 | 201,439 | 330,977 | 129,538 |
| 1993 | 195,612 | 323,348 | 127,736 |
| 1992 | 189,682 | 317,099 | 127,417 |
| 1991 | 181,299 | 306,582 | 125,283 |
| 1990 | 169,926 | 292,455 | 122,529 |
| 1989 | 164,707 | 286,151 | 121,444 |
| 1988 | 159,566 | 279,734 | 120,168 |
| 1987 | 154,178 | 272,913 | 118,735 |
| 1986 | 148,137 | 265,479 | 117,342 |
| 1985 | 142,313 | 258,447 | 116,134 |
| 1984 | 136,640 | 251,859 | 115,219 |
| 1983 | 130,629 | 245,784 | 115,155 |
| 1982 | 126,831 | 241,015 | 114,184 |
| 1981 | 121,223 | 235,151 | 113,928 |
| 1980 | 117,186 | 230,919 | 113,733 |
| 1979 | 113,141 | 226,812 | 113,671 |
| 1978 | 109,415 | 222,966 | 113,551 |
| 1977 | 105,990 | 219,531 | 113,541 |
| 1976 | 102,449 | 215,618 | 113,169 |
| 1975 | 99,267 | 212,263 | 112,996 |
| 1974 | 96,315 | 208,935 | 112,620 |
| 1973 | 93,764 | 205,628 | 111,864 |
| 1972 | 91,147 | 202,044 | 110,897 |
| 1971 | 88,358 | 198,470 | 110,112 |
| 1970 | 85,418 | 194,700 | 109,282 |
| 1969 | 82,799 | 190,955 | 108,156 |
| 1968 | 79,892 | 187,262 | 107,370 |
| 1967 | 77,251 | 183,725 | 106,474 |
| 1966 | 74,748 | 180,337 | 105,589 |
| 1965 | 72,134 | 177,054 | 104,920 |
| 1964 | 69,848 | 173,904 | 104,056 |
| 1963 | 67,690 | 170,859 | 103,169 |
| 1962 | 65,672 | 167,925 | 102,253 |
| 1961 | 63,766 | 165,069 | 101,303 |
| 1960 | 61,848 | 162,269 | 100,421 |
Data sources: World Bank | Health (1960–2024, retrieved 2026-07-08).
GeoRank.org/birth-rate/guinea | CC BY
Over the past 10 years, the natural population change in Guinea (from births and deaths only, excluding migration) has been +2.57% annually. On average, 339,589 more people were born each year than died.
Excluding migration, the natural population change due to births and deaths from 2023 to 2024 was 2.43% — 358,497 more people were born than died.
In 2024, Guinea ranks 47/196 for absolute natural population change and 21/196 for natural change rate, where a lower rank number indicates faster natural growth and a higher number indicates greater decline.
Birth rates in Guinea compared to other countries
 Guinea
|
Rank | |
|---|---|---|
|
Fertility rate
|
4.13 | 20/196 |
|
Birth rate
|
33.3 | 16/196 |
| Population change due to births and deaths | +358,497 | 47/196 |
| Natural population change rate | +2.43% | 21/196 |
| Population growth | +2.34% | 34/197 |
| Age at first childbirth | 19.9 years | 116/137 |
| Average age at childbearing | 28.1 years | 159/197 |
| Annual births per 1,000 women ages 15-19 | 114.3 | 11/197 |
| Annual births per 1,000 women ages 20-29 | 188.4 | 25/197 |
| Annual births per 1,000 women ages 30+ | 58.4 | 29/197 |
| Female of reproductive age (15-49), share of population | 24.7% | 96/196 |
| Any modern method of contraceptive prevalence among married women ages 15-49 | 10.6% | 172/179 |
| Share of births attended by skilled health staff | 55.3% | 178/191 |
| Maternal mortality per live birth | 0.49% | 10/193 |
| Neonatal mortality rate (before reaching 28 days of age) | 2.98% | 13/193 |
| Infant mortality rate (before reaching 1 year of age) | 5.98% | 7/196 |
| Mortality rate before reaching 5 years of age | 9.21% | 6/192 |
| Life expectancy | 61.2 years | 190/197 |
Birth rates by women's age
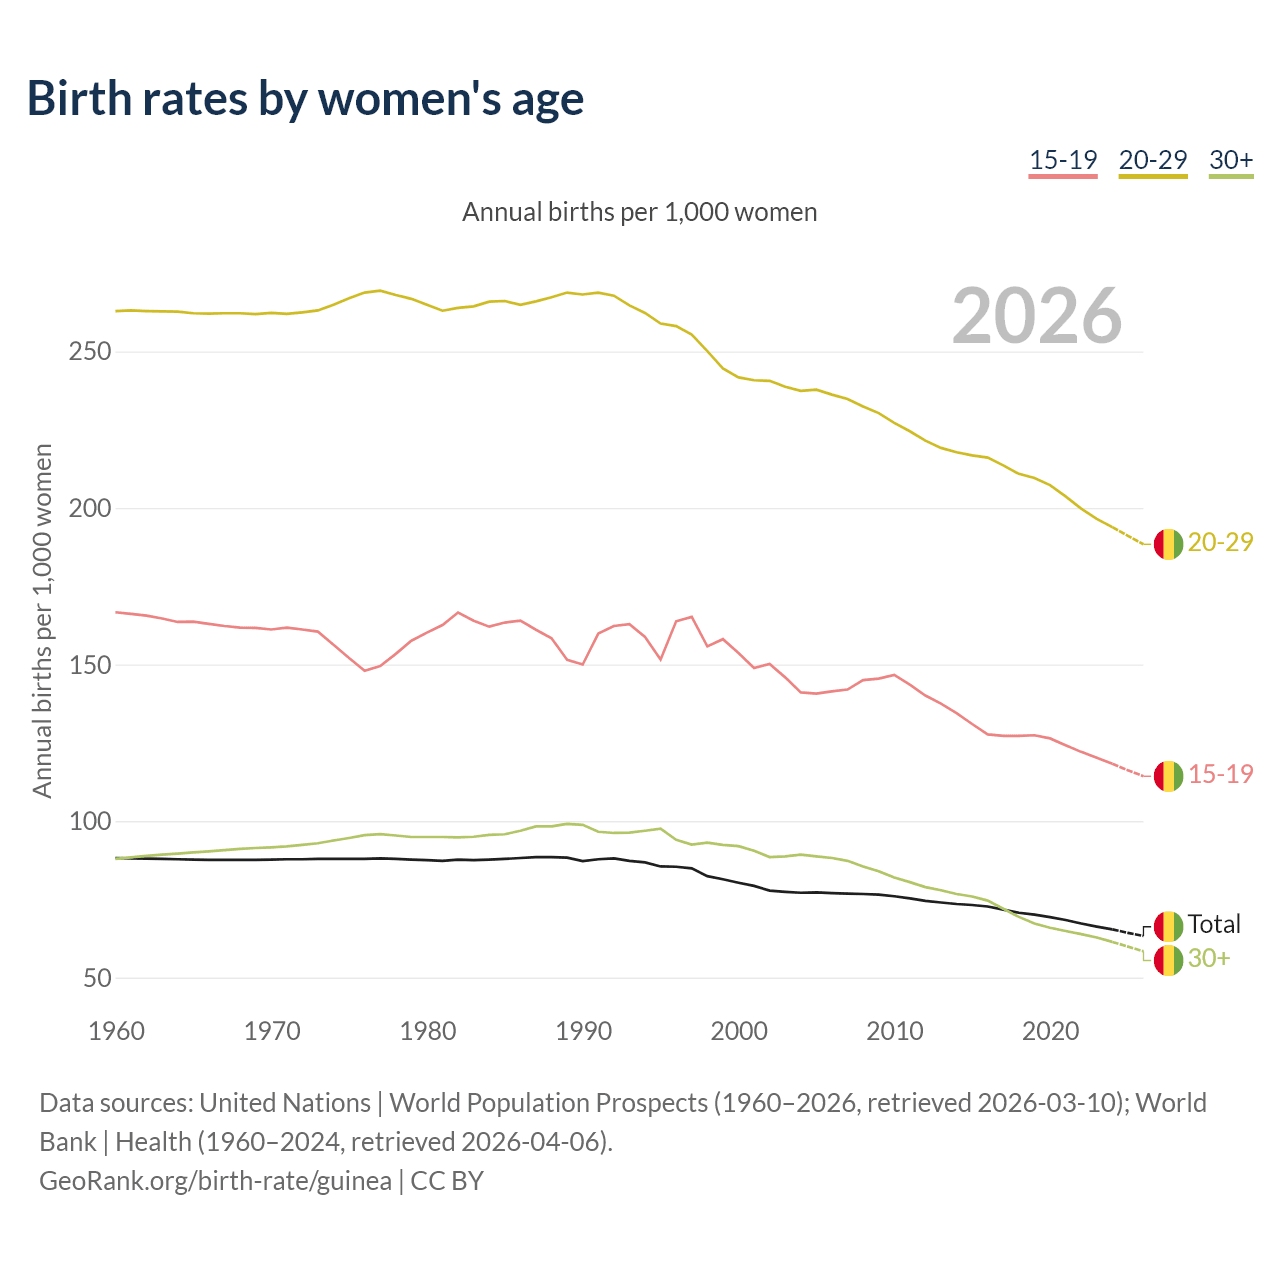
Annual births per 1,000 women
| Year | Annual births per 1,000 women | |||
|---|---|---|---|---|
| Total | 15-19 | 20-29 | 30+ | |
| 2026 | 63.3 | 114.3 | 188.4 | 58.4 |
| 2025 | 64.3 | 116.2 | 191.1 | 59.9 |
| 2024 | 65.4 | 118.3 | 193.9 | 61.4 |
| 2023 | 66.3 | 120.2 | 196.5 | 62.8 |
| 2022 | 67.3 | 122.1 | 199.8 | 63.9 |
| 2021 | 68.4 | 124.2 | 203.7 | 64.9 |
| 2020 | 69.3 | 126.4 | 207.3 | 65.9 |
| 2019 | 70.1 | 127.4 | 209.6 | 67.3 |
| 2018 | 70.7 | 127.2 | 210.9 | 69.4 |
| 2017 | 71.7 | 127.2 | 213.6 | 72 |
| 2016 | 72.7 | 127.7 | 216.1 | 74.6 |
| 2015 | 73.2 | 131 | 216.8 | 75.9 |
| 2014 | 73.5 | 134.5 | 217.8 | 76.7 |
| 2013 | 74 | 137.5 | 219.2 | 77.9 |
| 2012 | 74.5 | 140.1 | 221.5 | 78.9 |
| 2011 | 75.3 | 143.6 | 224.5 | 80.5 |
| 2010 | 76 | 146.7 | 227.2 | 82 |
| 2009 | 76.5 | 145.5 | 230.3 | 84 |
| 2008 | 76.7 | 145 | 232.4 | 85.5 |
| 2007 | 76.8 | 142 | 234.8 | 87.3 |
| 2006 | 77 | 141.4 | 236.2 | 88.2 |
| 2005 | 77.2 | 140.7 | 237.8 | 88.7 |
| 2004 | 77.1 | 141.1 | 237.4 | 89.3 |
| 2003 | 77.4 | 145.9 | 238.7 | 88.7 |
| 2002 | 77.8 | 150.2 | 240.6 | 88.5 |
| 2001 | 79.3 | 148.9 | 240.8 | 90.5 |
| 2000 | 80.3 | 153.7 | 241.7 | 92 |
| 1999 | 81.4 | 158.1 | 244.6 | 92.4 |
| 1998 | 82.4 | 155.8 | 250.1 | 93.1 |
| 1997 | 84.9 | 165.2 | 255.4 | 92.5 |
| 1996 | 85.4 | 163.8 | 258.1 | 94 |
| 1995 | 85.5 | 151.6 | 258.9 | 97.6 |
| 1994 | 86.8 | 158.8 | 262.3 | 96.9 |
| 1993 | 87.3 | 162.9 | 264.7 | 96.3 |
| 1992 | 88.1 | 162.3 | 267.8 | 96.2 |
| 1991 | 87.8 | 159.9 | 268.8 | 96.6 |
| 1990 | 87.2 | 150 | 268.2 | 98.8 |
| 1989 | 88.3 | 151.5 | 268.8 | 99.1 |
| 1988 | 88.5 | 158.4 | 267.3 | 98.3 |
| 1987 | 88.5 | 161.1 | 266 | 98.3 |
| 1986 | 88.2 | 164 | 264.9 | 96.9 |
| 1985 | 87.9 | 163.4 | 266.1 | 95.8 |
| 1984 | 87.7 | 162.1 | 265.9 | 95.6 |
| 1983 | 87.5 | 164 | 264.4 | 95 |
| 1982 | 87.7 | 166.6 | 263.9 | 94.8 |
| 1981 | 87.3 | 162.6 | 263 | 94.9 |
| 1980 | 87.5 | 160.2 | 264.9 | 94.9 |
| 1979 | 87.7 | 157.6 | 266.8 | 94.9 |
| 1978 | 87.9 | 153.4 | 268 | 95.4 |
| 1977 | 88.1 | 149.5 | 269.4 | 95.8 |
| 1976 | 87.9 | 148 | 268.8 | 95.5 |
| 1975 | 87.9 | 152.1 | 267 | 94.6 |
| 1974 | 87.9 | 156.3 | 264.9 | 93.8 |
| 1973 | 87.9 | 160.5 | 263.1 | 92.9 |
| 1972 | 87.8 | 161.2 | 262.5 | 92.4 |
| 1971 | 87.8 | 161.8 | 262 | 91.9 |
| 1970 | 87.7 | 161.2 | 262.3 | 91.6 |
| 1969 | 87.6 | 161.7 | 261.9 | 91.4 |
| 1968 | 87.6 | 161.8 | 262.2 | 91.1 |
| 1967 | 87.6 | 162.3 | 262.2 | 90.7 |
| 1966 | 87.6 | 163 | 262.1 | 90.3 |
| 1965 | 87.7 | 163.7 | 262.2 | 90 |
| 1964 | 87.8 | 163.6 | 262.7 | 89.6 |
| 1963 | 87.9 | 164.7 | 262.8 | 89.3 |
| 1962 | 88 | 165.6 | 262.9 | 88.9 |
| 1961 | 88.1 | 166.2 | 263.1 | 88.4 |
| 1960 | 88.2 | 166.7 | 262.9 | 87.9 |
Data sources: United Nations | World Population Prospects (1960–2026, retrieved 2026-07-08); World Bank | Health (1960–2025, retrieved 2026-07-08).
GeoRank.org/birth-rate/guinea | CC BY
Above is a chart displaying birth rates in Guinea by maternal age. In 2026, of all live births, 19% will be to women under age 20, 51.4% to women ages 20-29, and 29.6% to women ages 30 and above. The respective shares in 1990 were 16.8%, 47.4%, and 35.8%.
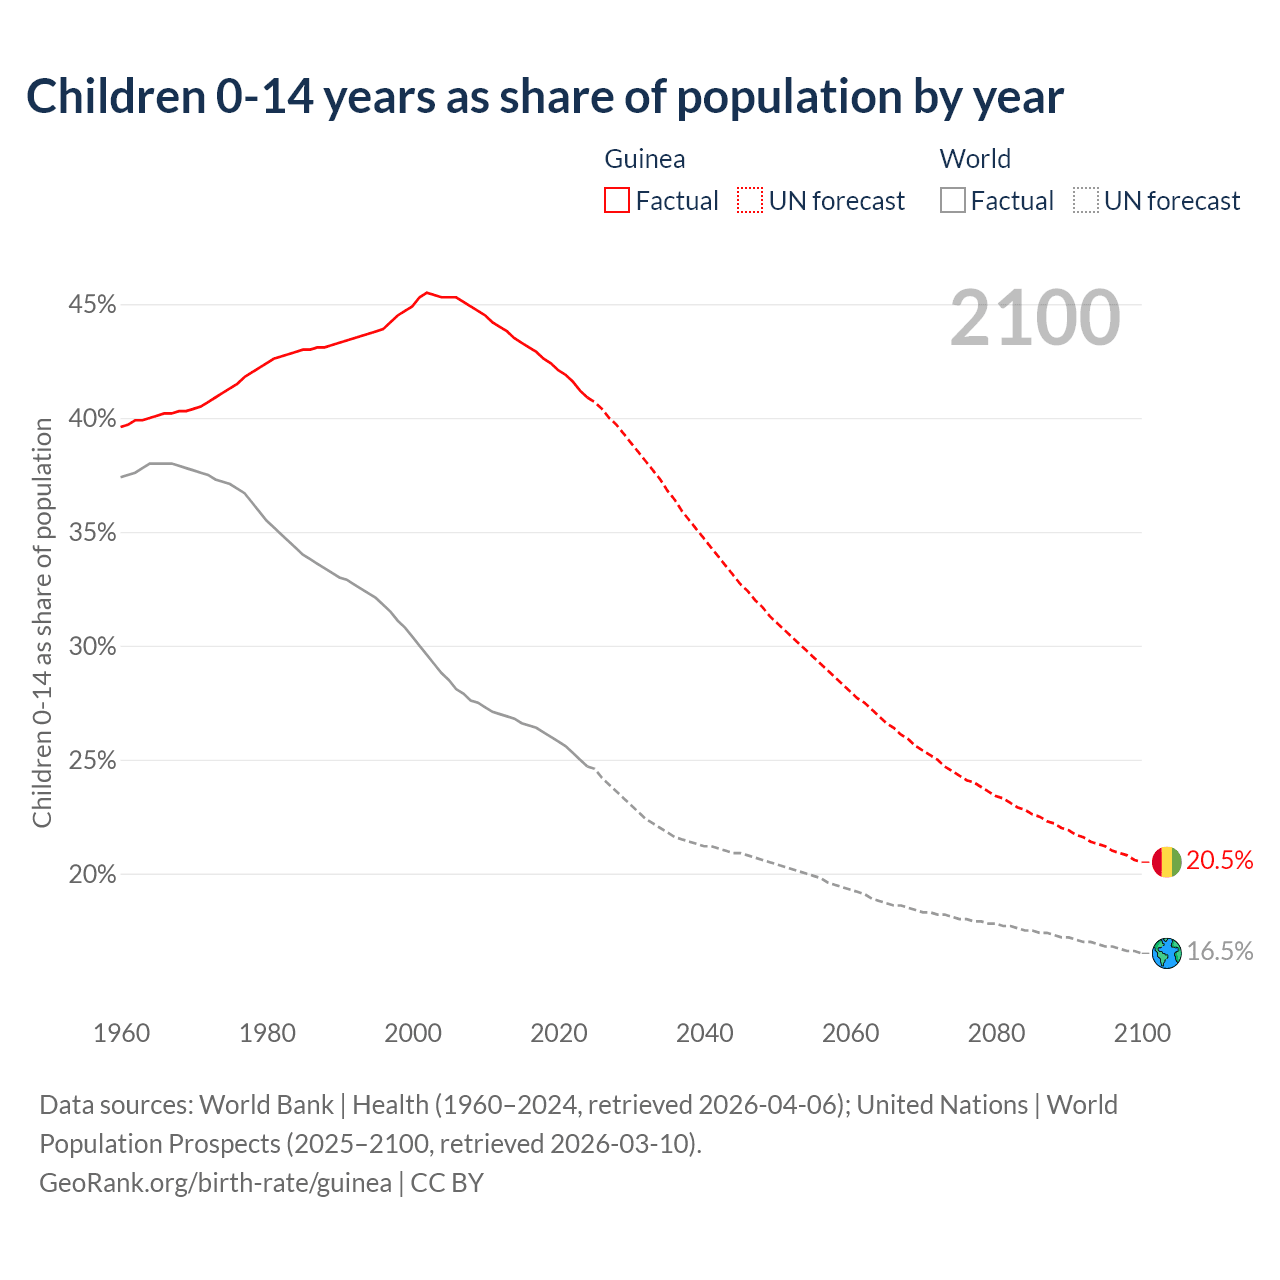
Children 0-14 years as share of population by year
| Year | Children 0-14 as share of population | |
|---|---|---|
|
Guinea
|
 World
World
|
|
| 2100 | 20.5% | 16.5% |
| 2099 | 20.6% | 16.6% |
| 2098 | 20.8% | 16.6% |
| 2097 | 20.9% | 16.7% |
| 2096 | 21% | 16.8% |
| 2095 | 21.2% | 16.8% |
| 2094 | 21.3% | 16.9% |
| 2093 | 21.4% | 17% |
| 2092 | 21.6% | 17% |
| 2091 | 21.7% | 17.1% |
| 2090 | 21.9% | 17.2% |
| 2089 | 22% | 17.2% |
| 2088 | 22.2% | 17.3% |
| 2087 | 22.3% | 17.4% |
| 2086 | 22.5% | 17.4% |
| 2085 | 22.6% | 17.5% |
| 2084 | 22.8% | 17.5% |
| 2083 | 22.9% | 17.6% |
| 2082 | 23.1% | 17.7% |
| 2081 | 23.3% | 17.7% |
| 2080 | 23.4% | 17.8% |
| 2079 | 23.6% | 17.8% |
| 2078 | 23.8% | 17.9% |
| 2077 | 24% | 17.9% |
| 2076 | 24.1% | 18% |
| 2075 | 24.3% | 18% |
| 2074 | 24.5% | 18.1% |
| 2073 | 24.7% | 18.2% |
| 2072 | 25% | 18.2% |
| 2071 | 25.2% | 18.3% |
| 2070 | 25.4% | 18.3% |
| 2069 | 25.6% | 18.4% |
| 2068 | 25.9% | 18.5% |
| 2067 | 26.1% | 18.6% |
| 2066 | 26.4% | 18.6% |
| 2065 | 26.6% | 18.7% |
| 2064 | 26.9% | 18.8% |
| 2063 | 27.2% | 18.9% |
| 2062 | 27.5% | 19.1% |
| 2061 | 27.7% | 19.2% |
| 2060 | 28% | 19.3% |
| 2059 | 28.3% | 19.4% |
| 2058 | 28.6% | 19.5% |
| 2057 | 28.9% | 19.6% |
| 2056 | 29.2% | 19.8% |
| 2055 | 29.5% | 19.9% |
| 2054 | 29.8% | 20% |
| 2053 | 30.1% | 20.1% |
| 2052 | 30.4% | 20.2% |
| 2051 | 30.7% | 20.3% |
| 2050 | 31% | 20.4% |
| 2049 | 31.3% | 20.5% |
| 2048 | 31.7% | 20.6% |
| 2047 | 32% | 20.7% |
| 2046 | 32.4% | 20.8% |
| 2045 | 32.7% | 20.9% |
| 2044 | 33.1% | 20.9% |
| 2043 | 33.5% | 21% |
| 2042 | 33.9% | 21.1% |
| 2041 | 34.3% | 21.2% |
| 2040 | 34.7% | 21.2% |
| 2039 | 35.1% | 21.3% |
| 2038 | 35.5% | 21.4% |
| 2037 | 35.9% | 21.5% |
| 2036 | 36.4% | 21.6% |
| 2035 | 36.8% | 21.8% |
| 2034 | 37.3% | 22% |
| 2033 | 37.7% | 22.2% |
| 2032 | 38.1% | 22.4% |
| 2031 | 38.5% | 22.7% |
| 2030 | 38.9% | 23% |
| 2029 | 39.3% | 23.3% |
| 2028 | 39.7% | 23.6% |
| 2027 | 40% | 23.9% |
| 2026 | 40.4% | 24.2% |
| 2025 | 40.5% | 24.4% |
| 2024 | 40.9% | 24.7% |
| 2023 | 41.2% | 25% |
| 2022 | 41.6% | 25.3% |
| 2021 | 41.9% | 25.6% |
| 2020 | 42.1% | 25.8% |
| 2019 | 42.4% | 26% |
| 2018 | 42.6% | 26.2% |
| 2017 | 42.9% | 26.4% |
| 2016 | 43.1% | 26.5% |
| 2015 | 43.3% | 26.6% |
| 2014 | 43.5% | 26.8% |
| 2013 | 43.8% | 26.9% |
| 2012 | 44% | 27% |
| 2011 | 44.2% | 27.1% |
| 2010 | 44.5% | 27.3% |
| 2009 | 44.7% | 27.5% |
| 2008 | 44.9% | 27.6% |
| 2007 | 45.1% | 27.9% |
| 2006 | 45.3% | 28.1% |
| 2005 | 45.3% | 28.5% |
| 2004 | 45.3% | 28.8% |
| 2003 | 45.4% | 29.2% |
| 2002 | 45.5% | 29.6% |
| 2001 | 45.3% | 30% |
| 2000 | 44.9% | 30.4% |
| 1999 | 44.7% | 30.8% |
| 1998 | 44.5% | 31.1% |
| 1997 | 44.2% | 31.5% |
| 1996 | 43.9% | 31.8% |
| 1995 | 43.8% | 32.1% |
| 1994 | 43.7% | 32.3% |
| 1993 | 43.6% | 32.5% |
| 1992 | 43.5% | 32.7% |
| 1991 | 43.4% | 32.9% |
| 1990 | 43.3% | 33% |
| 1989 | 43.2% | 33.2% |
| 1988 | 43.1% | 33.3% |
| 1987 | 43.1% | 33.6% |
| 1986 | 43% | 33.8% |
| 1985 | 43% | 34% |
| 1984 | 42.9% | 34.3% |
| 1983 | 42.8% | 34.6% |
| 1982 | 42.7% | 34.9% |
| 1981 | 42.6% | 35.2% |
| 1980 | 42.4% | 35.5% |
| 1979 | 42.2% | 35.8% |
| 1978 | 42% | 36.3% |
| 1977 | 41.8% | 36.7% |
| 1976 | 41.5% | 36.9% |
| 1975 | 41.3% | 37.1% |
| 1974 | 41.1% | 37.2% |
| 1973 | 40.9% | 37.3% |
| 1972 | 40.7% | 37.5% |
| 1971 | 40.5% | 37.6% |
| 1970 | 40.4% | 37.7% |
| 1969 | 40.3% | 37.8% |
| 1968 | 40.3% | 37.9% |
| 1967 | 40.2% | 38% |
| 1966 | 40.2% | 38% |
| 1965 | 40.1% | 38% |
| 1964 | 40% | 38% |
| 1963 | 39.9% | 37.8% |
| 1962 | 39.9% | 37.6% |
| 1961 | 39.7% | 37.5% |
| 1960 | 39.6% | 37.4% |
Data sources: World Bank | Health (1960–2025, retrieved 2026-07-08); United Nations | World Population Prospects (2026–2100, retrieved 2026-07-08).
GeoRank.org/birth-rate/guinea | CC BY
The share of children aged 0-14 in Guinea was 39.6% in 1960, 43.6% in 1993, and 40.5% as of the latest data in 2025.
More about the demographics of Guinea.
Fertility rates around the globe
Data sources: World Bank | Health (1960–2024, retrieved 2026-07-08).
GeoRank.org/birth-rate/guinea | CC BY
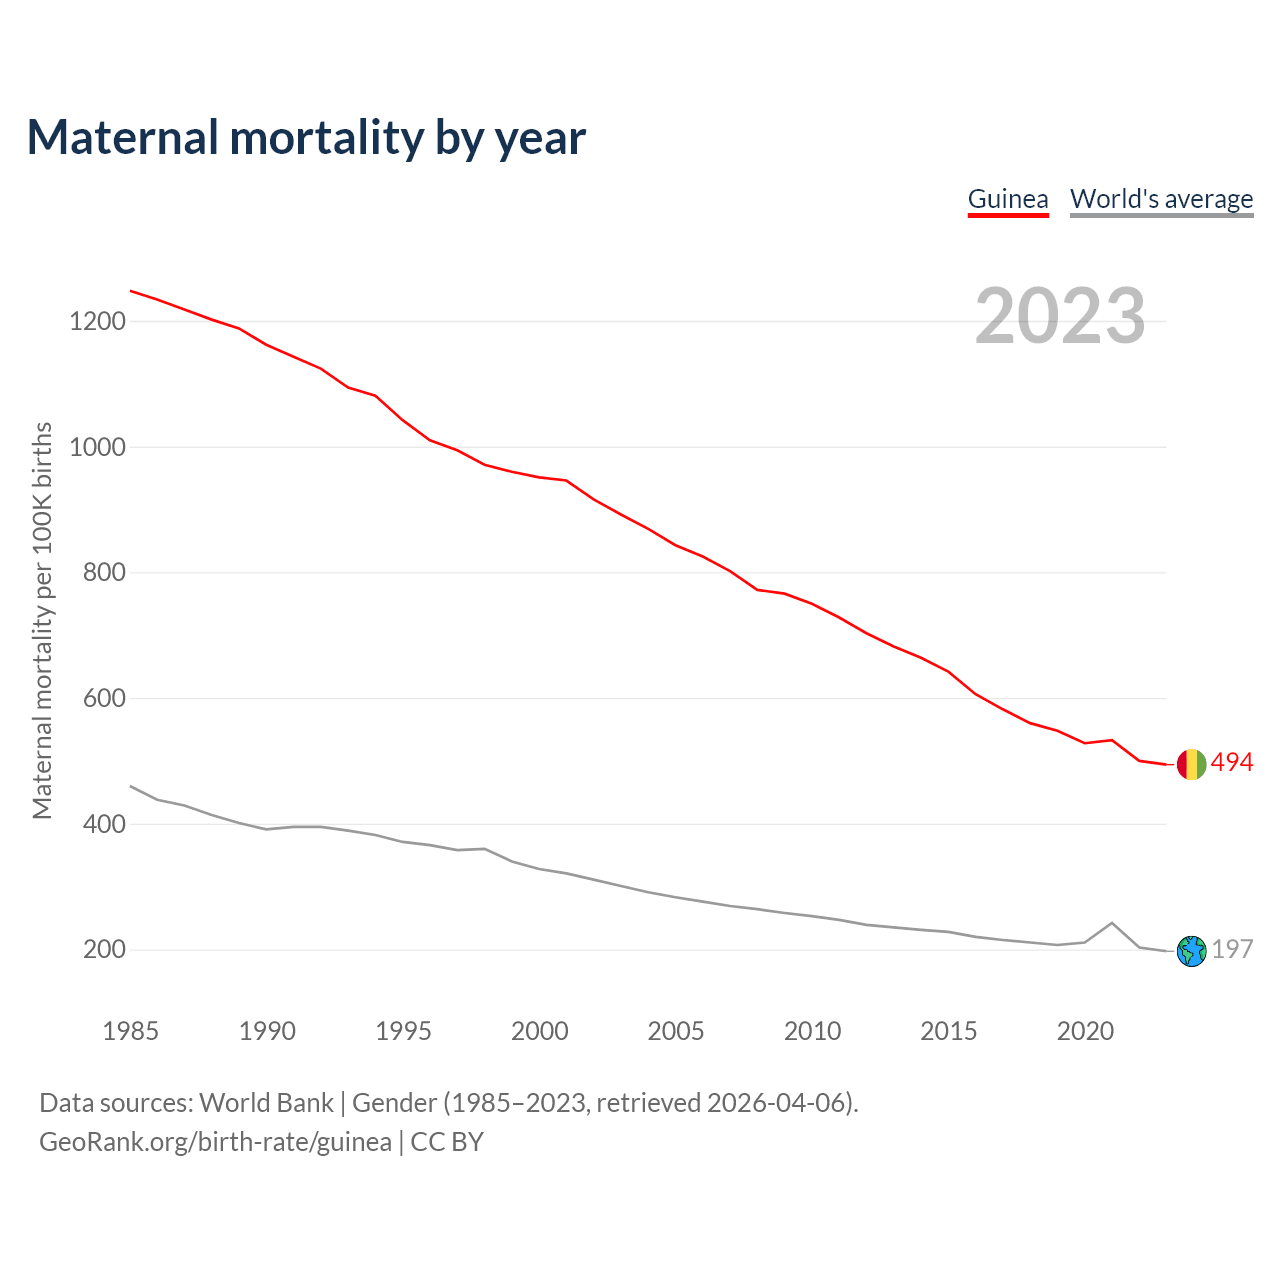
Maternal mortality by year
| Year | Maternal mortality per 100K births | |
|---|---|---|
|
Guinea
|
World
|
|
| 2023 | 494 | 197 |
| 2022 | 500 | 203 |
| 2021 | 533 | 242 |
| 2020 | 528 | 211 |
| 2019 | 548 | 207 |
| 2018 | 560 | 211 |
| 2017 | 582 | 215 |
| 2016 | 606 | 220 |
| 2015 | 642 | 228 |
| 2014 | 664 | 231 |
| 2013 | 682 | 235 |
| 2012 | 703 | 239 |
| 2011 | 728 | 247 |
| 2010 | 750 | 253 |
| 2009 | 766 | 258 |
| 2008 | 772 | 264 |
| 2007 | 802 | 269 |
| 2006 | 825 | 276 |
| 2005 | 843 | 283 |
| 2004 | 869 | 291 |
| 2003 | 892 | 301 |
| 2002 | 916 | 311 |
| 2001 | 946 | 321 |
| 2000 | 951 | 328 |
| 1999 | 960 | 340 |
| 1998 | 971 | 360 |
| 1997 | 994 | 358 |
| 1996 | 1,010 | 366 |
| 1995 | 1,042 | 371 |
| 1994 | 1,081 | 382 |
| 1993 | 1,094 | 389 |
| 1992 | 1,124 | 395 |
| 1991 | 1,143 | 395 |
| 1990 | 1,162 | 391 |
| 1989 | 1,188 | 401 |
| 1988 | 1,202 | 414 |
| 1987 | 1,218 | 429 |
| 1986 | 1,234 | 438 |
| 1985 | 1,248 | 460 |
Data sources: World Bank | Gender (1985–2023, retrieved 2026-07-08).
GeoRank.org/birth-rate/guinea | CC BY
The maternal mortality rate in Guinea was 494 deaths per 100,000 live births in 2023 — a 0.49% chance of dying during childbirth or within 42 days of pregnancy termination. This is a 48.1% decrease compared to the year 2000.
Under-five mortality by year
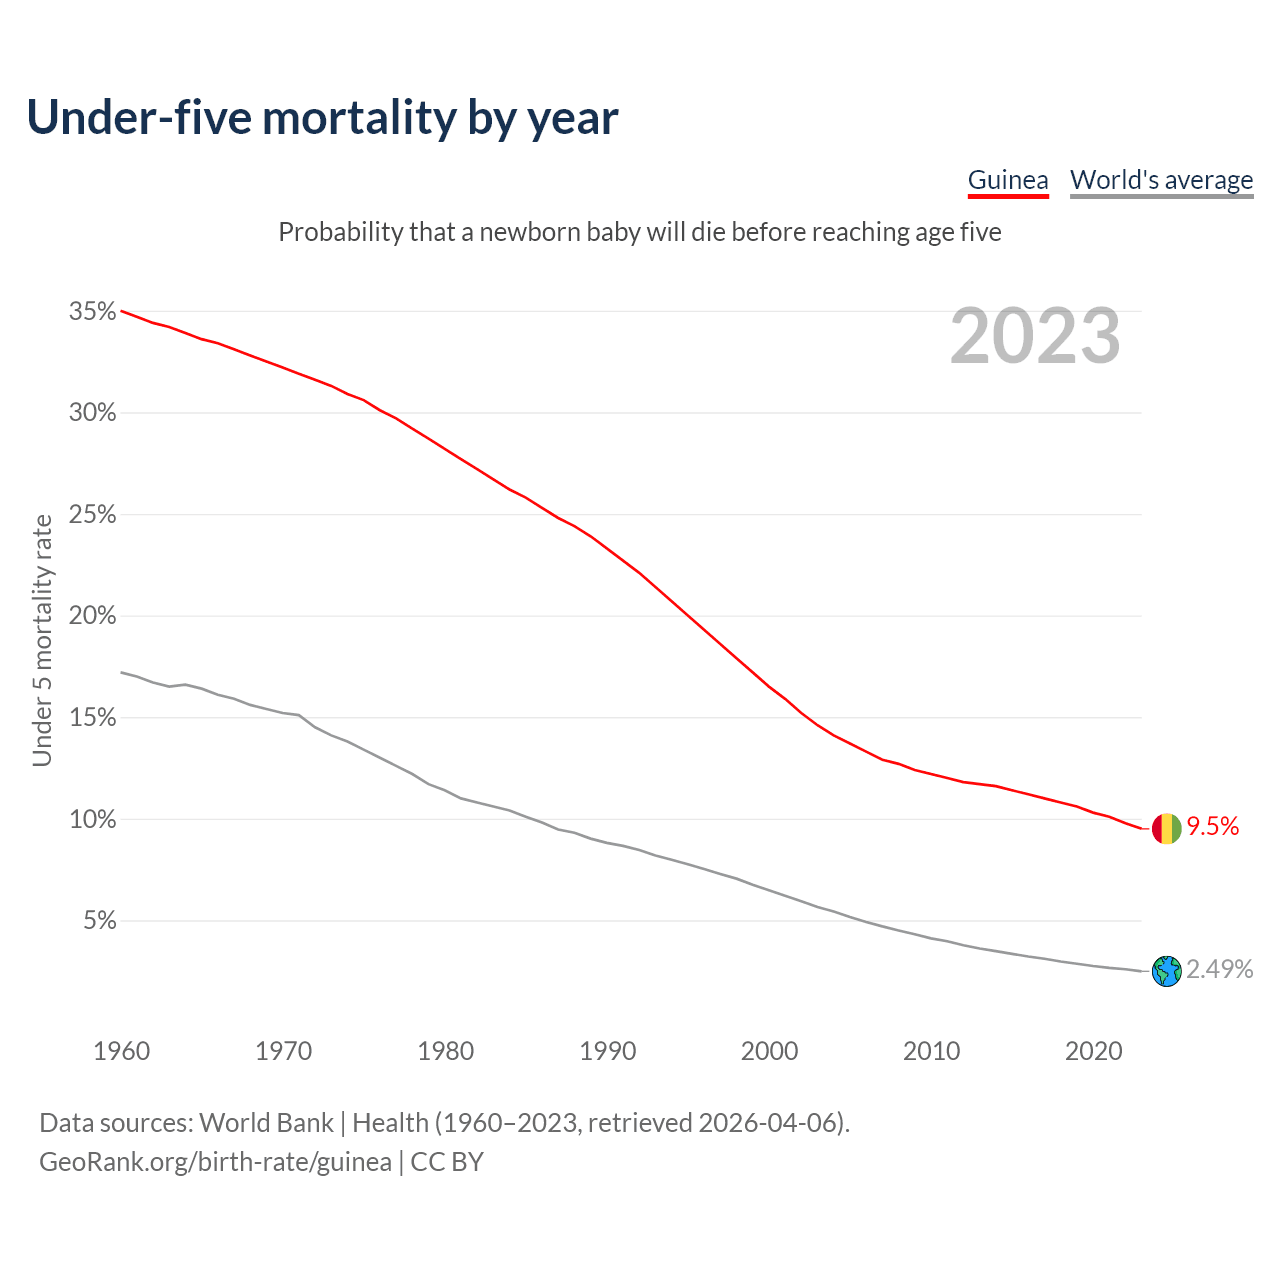
Probability that a newborn baby will die before reaching age five
| Year | Under 5 mortality rate | |
|---|---|---|
|
Guinea
|
World
|
|
| 2024 | 9.21% | 2.49% |
| 2023 | 9.5% | 2.58% |
| 2022 | 9.76% | 2.7% |
| 2021 | 10% | 2.75% |
| 2020 | 10.3% | 2.79% |
| 2019 | 10.5% | 2.89% |
| 2018 | 10.8% | 2.98% |
| 2017 | 11% | 3.11% |
| 2016 | 11.1% | 3.21% |
| 2015 | 11.4% | 3.32% |
| 2014 | 11.5% | 3.44% |
| 2013 | 11.7% | 3.56% |
| 2012 | 11.8% | 3.72% |
| 2011 | 12% | 3.92% |
| 2010 | 12.2% | 4.06% |
| 2009 | 12.4% | 4.26% |
| 2008 | 12.7% | 4.45% |
| 2007 | 13% | 4.65% |
| 2006 | 13.3% | 4.87% |
| 2005 | 13.7% | 5.12% |
| 2004 | 14.2% | 5.44% |
| 2003 | 14.7% | 5.67% |
| 2002 | 15.3% | 5.96% |
| 2001 | 15.9% | 6.26% |
| 2000 | 16.6% | 6.52% |
| 1999 | 17.3% | 6.8% |
| 1998 | 18% | 7.13% |
| 1997 | 18.7% | 7.34% |
| 1996 | 19.4% | 7.6% |
| 1995 | 20.1% | 7.77% |
| 1994 | 20.8% | 8% |
| 1993 | 21.4% | 8.26% |
| 1992 | 22.1% | 8.47% |
| 1991 | 22.8% | 8.67% |
| 1990 | 23.3% | 8.84% |
| 1989 | 23.9% | 9.06% |
| 1988 | 24.4% | 9.44% |
| 1987 | 24.8% | 9.51% |
| 1986 | 25.3% | 9.86% |
| 1985 | 25.8% | 10.2% |
| 1984 | 26.2% | 10.4% |
| 1983 | 26.7% | 10.7% |
| 1982 | 27.2% | 10.9% |
| 1981 | 27.6% | 11.2% |
| 1980 | 28.1% | 11.5% |
| 1979 | 28.6% | 11.8% |
| 1978 | 29.1% | 12.3% |
| 1977 | 29.5% | 12.6% |
| 1976 | 30% | 13.1% |
| 1975 | 30.4% | 13.6% |
| 1974 | 30.8% | 13.9% |
| 1973 | 31.1% | 14.2% |
| 1972 | 31.5% | 14.6% |
| 1971 | 31.8% | 15.1% |
| 1970 | 32.1% | 15.6% |
| 1969 | 32.4% | 15.8% |
| 1968 | 32.7% | 16% |
| 1967 | 32.9% | 15.9% |
| 1966 | 33.2% | 16.2% |
| 1965 | 33.5% | 16.5% |
| 1964 | 33.7% | 16.6% |
| 1963 | 34% | 16.5% |
| 1962 | 34.2% | 16.7% |
| 1961 | 34.4% | 17% |
| 1960 | 34.7% | 17.3% |
Data sources: World Bank | Health (1960–2024, retrieved 2026-07-08).
GeoRank.org/birth-rate/guinea | CC BY
The under-5 mortality rate in Guinea was 92.1 deaths per 1,000 live births in 2024 — a 9.21% chance that a newborn baby will die before reaching age five. This is down from 165.7 deaths per 1,000 live births in 2000.
Compare countries by 7 more topics
Help us show the world through your eyes
Share a photo of your city and help others discover what it looks like to live there. Your contribution makes our data come alive.
Data sources:
- World Bank | Health (1960–2025, retrieved 2026-07-08)
- United Nations | World Population Prospects (1960–2100, retrieved 2026-07-08)
- Central Intelligence Agency (CIA) (2017–2025, retrieved 2026-07-08)
Creative Commons Attribution (CC BY) — you’re free to copy, share, remix, adapt, and use even commercially as long as you give appropriate credit and clearly indicate if you made changes. Other sources may be subject to different license terms.
Fertility rate estimates the average number of children a woman would have over her lifetime based on a snapshot of current year age-specific birth patterns.
Birth rate represents the number of live births per 1,000 people in a population during a given year. Unlike the fertility rate, it does not account for age or sex composition of the population.