The global demographic is aging. The median age of the world's population is 31.8 years old today, it was 22.5 in 1960, and projected to be 37 by 2050. This aging trend is being driven by declining fertility rates and longer life expectancies.
- The world's population is currently over 8.31 billion people and is expected to reach 9.67 billion by 2050.
- The variations in the median and average ages between countries are even more significant: with a comparable population of over 100M, the median age in Japan is 50.8 years old, while in the DR Congo it's only 16.9 years old. Compare Japan and the DR Congo demographics.
- The proportion of children under 15 is declining. In 1960, 37.4% of the world's population was under the age of 15. Today, that number is 24.4%.
- The proportion of people over 65 is increasing. In 1960, only 4.97% of the world's population was over the age of 65. Today, that number is 10.4%.
- As of 2025, men slightly outnumber women globally with a ratio of 50.3% to 49.7%. This ratio is predicted to become equal by the year 2050.
- The top 10 nationalities and their approximate percentage of the world population: Chinese represent 16.9%, Indians 17.9%, Americans 4.15%, Indonesians 3.48%, Pakistanis 3.15%, Brazilians 2.57%, Nigerians 2.95%, Bangladeshis 2.15%, Russians 1.72%, and Mexicans 1.61%.
List of countries ranked by median age
The table below ranks 196 countries by median age and includes other demographic data: total population, birth rate, age distribution, and fertility rate for each country.
| Rank | Country | Median age | Population | Age 0-14, % | Working age, % | Age 65+, % | Fertility rate |
|---|---|---|---|---|---|---|---|
| 1 |
 Monaco
|
54.6 |
38054
|
13.8% | 50.2% | 35.9% | 2.1 |
| 2 |
 Japan
Japan
|
50.8 |
122704252
|
11.2% | 58.8% | 30.1% | 1.15 |
| 3 |
 San Marino
|
49.5 |
34159
|
11.9% | 65% | 23.5% | 1.16 |
| 4 |
 Italy
Italy
|
49.2 |
58708169
|
11.7% | 63.2% | 25.4% | 1.18 |
| 5 |
 Portugal
|
47.8 |
10788071
|
12.7% | 62.3% | 25.2% | 1.41 |
| 6 |
 Greece
|
47.8 |
10371575
|
12.9% | 62.7% | 24.6% | 1.24 |
| 7 |
 Spain
Spain
|
46.8 |
49323658
|
12.6% | 65.7% | 21.9% | 1.1 |
| 8 |
 Bosnia
|
46.7 |
3114736
|
12.8% | 64.3% | 23.2% | 1.49 |
| 9 |
 South Korea
|
46.7 |
51624449
|
10.2% | 69.5% | 20.9% | 0.75 |
| 10 |
 Germany
|
46.5 |
82830814
|
13.9% | 62.4% | 24% | 1.36 |
| 11 |
 Croatia
|
46.3 |
3849788
|
13.7% | 62.7% | 23.8% | 1.46 |
| 12 |
 Bulgaria
|
45.7 |
6390149
|
14.4% | 63.4% | 22.3% | 1.72 |
| 13 |
 Taiwan
|
45.7 |
23229461
|
11.5% | 68.4% | 20.5% | 0.89 |
| 14 |
 Slovenia
|
45.7 |
2128778
|
14.5% | 63.3% | 22.4% | 1.52 |
| 15 |
 Liechtenstein
|
45.5 |
41400
|
14.2% | 64.4% | 21.7% | 1.37 |
| 16 |
 Serbia
|
45.4 |
6500256
|
14.3% | 62.7% | 23.2% | 1.64 |
| 17 |
 Hungary
|
44.9 |
9454659
|
14.4% | 64.5% | 21.3% | 1.41 |
| 18 |
 Andorra
|
44.8 |
84217
|
11.6% | 71.8% | 16.9% | 1.09 |
| 19 |
 Czech Republic
|
44.8 |
10742283
|
15.1% | 63.7% | 21.4% | 1.36 |
| 20 |
 Austria
|
44.7 |
9201502
|
14.1% | 64.8% | 21.3% | 1.31 |
| 21 |
 Latvia
|
44.6 |
1826986
|
15.2% | 62.6% | 22.4% | 1.24 |
| 22 |
 Finland
|
44.2 |
5647947
|
14.3% | 61.5% | 24.4% | 1.25 |
| 23 |
 Romania
|
44.1 |
18912567
|
15.6% | 64.3% | 20.2% | 1.39 |
| 24 |
 Switzerland
|
43.9 |
9155878
|
14.9% | 64.7% | 20.6% | 1.29 |
| 25 |
 Estonia
|
43.8 |
1347027
|
15.3% | 62.9% | 22.1% | 1.18 |
| 26 |
 Poland
|
43.5 |
36007074
|
14.5% | 64.8% | 21.1% | 1.14 |
| 27 |
 Lithuania
|
43.4 |
2845693
|
14.5% | 64.8% | 21.1% | 1.11 |
| 28 |
 Cuba
Cuba
|
43.4 |
10893750
|
15% | 67.9% | 17.3% | 1.45 |
| 29 |
 Slovakia
|
43.3 |
5376239
|
15.6% | 65.4% | 19.3% | 1.46 |
| 30 |
 France
|
43.2 |
68871753
|
16.2% | 61.2% | 22.7% | 1.61 |
| 31 |
 Belgium
|
42.9 |
11967185
|
15.7% | 63.3% | 21.2% | 1.44 |
| 32 |
 Ukraine
|
42.9 |
40408451
|
13.7% | 67.3% | 18.9% | 0.99 |
| 33 |
 Netherlands
|
42.5 |
18243998
|
14.9% | 64.2% | 21.1% | 1.43 |
| 34 |
 Belarus
|
42.4 |
9025821
|
15.9% | 65.8% | 18.6% | 1.22 |
| 35 |
 Denmark
|
42.3 |
6042125
|
15.6% | 63.3% | 21.3% | 1.47 |
| 36 |
 Malta
Malta
|
42.1 |
586345
|
12.9% | 66.6% | 20.7% | 1.01 |
| 37 |
 North Macedonia
|
42 |
1811466
|
16.5% | 64.9% | 18.8% | 1.4 |
| 38 |
 Canada
|
41.7 |
42199836
|
15% | 64.8% | 20.5% | 1.25 |
| 39 |
 Thailand
|
41.5 |
71565981
|
14.4% | 69.6% | 16.3% | 1.2 |
| 40 |
 Russia
|
41.4 |
142643173
|
17% | 65.2% | 18.1% | 1.42 |
| 41 |
 Sweden
|
41.3 |
10665077
|
16.7% | 62.4% | 21% | 1.43 |
| 42 |
 China
China
|
41.1 |
1403335670
|
15.4% | 69.7% | 15% | 1.01 |
| 43 |
 United Kingdom
|
41.1 |
70071289
|
17% | 63.3% | 19.8% | 1.55 |
| 44 |
 Montenegro
|
41 |
613759
|
17.9% | 63.8% | 18.6% | 1.8 |
| 45 |
 Norway
|
40.9 |
5660666
|
15.9% | 65% | 19.2% | 1.45 |
| 46 |
 Luxembourg
|
40.5 |
697802
|
15.7% | 68.4% | 16% | 1.25 |
| 47 |
 Barbados
|
40.4 |
282789
|
17.1% | 65.8% | 17.4% | 1.71 |
| 48 |
 Ireland
|
40 |
5562212
|
18.1% | 65.7% | 16.4% | 1.47 |
| 49 |
 Curacao
|
39.7 |
156236
|
14.6% | 68.1% | 17.6% | 1.4 |
| 50 |
 Cayman Islands
|
39.7 |
77917
|
16.1% | 74.4% | 9.78% | 1.53 |
| 51 |
 Cyprus
|
39.6 |
1388591
|
16.1% | 69% | 15.1% | 1.38 |
| 52 |
 Moldova
|
39.6 |
2328600
|
19.5% | 63.6% | 17.2% | 1.73 |
| 53 |
 Palau
Palau
|
39.5 |
17620
|
17.9% | 70.2% | 12.1% | 1.88 |
| 54 |
 United States
|
39.5 |
344434632
|
17.1% | 64.5% | 18.6% | 1.63 |
| 55 |
 Australia
|
39.3 |
28010980
|
17.7% | 64.2% | 18.3% | 1.48 |
| 56 |
 Mauritius
|
38.9 |
1240721
|
14.5% | 71.3% | 14.4% | 1.44 |
| 57 |
 New Zealand
|
38.8 |
5380024
|
17.9% | 64.5% | 17.8% | 1.57 |
| 58 |
 Trinidad
|
38.6 |
1370916
|
17.5% | 69.6% | 13.2% | 1.54 |
| 59 |
 Albania
|
38.4 |
2332078
|
16.6% | 65.8% | 18% | 1.34 |
| 60 |
 Georgia
|
38.3 |
3934050
|
20.5% | 63.5% | 16.2% | 1.8 |
| 61 |
 Chile
Chile
|
38 |
19992079
|
16.5% | 68.9% | 14.8% | 1.14 |
| 62 |
 Armenia
|
37.7 |
3064036
|
19% | 66.6% | 14.8% | 1.7 |
| 63 |
 North Korea
|
37.6 |
26668308
|
18.9% | 68.4% | 12.9% | 1.78 |
| 64 |
 Uruguay
|
37.5 |
3382672
|
17.9% | 65.8% | 16.4% | 1.4 |
| 65 |
 Iceland
|
37.4 |
398674
|
17.5% | 66.5% | 16.1% | 1.56 |
| 66 |
 Singapore
|
37.4 |
6167445
|
11.7% | 74.1% | 14.5% | 0.97 |
| 67 |
 Dominica
|
37.3 |
65501
|
17.6% | 69.2% | 13.3% | 1.48 |
| 68 |
 Antigua
|
37.3 |
94846
|
17.5% | 70.2% | 12.6% | 1.58 |
| 69 |
 Saint Kitts
|
37.1 |
47031
|
18.3% | 69.9% | 12% | 1.53 |
| 70 |
 Bahamas
|
36.4 |
405486
|
17.5% | 70.4% | 12.3% | 1.37 |
| 71 |
 Costa Rica
|
36.2 |
5186356
|
18.3% | 68.9% | 13% | 1.32 |
| 72 |
 Brazil
|
35.8 |
213964342
|
19.4% | 69.1% | 11.7% | 1.61 |
| 73 |
 Kuwait
|
35.8 |
4981316
|
18% | 78.9% | 3.21% | 1.56 |
| 74 |
 Saint Lucia
|
35.7 |
180676
|
17.2% | 72.8% | 10.1% | 1.39 |
| 75 |
 Saint Vincent
|
35.4 |
99243
|
20.9% | 66.9% | 12.4% | 1.76 |
| 76 |
 Grenada
|
35.4 |
117405
|
19% | 68.4% | 12.8% | 1.47 |
| 77 |
 Seychelles
|
35.3 |
125859
|
19.8% | 71.5% | 8.85% | 1.85 |
| 78 |
 Iran
Iran
|
35 |
93580141
|
22% | 69.4% | 8.76% | 1.68 |
| 79 |
 Azerbaijan
|
34.6 |
10333222
|
21.2% | 69.6% | 9.49% | 1.43 |
| 80 |
 Turkey
|
34.5 |
86225430
|
21% | 68.4% | 10.7% | 1.48 |
| 81 |
 Qatar
Qatar
|
34.5 |
3058826
|
15% | 83.3% | 1.72% | 1.72 |
| 82 |
 Sri Lanka
|
34.4 |
21926160
|
21.7% | 65.8% | 12.7% | 1.95 |
| 83 |
 Vietnam
|
34.4 |
102486146
|
22.9% | 67.6% | 9.72% | 1.9 |
| 84 |
 Bahrain
|
34.3 |
1649267
|
18.4% | 77.6% | 4.1% | 1.81 |
| 85 |
 Argentina
|
33.9 |
46083022
|
21% | 66.3% | 12.7% | 1.5 |
| 86 |
 Tunisia
|
33.9 |
12450912
|
23.6% | 66.5% | 10.1% | 1.82 |
| 87 |
 Jamaica
|
33.8 |
2834177
|
18.3% | 73.1% | 8.77% | 1.35 |
| 88 |
 Brunei
|
33.7 |
471596
|
20.6% | 72.1% | 7.43% | 1.73 |
| 89 |
 Maldives
|
33.6 |
532468
|
19% | 76% | 5.12% | 1.56 |
| 90 |
 Colombia
|
33.5 |
54209462
|
20% | 69.8% | 10.4% | 1.63 |
| 91 |
 UAE
UAE
|
32.6 |
11885001
|
16% | 82.2% | 1.81% | 1.21 |
| 92 |
 Malaysia
|
31.9 |
36600906
|
21.3% | 70.7% | 8.18% | 1.54 |
| 93 |
 Bhutan
|
31.4 |
805057
|
20.4% | 73% | 6.7% | 1.45 |
| 94 |
 Indonesia
|
31.4 |
289027659
|
24.2% | 68.2% | 7.67% | 2.12 |
| 95 |
 Panama
|
31.3 |
4654479
|
24.5% | 65.8% | 9.81% | 2.11 |
| 96 |
 Peru
Peru
|
31.2 |
35105331
|
23.6% | 66.9% | 9.59% | 1.97 |
| 97 |
 Myanmar
|
31.1 |
55361818
|
24.1% | 68.4% | 7.63% | 2.1 |
| 98 |
 Morocco
|
30.8 |
38938817
|
25.2% | 66.4% | 8.61% | 2.21 |
| 99 |
 Oman
Oman
|
30.6 |
5775345
|
24.3% | 73% | 2.73% | 2.51 |
| 100 |
 Mexico
|
30.6 |
133551566
|
24.1% | 67.4% | 8.66% | 1.89 |
| 101 |
 Kazakhstan
|
30.6 |
21211812
|
29.1% | 61.9% | 9.17% | 2.98 |
| 102 |
 Saudi Arabia
|
30.6 |
37955120
|
23.6% | 73.3% | 3.11% | 2.31 |
| 103 |
 Venezuela
|
30.4 |
28692435
|
24.9% | 65.1% | 10.2% | 2.08 |
| 104 |
 Ecuador
|
30.3 |
18524711
|
23.9% | 67.5% | 8.72% | 1.81 |
| 105 |
 Israel
|
30.2 |
10334048
|
27.2% | 60.1% | 12.8% | 2.87 |
| 106 |
 Cape Verde
|
30 |
530853
|
24.7% | 68.2% | 7.3% | 1.51 |
| 107 |
 India
India
|
29.8 |
1483314140
|
24.2% | 68.4% | 7.49% | 1.96 |
| 108 |
 Lebanon
|
29.8 |
5921719
|
25.6% | 64% | 10.6% | 2.23 |
| 109 |
 South Africa
|
29.7 |
65829368
|
25.7% | 67.4% | 6.98% | 2.21 |
| 110 |
 Suriname
|
29.6 |
648096
|
25.3% | 66.5% | 8.34% | 2.23 |
| 111 |
 Algeria
|
29.6 |
48345858
|
29.9% | 63.3% | 6.92% | 2.72 |
| 112 |
 Dominican Republic
|
29.3 |
11656588
|
26.2% | 65.6% | 8.34% | 2.22 |
| 113 |
 Fiji
Fiji
|
29.1 |
939479
|
26.8% | 66.5% | 6.71% | 2.27 |
| 114 |
 El Salvador
|
28.9 |
6404781
|
24.4% | 67.3% | 8.39% | 1.77 |
| 115 |
 Libya
Libya
|
28.8 |
7580693
|
26.8% | 68% | 5.29% | 2.3 |
| 116 |
 Paraguay
|
28 |
7138671
|
28.4% | 64.9% | 6.81% | 2.42 |
| 117 |
 Uzbekistan
|
27.9 |
38082870
|
31.3% | 62.6% | 6.18% | 3.49 |
| 118 |
 Belize
|
27.9 |
431659
|
26.3% | 68.5% | 5.33% | 2.02 |
| 119 |
 Mongolia
|
27.9 |
3630744
|
31.6% | 63% | 5.58% | 2.5 |
| 120 |
 Turkmenistan
|
27.8 |
7800189
|
31.2% | 64% | 4.95% | 2.66 |
| 121 |
 Guyana
|
27.2 |
843423
|
28.9% | 64.1% | 7.1% | 2.4 |
| 122 |
 Cambodia
|
27.2 |
18159213
|
29.5% | 64.1% | 6.49% | 2.55 |
| 123 |
 Philippines
|
27.2 |
118213646
|
27.1% | 67.1% | 5.84% | 1.89 |
| 124 |
 Nicaragua
|
27 |
7144725
|
28.3% | 66% | 5.78% | 2.21 |
| 125 |
 Bangladesh
|
27 |
178936470
|
27.6% | 65.7% | 6.75% | 2.14 |
| 126 |
 Nepal
Nepal
|
26.4 |
29619950
|
28.1% | 65.3% | 6.69% | 1.96 |
| 127 |
 Kyrgyzstan
|
26.3 |
7505771
|
31.9% | 62.1% | 6.12% | 2.6 |
| 128 |
 Bolivia
|
26.2 |
12837312
|
29.4% | 64.8% | 5.79% | 2.52 |
| 129 |
 Laos
Laos
|
26 |
8027464
|
29.8% | 65.4% | 4.88% | 2.4 |
| 130 |
 Djibouti
|
26 |
1207325
|
28.8% | 66.2% | 5.03% | 2.62 |
| 131 |
 Jordan
|
25.7 |
11538682
|
30.2% | 65.1% | 4.88% | 2.6 |
| 132 |
 Egypt
Egypt
|
25.5 |
121012163
|
31.6% | 63.2% | 5.35% | 2.74 |
| 133 |
 Honduras
|
25.2 |
11279259
|
30.3% | 65.2% | 4.6% | 2.48 |
| 134 |
 Tuvalu
|
25.2 |
9349
|
33% | 59.9% | 7.27% | 3.17 |
| 135 |
 Haiti
Haiti
|
25.1 |
12106577
|
30.8% | 64.4% | 4.83% | 2.63 |
| 136 |
 Botswana
|
24.5 |
2624853
|
32% | 64% | 4.11% | 2.7 |
| 137 |
 Guatemala
|
24.4 |
19115361
|
31% | 64% | 5.02% | 2.29 |
| 138 |
 Syria
Syria
|
24.3 |
26956472
|
28.4% | 66.7% | 4.89% | 2.7 |
| 139 |
 Kiribati
|
23.9 |
139471
|
34.4% | 61.3% | 4.45% | 3.12 |
| 140 |
 Papua New Guinea
|
23.8 |
11045681
|
33.1% | 63.3% | 3.65% | 3.07 |
| 141 |
 Eswatini
|
23.5 |
1276995
|
33% | 62.7% | 4.38% | 2.72 |
| 142 |
 Tajikistan
|
23.2 |
11080415
|
35.9% | 60.1% | 4.18% | 3.04 |
| 143 |
 Lesotho
|
22.9 |
2402837
|
34.1% | 62% | 3.89% | 2.66 |
| 144 |
 East Timor
|
22.8 |
1446322
|
33.1% | 61.7% | 5.21% | 2.63 |
| 145 |
 Gabon
Gabon
|
22.6 |
2676097
|
36.2% | 59.6% | 4.16% | 3.59 |
| 146 |
 Ghana
Ghana
|
22.4 |
36032857
|
35.4% | 60.8% | 3.83% | 3.34 |
| 147 |
 Namibia
|
22.4 |
3185686
|
36.7% | 59.6% | 3.85% | 3.21 |
| 148 |
 Equatorial Guinea
|
22 |
2008950
|
37.1% | 59.1% | 3.81% | 4.12 |
| 149 |
 Tonga
Tonga
|
22 |
103283
|
34.9% | 58.2% | 6.93% | 3.1 |
| 150 |
 Iraq
Iraq
|
21.9 |
48531417
|
36% | 60.5% | 3.47% | 3.22 |
| 151 |
 Marshall Islands
|
21.8 |
35039
|
33.9% | 61.2% | 4.99% | 2.86 |
| 152 |
 Solomon Islands
|
21.8 |
868694
|
36.6% | 59.8% | 3.69% | 3.51 |
| 153 |
 Comoros
|
21.7 |
907554
|
36.9% | 58.7% | 4.45% | 3.82 |
| 154 |
 Pakistan
|
21.6 |
261421997
|
36.2% | 59.4% | 4.4% | 3.55 |
| 155 |
 Nauru
Nauru
|
21.3 |
12139
|
37.2% | 59.8% | 3.1% | 3.29 |
| 156 |
 Vanuatu
|
21.3 |
346488
|
38% | 57.7% | 4.42% | 3.57 |
| 157 |
 Palestine
|
21.1 |
5563879
|
37.6% | 58.6% | 3.88% | 3.25 |
| 158 |
 Kenya
Kenya
|
21.1 |
59218766
|
36.3% | 60.7% | 3.05% | 3.17 |
| 159 |
 Rwanda
|
21 |
15062056
|
37% | 59% | 4.07% | 3.65 |
| 160 |
 Samoa
Samoa
|
20.9 |
221158
|
38.1% | 55.9% | 6.16% | 3.8 |
| 161 |
 Sierra Leone
|
20.7 |
9090531
|
37.7% | 59.1% | 3.31% | 3.7 |
| 162 |
 Senegal
|
20.6 |
19596169
|
37.7% | 58.6% | 3.66% | 3.77 |
| 163 |
 Sao Tome
|
20.5 |
247495
|
37.5% | 58.6% | 3.97% | 3.6 |
| 164 |
 Guinea-Bissau
|
20.4 |
2323460
|
38.3% | 58.4% | 3.26% | 3.76 |
| 165 |
 Eritrea
|
20.2 |
3722489
|
37.6% | 58.2% | 4.28% | 3.68 |
| 166 |
 Madagascar
|
20.2 |
33936132
|
38.9% | 57.6% | 3.51% | 3.91 |
| 167 |
 Ethiopia
|
20.1 |
140722974
|
38.8% | 57.9% | 3.33% | 3.91 |
| 168 |
 Liberia
|
19.8 |
5916561
|
39.1% | 57.6% | 3.35% | 3.86 |
| 169 |
 South Sudan
|
19.7 |
12565048
|
38% | 58.9% | 3.12% | 3.79 |
| 170 |
 Gambia
|
19.6 |
2916990
|
39.7% | 57.1% | 3.24% | 3.91 |
| 171 |
 Congo
Congo
|
19.6 |
6718789
|
39.9% | 57% | 3.1% | 4.11 |
| 172 |
 Sudan
Sudan
|
19.6 |
54156832
|
40.2% | 56.4% | 3.43% | 4.26 |
| 173 |
 Ivory Coast
|
19.4 |
33910252
|
40.5% | 56.9% | 2.68% | 4.23 |
| 174 |
 Yemen
Yemen
|
19.4 |
43598646
|
41% | 56.4% | 2.56% | 4.5 |
| 175 |
 Togo
Togo
|
19.4 |
8873660
|
40.4% | 56.1% | 3.29% | 4.12 |
| 176 |
 Guinea
|
19.3 |
15624314
|
40.5% | 56% | 3.48% | 4.13 |
| 177 |
 Zimbabwe
|
19.2 |
17443108
|
40.3% | 56.2% | 3.54% | 3.67 |
| 178 |
 Nigeria
|
19.2 |
245016045
|
40.5% | 56.4% | 3.08% | 4.38 |
| 179 |
 Malawi
|
19.2 |
23086106
|
40.1% | 57.3% | 2.59% | 3.59 |
| 180 |
 Cameroon
|
19.1 |
31045453
|
41.1% | 56.1% | 2.83% | 4.26 |
| 181 |
 Benin
Benin
|
19.1 |
15358725
|
41.3% | 55.6% | 3.17% | 4.48 |
| 182 |
 Zambia
|
19 |
22844606
|
41% | 57% | 2.03% | 4.04 |
| 183 |
 Burkina Faso
|
18.8 |
24880655
|
41.2% | 56.1% | 2.7% | 4.11 |
| 184 |
 Tanzania
|
18.5 |
73639263
|
42.3% | 54.6% | 3.04% | 4.54 |
| 185 |
 Mauritania
|
18.5 |
5539189
|
42.4% | 54.4% | 3.26% | 4.63 |
| 186 |
 Afghanistan
|
18.3 |
45682388
|
42.6% | 55% | 2.44% | 4.76 |
| 187 |
 Uganda
|
18 |
53495325
|
43.1% | 54.7% | 2.25% | 4.17 |
| 188 |
 Angola
|
17.8 |
40839390
|
44.1% | 53% | 2.92% | 5.05 |
| 189 |
 Mozambique
|
17.7 |
37173146
|
44.2% | 53.1% | 2.72% | 4.69 |
| 190 |
 Burundi
|
17.5 |
14909238
|
44% | 53.5% | 2.56% | 4.79 |
| 191 |
 DR Congo
|
16.9 |
118386491
|
45.9% | 51% | 3.09% | 5.98 |
| 192 |
 Chad
Chad
|
16.9 |
21855137
|
46% | 51.9% | 2.12% | 6.03 |
| 193 |
 Mali
Mali
|
16.8 |
26322576
|
45.8% | 51.8% | 2.35% | 5.51 |
| 194 |
 Niger
Niger
|
16.7 |
29294628
|
46.2% | 51.2% | 2.63% | 5.94 |
| 195 |
 Somalia
|
16.6 |
20653532
|
46.6% | 50.8% | 2.63% | 6.01 |
| 196 |
 CAR
CAR
|
15.5 |
5798457
|
48.7% | 49.1% | 2.22% | 5.95 |
Median age by country map
Data sources: World Bank | Health (1960–2025, retrieved 2026-07-08); U.S. Census Bureau (1960–2025, retrieved 2026-07-08); National Statistics, Taiwan (1974–2025, retrieved 2026-07-08).
GeoRank.org/demographics | CC BY 
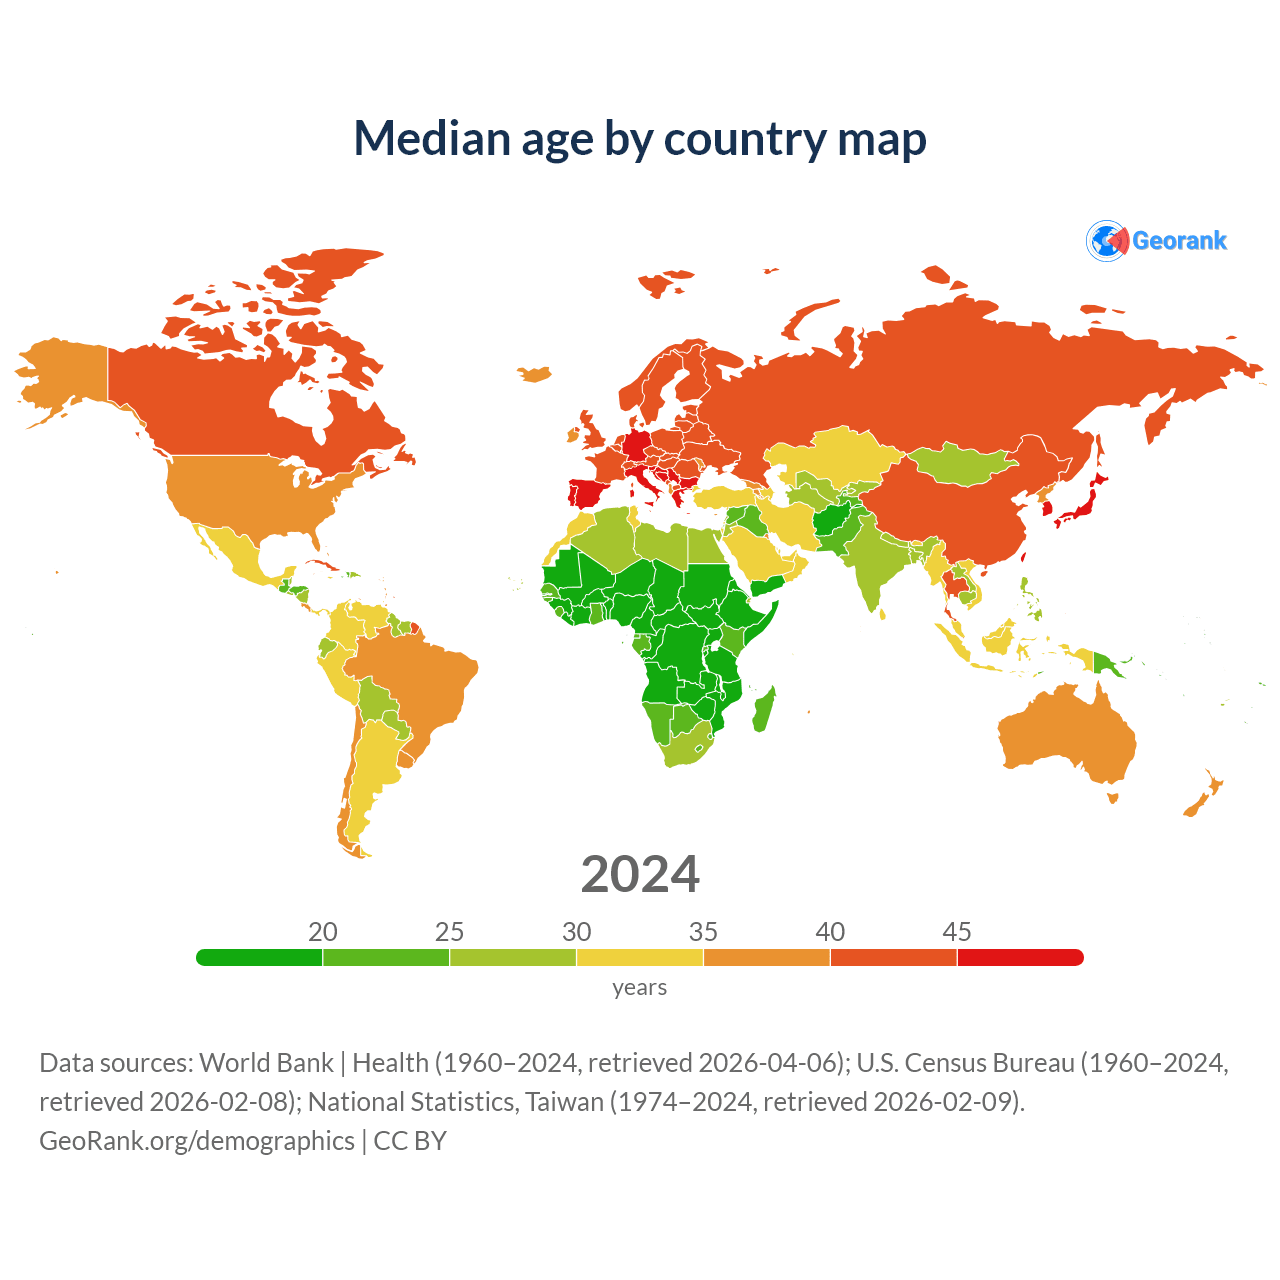
This world map presents the median age by country and how it's distributed across regions.
While the world's median age is 31.8, there are notable regional variations: Europe has the highest at 43.9; North America's is 39.7; Oceania, Asia, and Latin America are around 33.7 years; while Africa has the youngest median age at 20.8.
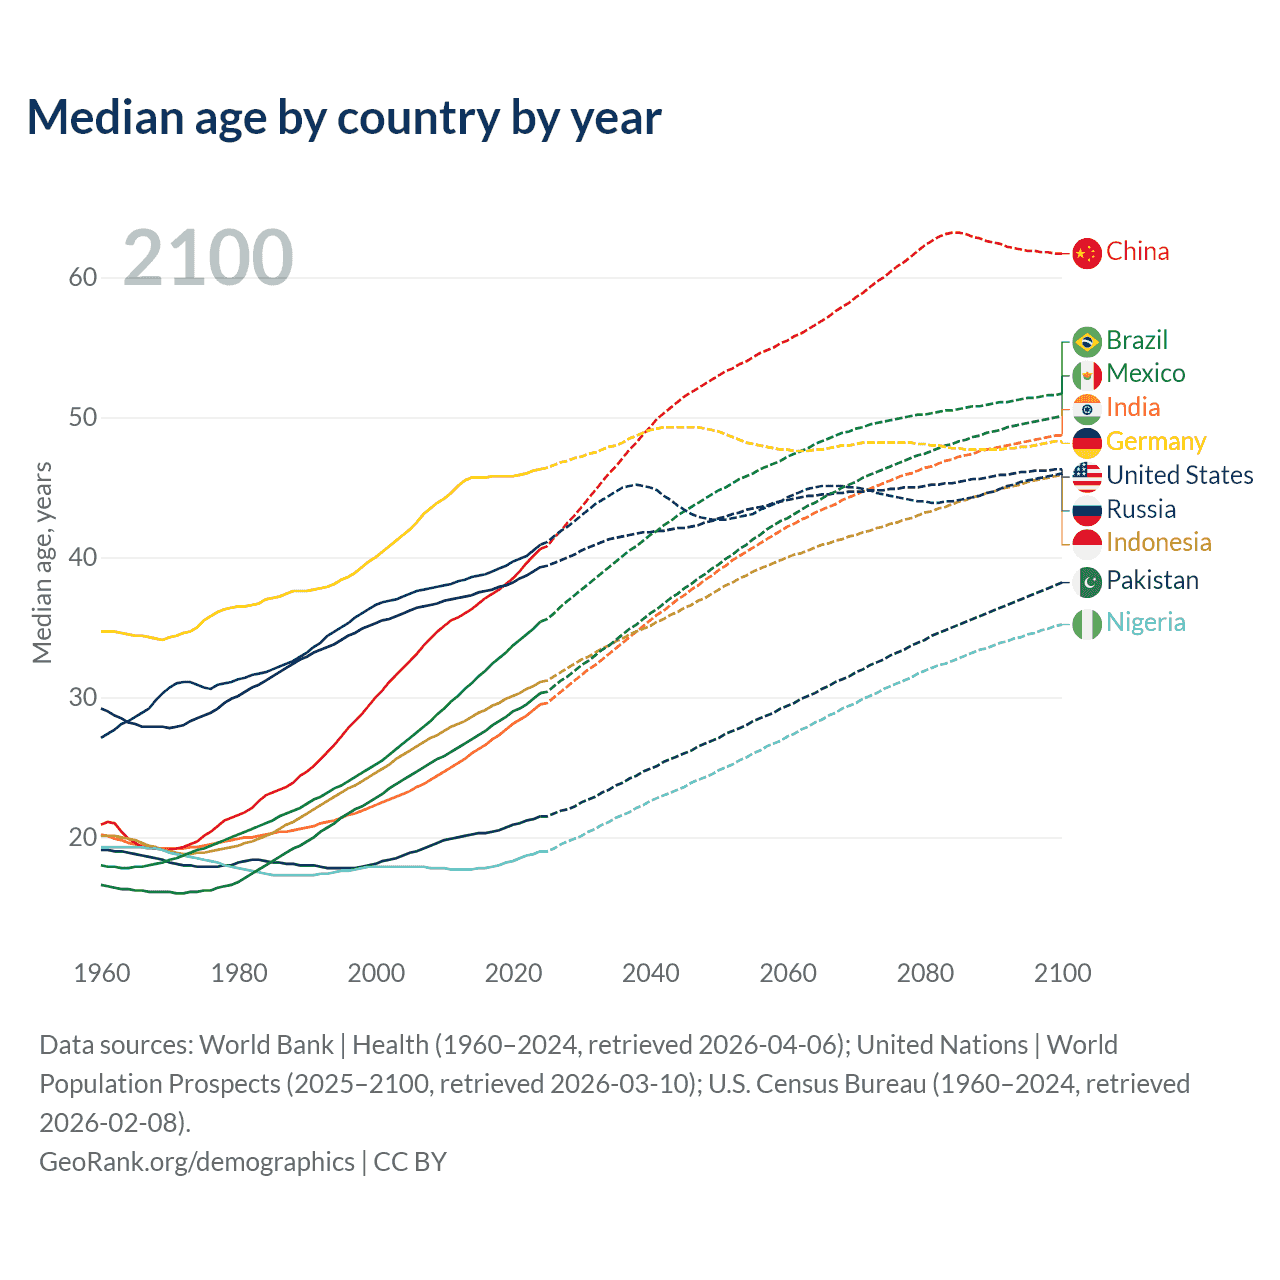
Median age by country by year
| Year | Median age, years | |||||||||
|---|---|---|---|---|---|---|---|---|---|---|
| India | China | United States | Indonesia | Pakistan | Nigeria | Brazil | Russia | Mexico | Germany | |
| 2100 | 48.7 | 61.7 | 46.3 | 45.9 | 38.2 | 35.2 | 51.7 | 46 | 50.1 | 48.3 |
| 2099 | 48.7 | 61.7 | 46.3 | 45.8 | 38 | 35.1 | 51.6 | 45.9 | 50 | 48.3 |
| 2098 | 48.6 | 61.8 | 46.2 | 45.7 | 37.8 | 34.9 | 51.6 | 45.8 | 49.9 | 48.2 |
| 2097 | 48.5 | 61.8 | 46.2 | 45.6 | 37.6 | 34.8 | 51.5 | 45.7 | 49.8 | 48.1 |
| 2096 | 48.4 | 61.9 | 46.2 | 45.5 | 37.4 | 34.6 | 51.4 | 45.6 | 49.7 | 48 |
| 2095 | 48.3 | 61.9 | 46.1 | 45.4 | 37.2 | 34.5 | 51.4 | 45.5 | 49.6 | 47.9 |
| 2094 | 48.2 | 62 | 46.1 | 45.2 | 37 | 34.3 | 51.3 | 45.4 | 49.5 | 47.9 |
| 2093 | 48.1 | 62.1 | 46 | 45.1 | 36.8 | 34.2 | 51.2 | 45.2 | 49.4 | 47.8 |
| 2092 | 48 | 62.2 | 45.9 | 45 | 36.6 | 34 | 51.1 | 45.1 | 49.3 | 47.8 |
| 2091 | 47.9 | 62.4 | 45.9 | 44.9 | 36.4 | 33.9 | 51.1 | 44.9 | 49.1 | 47.7 |
| 2090 | 47.8 | 62.5 | 45.8 | 44.7 | 36.2 | 33.7 | 51 | 44.7 | 49 | 47.7 |
| 2089 | 47.7 | 62.6 | 45.7 | 44.6 | 36 | 33.5 | 50.9 | 44.6 | 48.9 | 47.7 |
| 2088 | 47.6 | 62.8 | 45.6 | 44.4 | 35.8 | 33.4 | 50.8 | 44.4 | 48.7 | 47.7 |
| 2087 | 47.4 | 62.9 | 45.6 | 44.3 | 35.6 | 33.2 | 50.8 | 44.3 | 48.6 | 47.7 |
| 2086 | 47.3 | 63.1 | 45.5 | 44.1 | 35.4 | 33 | 50.7 | 44.2 | 48.4 | 47.7 |
| 2085 | 47.2 | 63.2 | 45.4 | 44 | 35.2 | 32.8 | 50.6 | 44.1 | 48.3 | 47.8 |
| 2084 | 47 | 63.2 | 45.3 | 43.8 | 35 | 32.6 | 50.5 | 44 | 48.1 | 47.8 |
| 2083 | 46.9 | 63.1 | 45.3 | 43.6 | 34.8 | 32.4 | 50.5 | 44 | 48 | 47.9 |
| 2082 | 46.7 | 62.9 | 45.2 | 43.5 | 34.6 | 32.3 | 50.4 | 43.9 | 47.8 | 48 |
| 2081 | 46.5 | 62.6 | 45.2 | 43.3 | 34.4 | 32.1 | 50.3 | 43.9 | 47.6 | 48 |
| 2080 | 46.4 | 62.3 | 45.1 | 43.2 | 34.1 | 31.9 | 50.2 | 44 | 47.4 | 48.1 |
| 2079 | 46.2 | 61.9 | 45 | 43 | 33.9 | 31.7 | 50.2 | 44 | 47.3 | 48.1 |
| 2078 | 46 | 61.5 | 45 | 42.8 | 33.7 | 31.4 | 50.1 | 44.1 | 47.1 | 48.2 |
| 2077 | 45.9 | 61.1 | 45 | 42.7 | 33.4 | 31.2 | 50 | 44.2 | 46.9 | 48.2 |
| 2076 | 45.7 | 60.8 | 44.9 | 42.5 | 33.2 | 31 | 49.9 | 44.3 | 46.7 | 48.2 |
| 2075 | 45.5 | 60.4 | 44.9 | 42.4 | 33 | 30.8 | 49.8 | 44.4 | 46.5 | 48.2 |
| 2074 | 45.3 | 60 | 44.8 | 42.2 | 32.7 | 30.6 | 49.7 | 44.5 | 46.3 | 48.2 |
| 2073 | 45.1 | 59.7 | 44.8 | 42.1 | 32.5 | 30.3 | 49.6 | 44.6 | 46.1 | 48.2 |
| 2072 | 44.9 | 59.3 | 44.8 | 41.9 | 32.3 | 30.1 | 49.5 | 44.8 | 45.9 | 48.2 |
| 2071 | 44.7 | 58.9 | 44.7 | 41.8 | 32 | 29.9 | 49.3 | 44.9 | 45.7 | 48.2 |
| 2070 | 44.5 | 58.6 | 44.7 | 41.6 | 31.8 | 29.6 | 49.2 | 45 | 45.4 | 48.1 |
| 2069 | 44.3 | 58.2 | 44.7 | 41.5 | 31.5 | 29.4 | 49 | 45 | 45.2 | 48 |
| 2068 | 44.1 | 57.9 | 44.6 | 41.3 | 31.3 | 29.2 | 48.9 | 45.1 | 45 | 48 |
| 2067 | 43.8 | 57.6 | 44.6 | 41.2 | 31.1 | 28.9 | 48.7 | 45.1 | 44.7 | 47.9 |
| 2066 | 43.6 | 57.2 | 44.5 | 41 | 30.8 | 28.7 | 48.5 | 45.1 | 44.5 | 47.8 |
| 2065 | 43.4 | 56.9 | 44.5 | 40.9 | 30.6 | 28.4 | 48.3 | 45.1 | 44.2 | 47.7 |
| 2064 | 43.2 | 56.6 | 44.4 | 40.7 | 30.3 | 28.2 | 48.1 | 45 | 43.9 | 47.7 |
| 2063 | 42.9 | 56.3 | 44.4 | 40.5 | 30.1 | 27.9 | 47.8 | 44.9 | 43.7 | 47.6 |
| 2062 | 42.7 | 56 | 44.3 | 40.3 | 29.9 | 27.7 | 47.6 | 44.7 | 43.4 | 47.6 |
| 2061 | 42.4 | 55.8 | 44.2 | 40.2 | 29.6 | 27.4 | 47.4 | 44.5 | 43.1 | 47.6 |
| 2060 | 42.2 | 55.5 | 44.1 | 40 | 29.4 | 27.2 | 47.2 | 44.3 | 42.8 | 47.7 |
| 2059 | 41.9 | 55.3 | 44 | 39.8 | 29.2 | 26.9 | 46.9 | 44 | 42.6 | 47.7 |
| 2058 | 41.6 | 55 | 43.9 | 39.6 | 28.9 | 26.7 | 46.7 | 43.8 | 42.3 | 47.8 |
| 2057 | 41.3 | 54.8 | 43.7 | 39.4 | 28.7 | 26.5 | 46.5 | 43.6 | 42 | 47.9 |
| 2056 | 41 | 54.6 | 43.6 | 39.2 | 28.5 | 26.2 | 46.3 | 43.4 | 41.6 | 48 |
| 2055 | 40.7 | 54.3 | 43.5 | 39 | 28.3 | 26 | 46 | 43.1 | 41.3 | 48.1 |
| 2054 | 40.4 | 54 | 43.4 | 38.7 | 28 | 25.7 | 45.8 | 43 | 40.9 | 48.2 |
| 2053 | 40.1 | 53.8 | 43.2 | 38.5 | 27.8 | 25.5 | 45.6 | 42.9 | 40.6 | 48.4 |
| 2052 | 39.8 | 53.5 | 43.1 | 38.2 | 27.6 | 25.2 | 45.3 | 42.8 | 40.2 | 48.6 |
| 2051 | 39.4 | 53.3 | 42.9 | 38 | 27.4 | 25 | 45 | 42.7 | 39.9 | 48.8 |
| 2050 | 39.1 | 53 | 42.8 | 37.7 | 27.1 | 24.8 | 44.8 | 42.7 | 39.5 | 49 |
| 2049 | 38.7 | 52.7 | 42.6 | 37.4 | 26.9 | 24.5 | 44.5 | 42.7 | 39.2 | 49.1 |
| 2048 | 38.4 | 52.4 | 42.5 | 37.1 | 26.7 | 24.3 | 44.2 | 42.8 | 38.8 | 49.2 |
| 2047 | 38 | 52.1 | 42.3 | 36.9 | 26.5 | 24.1 | 43.9 | 42.9 | 38.5 | 49.3 |
| 2046 | 37.7 | 51.8 | 42.2 | 36.6 | 26.2 | 23.9 | 43.6 | 43.1 | 38.1 | 49.3 |
| 2045 | 37.3 | 51.5 | 42.1 | 36.4 | 26 | 23.6 | 43.3 | 43.4 | 37.8 | 49.3 |
| 2044 | 37 | 51.1 | 42.1 | 36.1 | 25.8 | 23.4 | 43 | 43.7 | 37.4 | 49.3 |
| 2043 | 36.6 | 50.7 | 42 | 35.9 | 25.6 | 23.2 | 42.6 | 44.1 | 37.1 | 49.3 |
| 2042 | 36.2 | 50.3 | 41.9 | 35.6 | 25.4 | 23 | 42.3 | 44.4 | 36.7 | 49.3 |
| 2041 | 35.9 | 49.9 | 41.9 | 35.4 | 25.1 | 22.8 | 41.9 | 44.8 | 36.3 | 49.2 |
| 2040 | 35.5 | 49.3 | 41.8 | 35.1 | 24.9 | 22.6 | 41.6 | 45 | 36 | 49.1 |
| 2039 | 35.1 | 48.8 | 41.8 | 34.9 | 24.7 | 22.3 | 41.2 | 45.1 | 35.6 | 48.9 |
| 2038 | 34.7 | 48.2 | 41.7 | 34.7 | 24.4 | 22.1 | 40.8 | 45.2 | 35.2 | 48.7 |
| 2037 | 34.3 | 47.7 | 41.6 | 34.5 | 24.2 | 21.8 | 40.5 | 45.1 | 34.9 | 48.5 |
| 2036 | 33.9 | 47.1 | 41.5 | 34.2 | 23.9 | 21.6 | 40.1 | 45 | 34.5 | 48.2 |
| 2035 | 33.5 | 46.5 | 41.4 | 34 | 23.7 | 21.4 | 39.7 | 44.7 | 34.1 | 48 |
| 2034 | 33.1 | 46 | 41.3 | 33.7 | 23.4 | 21.1 | 39.3 | 44.4 | 33.7 | 47.9 |
| 2033 | 32.7 | 45.4 | 41.1 | 33.5 | 23.2 | 20.9 | 38.9 | 44.1 | 33.4 | 47.7 |
| 2032 | 32.3 | 44.8 | 40.9 | 33.2 | 22.9 | 20.6 | 38.5 | 43.8 | 33 | 47.5 |
| 2031 | 32 | 44.2 | 40.7 | 32.9 | 22.7 | 20.4 | 38.1 | 43.4 | 32.6 | 47.4 |
| 2030 | 31.6 | 43.6 | 40.5 | 32.7 | 22.5 | 20.1 | 37.7 | 43 | 32.3 | 47.2 |
| 2029 | 31.2 | 43 | 40.2 | 32.4 | 22.2 | 19.9 | 37.3 | 42.6 | 31.9 | 47.1 |
| 2028 | 30.8 | 42.5 | 40 | 32.1 | 22 | 19.7 | 36.9 | 42.2 | 31.5 | 46.9 |
| 2027 | 30.4 | 41.9 | 39.8 | 31.8 | 21.9 | 19.5 | 36.5 | 41.9 | 31.2 | 46.8 |
| 2026 | 30 | 41.4 | 39.6 | 31.5 | 21.7 | 19.2 | 36 | 41.5 | 30.8 | 46.6 |
| 2025 | 29.8 | 41.1 | 39.5 | 31.4 | 21.6 | 19.2 | 35.8 | 41.4 | 30.6 | 46.5 |
| 2024 | 29.5 | 40.6 | 39.3 | 31.1 | 21.5 | 19 | 35.4 | 40.9 | 30.3 | 46.3 |
| 2023 | 29.1 | 40.1 | 39 | 30.8 | 21.3 | 18.8 | 34.9 | 40.5 | 29.9 | 46.2 |
| 2022 | 28.7 | 39.6 | 38.7 | 30.6 | 21.2 | 18.7 | 34.5 | 40.1 | 29.5 | 46 |
| 2021 | 28.4 | 39 | 38.5 | 30.3 | 21 | 18.5 | 34.1 | 39.9 | 29.2 | 45.9 |
| 2020 | 28.1 | 38.5 | 38.2 | 30.1 | 20.9 | 18.3 | 33.7 | 39.7 | 29 | 45.8 |
| 2019 | 27.7 | 38.1 | 38 | 29.9 | 20.7 | 18.2 | 33.2 | 39.4 | 28.6 | 45.8 |
| 2018 | 27.3 | 37.7 | 37.9 | 29.6 | 20.5 | 18 | 32.8 | 39.2 | 28.3 | 45.8 |
| 2017 | 27 | 37.4 | 37.7 | 29.4 | 20.4 | 17.9 | 32.4 | 39 | 28 | 45.8 |
| 2016 | 26.6 | 37.1 | 37.6 | 29.1 | 20.3 | 17.8 | 31.9 | 38.8 | 27.6 | 45.7 |
| 2015 | 26.3 | 36.7 | 37.5 | 28.9 | 20.3 | 17.8 | 31.5 | 38.7 | 27.3 | 45.7 |
| 2014 | 26 | 36.3 | 37.3 | 28.6 | 20.2 | 17.7 | 31 | 38.6 | 27 | 45.7 |
| 2013 | 25.6 | 36 | 37.2 | 28.3 | 20.1 | 17.7 | 30.6 | 38.4 | 26.7 | 45.5 |
| 2012 | 25.3 | 35.7 | 37.1 | 28.1 | 20 | 17.7 | 30.1 | 38.3 | 26.4 | 45.1 |
| 2011 | 25 | 35.5 | 37 | 27.9 | 19.9 | 17.7 | 29.7 | 38.1 | 26.1 | 44.6 |
| 2010 | 24.7 | 35.1 | 36.9 | 27.6 | 19.8 | 17.8 | 29.2 | 38 | 25.8 | 44.2 |
| 2009 | 24.4 | 34.7 | 36.7 | 27.3 | 19.6 | 17.8 | 28.8 | 37.9 | 25.6 | 43.9 |
| 2008 | 24.1 | 34.2 | 36.6 | 27.1 | 19.4 | 17.8 | 28.3 | 37.8 | 25.3 | 43.5 |
| 2007 | 23.8 | 33.7 | 36.5 | 26.8 | 19.2 | 17.9 | 27.9 | 37.7 | 25 | 43.1 |
| 2006 | 23.6 | 33.1 | 36.4 | 26.5 | 19 | 17.9 | 27.5 | 37.6 | 24.7 | 42.5 |
| 2005 | 23.3 | 32.6 | 36.2 | 26.2 | 18.9 | 17.9 | 27.1 | 37.4 | 24.4 | 42 |
| 2004 | 23.1 | 32.1 | 36 | 25.9 | 18.7 | 17.9 | 26.7 | 37.2 | 24.1 | 41.6 |
| 2003 | 22.9 | 31.6 | 35.8 | 25.6 | 18.5 | 17.9 | 26.3 | 37 | 23.8 | 41.2 |
| 2002 | 22.7 | 31.1 | 35.6 | 25.2 | 18.4 | 17.9 | 25.9 | 36.9 | 23.5 | 40.8 |
| 2001 | 22.5 | 30.5 | 35.5 | 24.9 | 18.3 | 17.9 | 25.5 | 36.8 | 23.1 | 40.4 |
| 2000 | 22.3 | 30 | 35.3 | 24.6 | 18.1 | 17.9 | 25.2 | 36.6 | 22.8 | 40 |
| 1999 | 22.1 | 29.4 | 35.1 | 24.3 | 18 | 17.9 | 24.9 | 36.3 | 22.5 | 39.7 |
| 1998 | 21.9 | 28.8 | 34.9 | 24 | 17.9 | 17.8 | 24.6 | 36 | 22.2 | 39.3 |
| 1997 | 21.7 | 28.3 | 34.6 | 23.7 | 17.8 | 17.7 | 24.3 | 35.7 | 22 | 38.9 |
| 1996 | 21.6 | 27.8 | 34.4 | 23.5 | 17.8 | 17.6 | 24 | 35.3 | 21.7 | 38.6 |
| 1995 | 21.4 | 27.2 | 34.1 | 23.2 | 17.8 | 17.6 | 23.7 | 35 | 21.4 | 38.4 |
| 1994 | 21.2 | 26.6 | 33.8 | 22.9 | 17.8 | 17.5 | 23.5 | 34.7 | 21 | 38.1 |
| 1993 | 21.1 | 26.1 | 33.6 | 22.6 | 17.8 | 17.4 | 23.2 | 34.4 | 20.7 | 37.9 |
| 1992 | 21 | 25.6 | 33.4 | 22.3 | 17.9 | 17.4 | 22.9 | 33.9 | 20.4 | 37.8 |
| 1991 | 20.8 | 25.1 | 33.2 | 22 | 18 | 17.3 | 22.7 | 33.6 | 20 | 37.7 |
| 1990 | 20.7 | 24.7 | 32.9 | 21.7 | 18 | 17.3 | 22.4 | 33.2 | 19.7 | 37.6 |
| 1989 | 20.6 | 24.4 | 32.7 | 21.4 | 18 | 17.3 | 22.1 | 32.9 | 19.4 | 37.6 |
| 1988 | 20.5 | 23.9 | 32.4 | 21.1 | 18.1 | 17.3 | 21.9 | 32.6 | 19.2 | 37.6 |
| 1987 | 20.4 | 23.6 | 32.1 | 20.9 | 18.1 | 17.3 | 21.7 | 32.4 | 18.9 | 37.4 |
| 1986 | 20.4 | 23.4 | 31.8 | 20.6 | 18.2 | 17.3 | 21.5 | 32.2 | 18.6 | 37.2 |
| 1985 | 20.3 | 23.2 | 31.5 | 20.3 | 18.2 | 17.3 | 21.2 | 32 | 18.3 | 37.1 |
| 1984 | 20.2 | 23 | 31.2 | 20.1 | 18.3 | 17.4 | 21 | 31.8 | 18 | 37 |
| 1983 | 20.1 | 22.6 | 30.9 | 19.9 | 18.4 | 17.5 | 20.8 | 31.7 | 17.7 | 36.7 |
| 1982 | 20 | 22.1 | 30.7 | 19.7 | 18.4 | 17.6 | 20.6 | 31.6 | 17.4 | 36.6 |
| 1981 | 20 | 21.8 | 30.4 | 19.6 | 18.3 | 17.7 | 20.4 | 31.4 | 17.1 | 36.5 |
| 1980 | 19.9 | 21.6 | 30.1 | 19.4 | 18.2 | 17.8 | 20.2 | 31.3 | 16.8 | 36.5 |
| 1979 | 19.8 | 21.4 | 29.9 | 19.3 | 18 | 17.9 | 20 | 31.1 | 16.6 | 36.4 |
| 1978 | 19.7 | 21.2 | 29.6 | 19.2 | 18 | 18 | 19.8 | 31 | 16.5 | 36.3 |
| 1977 | 19.6 | 20.8 | 29.2 | 19.1 | 17.9 | 18.2 | 19.6 | 30.9 | 16.4 | 36.1 |
| 1976 | 19.5 | 20.4 | 28.9 | 19 | 17.9 | 18.3 | 19.4 | 30.6 | 16.2 | 35.8 |
| 1975 | 19.4 | 20.1 | 28.7 | 18.9 | 17.9 | 18.4 | 19.2 | 30.7 | 16.2 | 35.5 |
| 1974 | 19.3 | 19.7 | 28.5 | 18.9 | 17.9 | 18.5 | 19.1 | 30.9 | 16.1 | 35 |
| 1973 | 19.3 | 19.5 | 28.3 | 18.8 | 18 | 18.6 | 18.9 | 31.1 | 16.1 | 34.7 |
| 1972 | 19.2 | 19.3 | 28 | 18.8 | 18 | 18.7 | 18.7 | 31.1 | 16 | 34.6 |
| 1971 | 19.2 | 19.2 | 27.9 | 18.9 | 18.1 | 18.8 | 18.5 | 31 | 16 | 34.4 |
| 1970 | 19.2 | 19.1 | 27.8 | 19 | 18.2 | 18.9 | 18.4 | 30.7 | 16.1 | 34.3 |
| 1969 | 19.2 | 19.1 | 27.9 | 19.1 | 18.4 | 19.1 | 18.2 | 30.3 | 16.1 | 34.1 |
| 1968 | 19.2 | 19.2 | 27.9 | 19.3 | 18.5 | 19.2 | 18.1 | 29.8 | 16.1 | 34.2 |
| 1967 | 19.3 | 19.2 | 27.9 | 19.4 | 18.6 | 19.2 | 18 | 29.2 | 16.1 | 34.3 |
| 1966 | 19.4 | 19.3 | 27.9 | 19.6 | 18.7 | 19.3 | 17.9 | 28.9 | 16.2 | 34.4 |
| 1965 | 19.5 | 19.6 | 28.1 | 19.8 | 18.8 | 19.3 | 17.9 | 28.6 | 16.2 | 34.4 |
| 1964 | 19.6 | 19.9 | 28.2 | 19.9 | 18.9 | 19.3 | 17.8 | 28.3 | 16.3 | 34.5 |
| 1963 | 19.8 | 20.4 | 28.5 | 20 | 19 | 19.3 | 17.8 | 28.1 | 16.3 | 34.6 |
| 1962 | 19.9 | 21 | 28.7 | 20.1 | 19 | 19.3 | 17.9 | 27.7 | 16.4 | 34.7 |
| 1961 | 20.1 | 21.1 | 29 | 20.1 | 19.1 | 19.3 | 17.9 | 27.4 | 16.5 | 34.7 |
| 1960 | 20.2 | 20.9 | 29.2 | 20.1 | 19.1 | 19.3 | 18 | 27.1 | 16.6 | 34.7 |
Data sources: World Bank | Health (1960–2025, retrieved 2026-07-08); United Nations | World Population Prospects (2026–2100, retrieved 2026-07-08); U.S. Census Bureau (1960–2025, retrieved 2026-07-08).
GeoRank.org/demographics | CC BY
Median age in 10 countries representative of their region, 2026 vs. 2050 projected:
Median age: world and by region, 1960–2100
| Year | Median age, years | ||||||
|---|---|---|---|---|---|---|---|
| World | Asia | Africa | Europe | Latin America | North America | Oceania | |
| 2100 | 43.1 | 51.7 | 37.2 | 50.3 | 50.7 | 46.5 | 44 |
| 2099 | 43 | 51.6 | 37 | 50.2 | 50.6 | 46.5 | 43.9 |
| 2098 | 42.9 | 51.6 | 36.8 | 50.2 | 50.5 | 46.4 | 43.8 |
| 2097 | 42.8 | 51.5 | 36.6 | 50.1 | 50.5 | 46.4 | 43.7 |
| 2096 | 42.7 | 51.4 | 36.4 | 50 | 50.4 | 46.4 | 43.6 |
| 2095 | 42.6 | 51.4 | 36.3 | 49.9 | 50.3 | 46.3 | 43.5 |
| 2094 | 42.5 | 51.3 | 36.1 | 49.8 | 50.2 | 46.3 | 43.4 |
| 2093 | 42.4 | 51.3 | 35.9 | 49.7 | 50.1 | 46.2 | 43.3 |
| 2092 | 42.3 | 51.2 | 35.7 | 49.6 | 50 | 46.1 | 43.2 |
| 2091 | 42.2 | 51.2 | 35.5 | 49.5 | 49.9 | 46.1 | 43.1 |
| 2090 | 42.1 | 51.1 | 35.3 | 49.5 | 49.8 | 46 | 43 |
| 2089 | 42 | 51.1 | 35.1 | 49.4 | 49.7 | 45.9 | 43 |
| 2088 | 41.9 | 51 | 34.9 | 49.3 | 49.6 | 45.9 | 42.9 |
| 2087 | 41.8 | 51 | 34.6 | 49.3 | 49.5 | 45.8 | 42.8 |
| 2086 | 41.7 | 51 | 34.4 | 49.3 | 49.4 | 45.7 | 42.7 |
| 2085 | 41.6 | 50.9 | 34.2 | 49.2 | 49.3 | 45.7 | 42.7 |
| 2084 | 41.4 | 50.8 | 34 | 49.2 | 49.2 | 45.6 | 42.6 |
| 2083 | 41.3 | 50.7 | 33.8 | 49.2 | 49 | 45.5 | 42.5 |
| 2082 | 41.2 | 50.5 | 33.6 | 49.2 | 48.9 | 45.5 | 42.5 |
| 2081 | 41.1 | 50.3 | 33.4 | 49.2 | 48.8 | 45.4 | 42.4 |
| 2080 | 41 | 50.1 | 33.2 | 49.3 | 48.7 | 45.4 | 42.4 |
| 2079 | 40.9 | 49.9 | 32.9 | 49.3 | 48.5 | 45.3 | 42.3 |
| 2078 | 40.8 | 49.7 | 32.7 | 49.3 | 48.4 | 45.3 | 42.2 |
| 2077 | 40.7 | 49.4 | 32.5 | 49.3 | 48.3 | 45.3 | 42.2 |
| 2076 | 40.6 | 49.2 | 32.3 | 49.3 | 48.1 | 45.2 | 42.1 |
| 2075 | 40.5 | 49 | 32.1 | 49.4 | 48 | 45.2 | 42 |
| 2074 | 40.4 | 48.8 | 31.8 | 49.4 | 47.8 | 45.2 | 41.9 |
| 2073 | 40.3 | 48.5 | 31.6 | 49.4 | 47.6 | 45.1 | 41.8 |
| 2072 | 40.2 | 48.3 | 31.4 | 49.4 | 47.5 | 45.1 | 41.8 |
| 2071 | 40.1 | 48 | 31.1 | 49.4 | 47.3 | 45 | 41.7 |
| 2070 | 39.9 | 47.8 | 30.9 | 49.3 | 47.1 | 45 | 41.5 |
| 2069 | 39.8 | 47.6 | 30.7 | 49.3 | 46.9 | 45 | 41.4 |
| 2068 | 39.7 | 47.3 | 30.5 | 49.2 | 46.7 | 44.9 | 41.3 |
| 2067 | 39.6 | 47.1 | 30.2 | 49.1 | 46.4 | 44.9 | 41.2 |
| 2066 | 39.5 | 46.8 | 30 | 49.1 | 46.2 | 44.8 | 41.1 |
| 2065 | 39.4 | 46.6 | 29.7 | 49 | 46 | 44.8 | 41 |
| 2064 | 39.3 | 46.4 | 29.5 | 48.9 | 45.7 | 44.7 | 40.9 |
| 2063 | 39.2 | 46.1 | 29.3 | 48.8 | 45.5 | 44.7 | 40.8 |
| 2062 | 39.1 | 45.9 | 29 | 48.6 | 45.2 | 44.6 | 40.7 |
| 2061 | 39 | 45.6 | 28.8 | 48.5 | 44.9 | 44.5 | 40.6 |
| 2060 | 38.8 | 45.4 | 28.5 | 48.4 | 44.7 | 44.4 | 40.5 |
| 2059 | 38.7 | 45.1 | 28.3 | 48.3 | 44.4 | 44.3 | 40.3 |
| 2058 | 38.6 | 44.9 | 28.1 | 48.1 | 44.2 | 44.2 | 40.2 |
| 2057 | 38.4 | 44.6 | 27.8 | 48 | 43.9 | 44.1 | 40.1 |
| 2056 | 38.2 | 44.3 | 27.6 | 47.9 | 43.6 | 43.9 | 40 |
| 2055 | 38 | 44.1 | 27.3 | 47.8 | 43.3 | 43.8 | 39.8 |
| 2054 | 37.8 | 43.8 | 27.1 | 47.7 | 43 | 43.7 | 39.7 |
| 2053 | 37.6 | 43.5 | 26.8 | 47.7 | 42.7 | 43.6 | 39.5 |
| 2052 | 37.4 | 43.2 | 26.6 | 47.6 | 42.4 | 43.4 | 39.4 |
| 2051 | 37.2 | 43 | 26.3 | 47.6 | 42.1 | 43.3 | 39.2 |
| 2050 | 37 | 42.7 | 26.1 | 47.5 | 41.7 | 43.1 | 39.1 |
| 2049 | 36.7 | 42.4 | 25.9 | 47.5 | 41.4 | 43 | 39 |
| 2048 | 36.5 | 42.1 | 25.6 | 47.5 | 41.1 | 42.8 | 38.9 |
| 2047 | 36.3 | 41.8 | 25.4 | 47.5 | 40.8 | 42.7 | 38.8 |
| 2046 | 36.1 | 41.5 | 25.1 | 47.5 | 40.4 | 42.6 | 38.7 |
| 2045 | 35.9 | 41.2 | 24.9 | 47.5 | 40.1 | 42.5 | 38.6 |
| 2044 | 35.7 | 40.9 | 24.7 | 47.5 | 39.7 | 42.4 | 38.5 |
| 2043 | 35.5 | 40.5 | 24.4 | 47.5 | 39.4 | 42.3 | 38.4 |
| 2042 | 35.3 | 40.2 | 24.2 | 47.5 | 39 | 42.2 | 38.3 |
| 2041 | 35.1 | 39.9 | 24 | 47.4 | 38.7 | 42.2 | 38.2 |
| 2040 | 34.9 | 39.5 | 23.7 | 47.4 | 38.3 | 42.1 | 38.1 |
| 2039 | 34.7 | 39.1 | 23.5 | 47.3 | 37.9 | 42.1 | 37.9 |
| 2038 | 34.5 | 38.7 | 23.3 | 47.1 | 37.5 | 42 | 37.7 |
| 2037 | 34.3 | 38.3 | 23.1 | 47 | 37.2 | 41.9 | 37.5 |
| 2036 | 34.1 | 37.9 | 22.9 | 46.8 | 36.8 | 41.8 | 37.3 |
| 2035 | 33.9 | 37.5 | 22.6 | 46.5 | 36.4 | 41.6 | 37.1 |
| 2034 | 33.7 | 37.1 | 22.4 | 46.3 | 36 | 41.5 | 36.9 |
| 2033 | 33.5 | 36.7 | 22.2 | 46 | 35.6 | 41.3 | 36.6 |
| 2032 | 33.3 | 36.3 | 22 | 45.7 | 35.3 | 41.1 | 36.4 |
| 2031 | 33.1 | 35.9 | 21.8 | 45.5 | 34.9 | 40.9 | 36.1 |
| 2030 | 32.9 | 35.4 | 21.6 | 45.2 | 34.5 | 40.7 | 35.9 |
| 2029 | 32.7 | 35 | 21.4 | 44.9 | 34.1 | 40.5 | 35.6 |
| 2028 | 32.4 | 34.6 | 21.2 | 44.6 | 33.7 | 40.3 | 35.4 |
| 2027 | 32.2 | 34.2 | 21 | 44.3 | 33.3 | 40 | 35.1 |
| 2026 | 32 | 33.8 | 20.8 | 44 | 33 | 39.8 | 34.9 |
| 2025 | 31.8 | 33.6 | 20.8 | 43.9 | 32.8 | 39.7 | 34.8 |
| 2024 | 31.6 | 33.2 | 20.6 | 43.6 | 32.4 | 39.5 | 34.6 |
| 2023 | 31.3 | 32.8 | 20.4 | 43.3 | 32 | 39.3 | 34.3 |
| 2022 | 31 | 32.4 | 20.2 | 43 | 31.6 | 39 | 34.1 |
| 2021 | 30.8 | 32 | 20.1 | 42.8 | 31.2 | 38.8 | 33.9 |
| 2020 | 30.6 | 31.7 | 19.9 | 42.6 | 30.9 | 38.5 | 33.6 |
| 2019 | 30.3 | 31.3 | 19.8 | 42.3 | 30.5 | 38.3 | 33.3 |
| 2018 | 30 | 31 | 19.6 | 42.1 | 30.2 | 38.2 | 33.1 |
| 2017 | 29.8 | 30.7 | 19.5 | 41.9 | 29.8 | 38 | 33 |
| 2016 | 29.5 | 30.4 | 19.4 | 41.7 | 29.5 | 37.9 | 33 |
| 2015 | 29.3 | 30 | 19.3 | 41.5 | 29.1 | 37.8 | 32.9 |
| 2014 | 29.1 | 29.7 | 19.1 | 41.2 | 28.8 | 37.7 | 32.8 |
| 2013 | 28.9 | 29.4 | 19 | 41 | 28.4 | 37.6 | 32.8 |
| 2012 | 28.6 | 29.1 | 18.9 | 40.7 | 28 | 37.4 | 32.7 |
| 2011 | 28.4 | 28.8 | 18.8 | 40.5 | 27.7 | 37.3 | 32.6 |
| 2010 | 28.2 | 28.5 | 18.7 | 40.2 | 27.3 | 37.2 | 32.4 |
| 2009 | 28 | 28.2 | 18.7 | 39.9 | 27 | 37 | 32.3 |
| 2008 | 27.8 | 27.8 | 18.6 | 39.7 | 26.6 | 36.9 | 32.2 |
| 2007 | 27.6 | 27.5 | 18.5 | 39.5 | 26.3 | 36.8 | 32.1 |
| 2006 | 27.4 | 27.1 | 18.4 | 39.2 | 26 | 36.6 | 32 |
| 2005 | 27.2 | 26.7 | 18.3 | 39 | 25.6 | 36.4 | 31.8 |
| 2004 | 27 | 26.4 | 18.3 | 38.7 | 25.3 | 36.2 | 31.6 |
| 2003 | 26.7 | 26.1 | 18.2 | 38.4 | 25 | 36 | 31.4 |
| 2002 | 26.5 | 25.7 | 18.1 | 38.2 | 24.7 | 35.8 | 31.2 |
| 2001 | 26.3 | 25.4 | 18 | 37.9 | 24.4 | 35.6 | 31 |
| 2000 | 26.1 | 25.1 | 17.9 | 37.6 | 24.1 | 35.4 | 30.8 |
| 1999 | 25.9 | 24.7 | 17.9 | 37.4 | 23.8 | 35.2 | 30.5 |
| 1998 | 25.7 | 24.4 | 17.8 | 37 | 23.5 | 35 | 30.2 |
| 1997 | 25.4 | 24.1 | 17.7 | 36.7 | 23.3 | 34.7 | 29.9 |
| 1996 | 25.2 | 23.8 | 17.7 | 36.5 | 23 | 34.4 | 29.6 |
| 1995 | 25 | 23.5 | 17.7 | 36.2 | 22.8 | 34.2 | 29.4 |
| 1994 | 24.7 | 23.2 | 17.6 | 35.9 | 22.5 | 33.9 | 29.1 |
| 1993 | 24.5 | 22.9 | 17.6 | 35.6 | 22.3 | 33.6 | 28.9 |
| 1992 | 24.3 | 22.6 | 17.5 | 35.3 | 22.1 | 33.4 | 28.6 |
| 1991 | 24.1 | 22.4 | 17.5 | 35.1 | 21.8 | 33.2 | 28.4 |
| 1990 | 23.9 | 22.2 | 17.4 | 34.8 | 21.6 | 32.9 | 28.1 |
| 1989 | 23.8 | 21.9 | 17.4 | 34.6 | 21.4 | 32.7 | 27.9 |
| 1988 | 23.6 | 21.7 | 17.4 | 34.4 | 21.2 | 32.4 | 27.7 |
| 1987 | 23.4 | 21.5 | 17.3 | 34.1 | 21 | 32.1 | 27.5 |
| 1986 | 23.3 | 21.4 | 17.3 | 33.9 | 20.8 | 31.8 | 27.3 |
| 1985 | 23.2 | 21.3 | 17.3 | 33.7 | 20.6 | 31.5 | 27 |
| 1984 | 23 | 21.1 | 17.3 | 33.5 | 20.4 | 31.2 | 26.8 |
| 1983 | 22.9 | 20.9 | 17.3 | 33.3 | 20.2 | 30.9 | 26.6 |
| 1982 | 22.7 | 20.7 | 17.3 | 33.1 | 20 | 30.6 | 26.3 |
| 1981 | 22.6 | 20.5 | 17.3 | 32.9 | 19.8 | 30.3 | 26.1 |
| 1980 | 22.5 | 20.4 | 17.3 | 32.8 | 19.6 | 30 | 25.9 |
| 1979 | 22.3 | 20.2 | 17.4 | 32.7 | 19.4 | 29.7 | 25.7 |
| 1978 | 22.2 | 20.1 | 17.4 | 32.5 | 19.3 | 29.4 | 25.4 |
| 1977 | 22 | 19.9 | 17.4 | 32.4 | 19.1 | 29.1 | 25.2 |
| 1976 | 21.9 | 19.7 | 17.5 | 32.2 | 19 | 28.8 | 25 |
| 1975 | 21.7 | 19.5 | 17.5 | 32.1 | 18.8 | 28.6 | 24.8 |
| 1974 | 21.6 | 19.4 | 17.6 | 32 | 18.7 | 28.3 | 24.6 |
| 1973 | 21.5 | 19.3 | 17.6 | 32 | 18.6 | 28.1 | 24.5 |
| 1972 | 21.5 | 19.2 | 17.7 | 32 | 18.5 | 27.9 | 24.4 |
| 1971 | 21.4 | 19.1 | 17.8 | 31.9 | 18.4 | 27.7 | 24.4 |
| 1970 | 21.4 | 19.1 | 17.8 | 31.8 | 18.3 | 27.6 | 24.4 |
| 1969 | 21.5 | 19.1 | 17.9 | 31.7 | 18.2 | 27.7 | 24.5 |
| 1968 | 21.5 | 19.1 | 18 | 31.6 | 18.2 | 27.6 | 24.6 |
| 1967 | 21.6 | 19.2 | 18 | 31.5 | 18.1 | 27.6 | 24.7 |
| 1966 | 21.7 | 19.3 | 18.1 | 31.4 | 18.1 | 27.7 | 24.8 |
| 1965 | 21.8 | 19.4 | 18.1 | 31.3 | 18.1 | 27.8 | 25 |
| 1964 | 22 | 19.6 | 18.2 | 31.2 | 18.1 | 28 | 25.2 |
| 1963 | 22.2 | 19.8 | 18.3 | 31.1 | 18.1 | 28.2 | 25.4 |
| 1962 | 22.4 | 20.1 | 18.3 | 31 | 18.1 | 28.4 | 25.6 |
| 1961 | 22.5 | 20.2 | 18.4 | 30.8 | 18.2 | 28.7 | 25.8 |
| 1960 | 22.5 | 20.2 | 18.5 | 30.7 | 18.3 | 28.9 | 26 |
Data sources: World Bank | Health (1960–2025, retrieved 2026-07-08); United Nations | World Population Prospects (2026–2100, retrieved 2026-07-08); U.S. Census Bureau (1960–2025, retrieved 2026-07-08); National Statistics, Taiwan (1960–2025, retrieved 2026-07-08).
GeoRank.org/demographics | CC BY
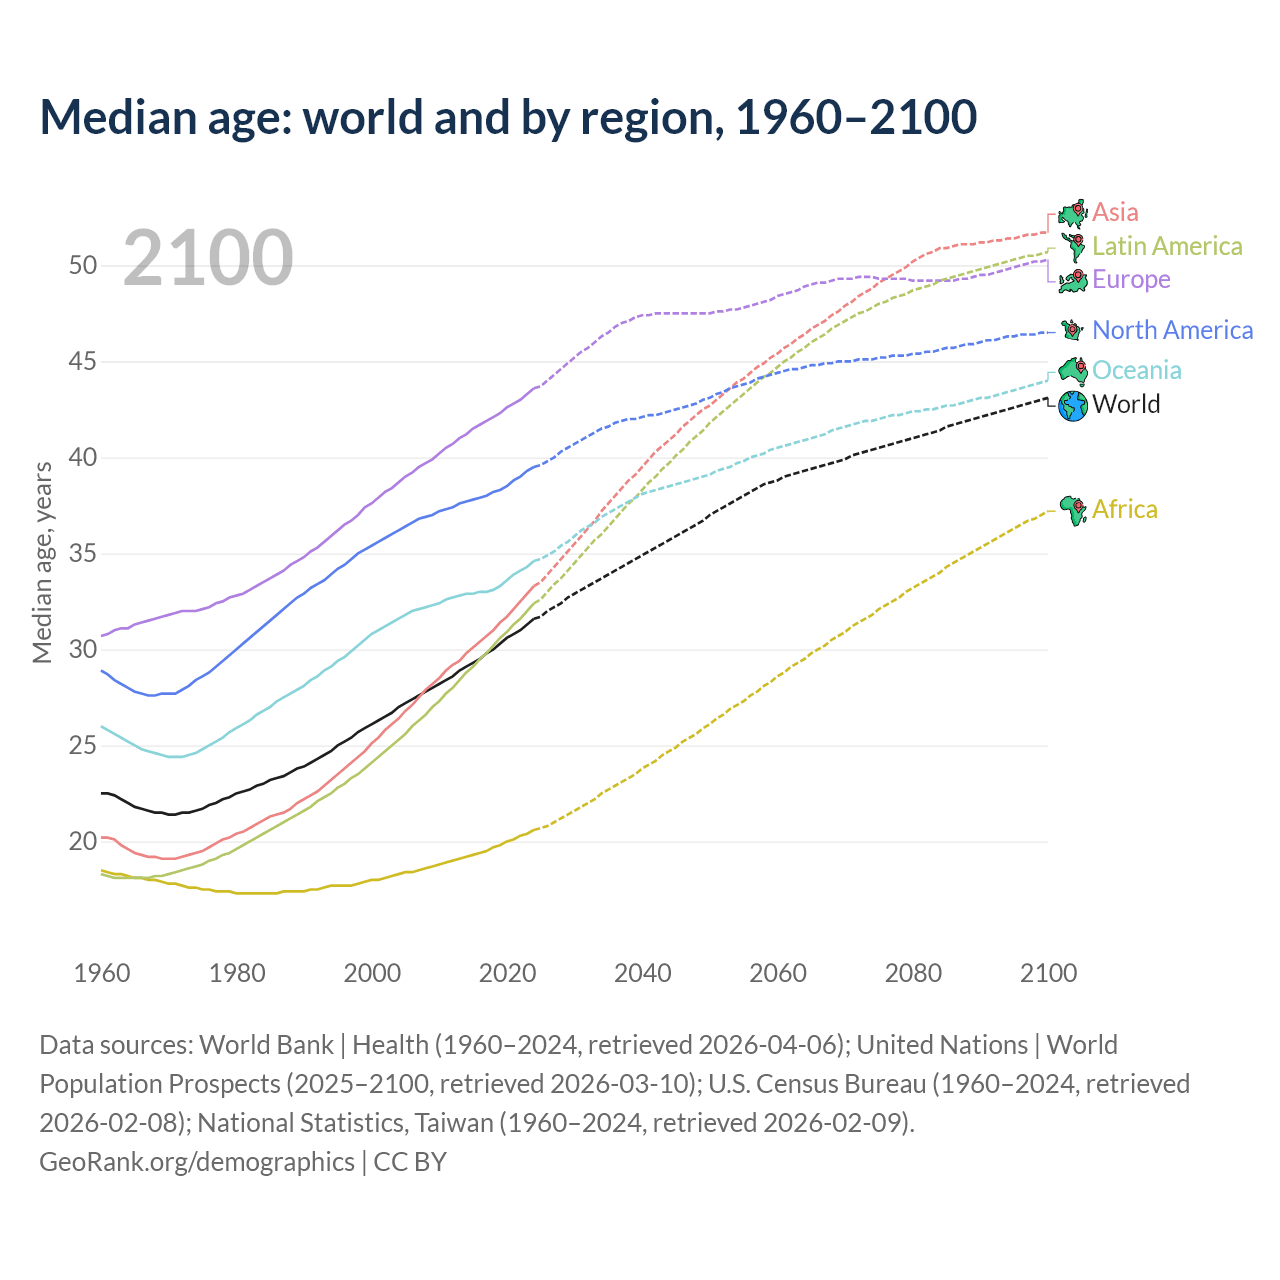
The median age showcases the structure of a demographic: it's the age at which half of the population is younger and half is older. The chart above displays the world's median age and by region breakdown trend: the demographic is aging everywhere.
The world's median age has increased from 22.5 in 1960 to 31.8 in 2025 and is expected to reach 37 by 2050.
For comparison, the median age in Europe was 30.7 years in 1960, is 43.9 years now, and is projected to increase to 47.5 years by 2050. In Africa, it was 18.5 years in 1960, is 20.8 years today, and is projected to increase to 26.1 years by 2050.
Demographics by region
| Rank | Region | Population | Median age | Age 0-14, % | Working age, % | Age 65+, % | Fertility rate |
|---|---|---|---|---|---|---|---|
| 1 | Asia |
4861527384
|
33.6 | 22.2% | 67.6% | 10.3% | 1.81 |
| 2 | Africa |
1600561986
|
20.8 | 38.8% | 57.5% | 3.69% | 4.06 |
| 3 | Europe |
744041683
|
43.9 | 15.1% | 64% | 21% | 1.36 |
| 4 | Latin America |
669578880
|
32.8 | 22.2% | 67.7% | 10.1% | 1.79 |
| 5 | North America |
386669507
|
39.7 | 16.9% | 64.5% | 18.6% | 1.59 |
| 6 | Oceania |
47094366
|
34.8 | 22.2% | 63.9% | 13.9% | 1.95 |
World population pyramid: age and gender distribution
| Age range | Share of population | |
|---|---|---|
 World
World
|
||
| Male | Female | |
| 80+ | 0.79% | 1.26% |
| 75-79 | 0.84% | 1.08% |
| 70-74 | 1.31% | 1.56% |
| 65-69 | 1.69% | 1.88% |
| 60-64 | 2.16% | 2.28% |
| 55-59 | 2.55% | 2.62% |
| 50-54 | 2.81% | 2.82% |
| 45-49 | 2.96% | 2.91% |
| 40-44 | 3.35% | 3.25% |
| 35-39 | 3.72% | 3.56% |
| 30-34 | 3.74% | 3.54% |
| 25-29 | 3.77% | 3.55% |
| 20-24 | 3.91% | 3.68% |
| 15-19 | 4.13% | 3.88% |
| 10-14 | 4.31% | 4.05% |
| 5-9 | 4.23% | 4% |
| 0-4 | 4.01% | 3.81% |
Data sources: World Bank | Health (2025, retrieved 2026-07-08).
GeoRank.org/demographics | CC BY
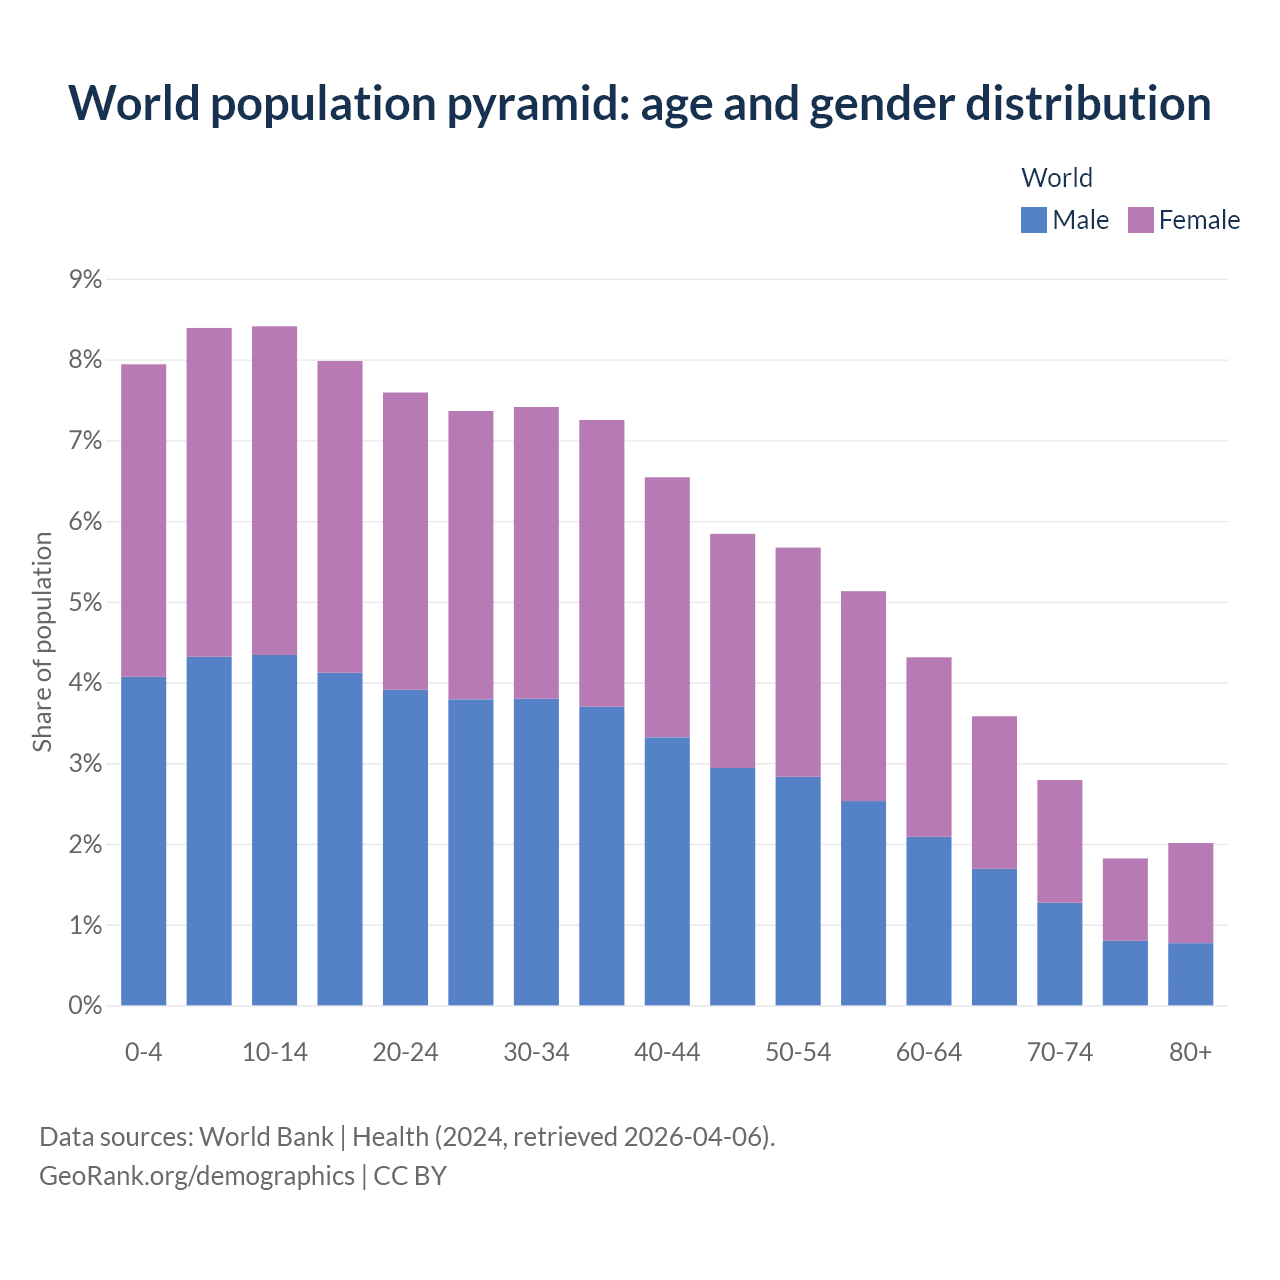
The demographic pyramid below is a graphical illustration of the age and gender distribution of a population. Its shape gives a one-glance view of age dynamics. The world's population pyramid has been changing over time with the world's population aging and birth rates declining. The shape of the demographic pyramid is still descending as the young population prevails over the old, but it used to be steeper — the proportion of young people was greater.
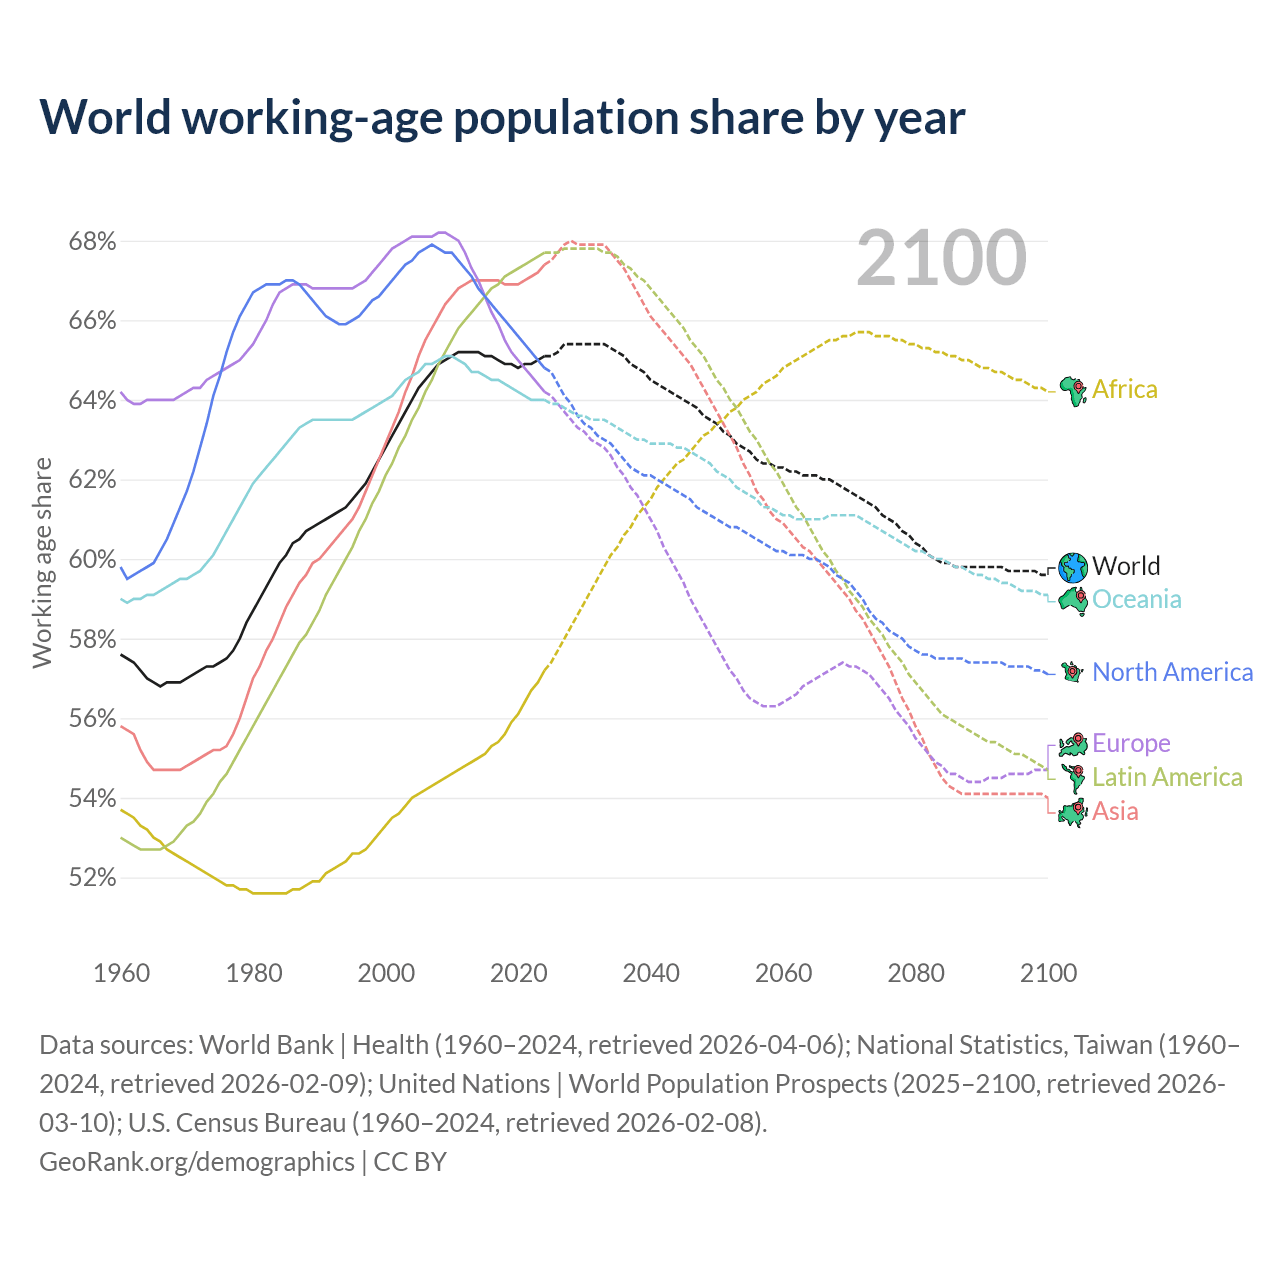
World working-age population share by year
| Year | Working age share | ||||||
|---|---|---|---|---|---|---|---|
| World | Asia | Africa | Europe | Latin America | North America | Oceania | |
| 2100 | 59.6% | 54.1% | 64.2% | 54.7% | 54.7% | 57.1% | 59.1% |
| 2099 | 59.6% | 54.1% | 64.3% | 54.7% | 54.8% | 57.2% | 59.1% |
| 2098 | 59.7% | 54.1% | 64.3% | 54.7% | 54.9% | 57.2% | 59.2% |
| 2097 | 59.7% | 54.2% | 64.4% | 54.6% | 55% | 57.3% | 59.2% |
| 2096 | 59.7% | 54.2% | 64.5% | 54.6% | 55.1% | 57.3% | 59.3% |
| 2095 | 59.7% | 54.2% | 64.5% | 54.6% | 55.1% | 57.3% | 59.3% |
| 2094 | 59.7% | 54.2% | 64.6% | 54.5% | 55.2% | 57.3% | 59.4% |
| 2093 | 59.8% | 54.2% | 64.7% | 54.5% | 55.3% | 57.4% | 59.4% |
| 2092 | 59.8% | 54.2% | 64.7% | 54.5% | 55.4% | 57.4% | 59.5% |
| 2091 | 59.8% | 54.2% | 64.8% | 54.5% | 55.4% | 57.4% | 59.5% |
| 2090 | 59.8% | 54.2% | 64.8% | 54.4% | 55.5% | 57.4% | 59.6% |
| 2089 | 59.8% | 54.2% | 64.9% | 54.4% | 55.6% | 57.4% | 59.7% |
| 2088 | 59.8% | 54.2% | 65% | 54.4% | 55.7% | 57.4% | 59.7% |
| 2087 | 59.8% | 54.2% | 65% | 54.5% | 55.8% | 57.4% | 59.8% |
| 2086 | 59.8% | 54.3% | 65.1% | 54.5% | 55.9% | 57.5% | 59.8% |
| 2085 | 59.9% | 54.4% | 65.1% | 54.6% | 56% | 57.5% | 59.9% |
| 2084 | 59.9% | 54.6% | 65.2% | 54.7% | 56.2% | 57.5% | 60% |
| 2083 | 60% | 54.8% | 65.2% | 54.9% | 56.3% | 57.5% | 60% |
| 2082 | 60.1% | 55.2% | 65.3% | 55.1% | 56.5% | 57.6% | 60.1% |
| 2081 | 60.3% | 55.5% | 65.3% | 55.3% | 56.7% | 57.6% | 60.2% |
| 2080 | 60.4% | 55.8% | 65.4% | 55.5% | 56.9% | 57.7% | 60.3% |
| 2079 | 60.6% | 56.2% | 65.5% | 55.8% | 57.2% | 57.8% | 60.3% |
| 2078 | 60.7% | 56.6% | 65.5% | 56% | 57.4% | 58% | 60.4% |
| 2077 | 60.9% | 57% | 65.6% | 56.2% | 57.6% | 58.1% | 60.5% |
| 2076 | 61% | 57.3% | 65.6% | 56.5% | 57.8% | 58.2% | 60.6% |
| 2075 | 61.1% | 57.6% | 65.6% | 56.7% | 58.1% | 58.4% | 60.7% |
| 2074 | 61.3% | 58% | 65.7% | 56.9% | 58.3% | 58.5% | 60.8% |
| 2073 | 61.4% | 58.3% | 65.7% | 57.1% | 58.5% | 58.7% | 60.9% |
| 2072 | 61.5% | 58.5% | 65.7% | 57.2% | 58.8% | 59% | 61% |
| 2071 | 61.6% | 58.8% | 65.7% | 57.3% | 59% | 59.2% | 61.1% |
| 2070 | 61.7% | 59% | 65.6% | 57.3% | 59.2% | 59.3% | 61.1% |
| 2069 | 61.8% | 59.2% | 65.6% | 57.4% | 59.5% | 59.5% | 61.1% |
| 2068 | 61.9% | 59.4% | 65.5% | 57.3% | 59.7% | 59.6% | 61.1% |
| 2067 | 62% | 59.6% | 65.5% | 57.2% | 60% | 59.8% | 61.1% |
| 2066 | 62% | 59.8% | 65.4% | 57.1% | 60.2% | 59.9% | 61% |
| 2065 | 62.1% | 60% | 65.3% | 57% | 60.5% | 60% | 61% |
| 2064 | 62.1% | 60.2% | 65.2% | 56.9% | 60.8% | 60% | 61% |
| 2063 | 62.1% | 60.4% | 65.1% | 56.7% | 61.1% | 60.1% | 61% |
| 2062 | 62.2% | 60.5% | 65% | 56.6% | 61.4% | 60.1% | 61% |
| 2061 | 62.2% | 60.7% | 64.9% | 56.5% | 61.6% | 60.1% | 61.1% |
| 2060 | 62.3% | 60.9% | 64.8% | 56.4% | 61.9% | 60.2% | 61.1% |
| 2059 | 62.3% | 61.1% | 64.6% | 56.3% | 62.2% | 60.2% | 61.2% |
| 2058 | 62.4% | 61.3% | 64.5% | 56.3% | 62.4% | 60.3% | 61.3% |
| 2057 | 62.4% | 61.5% | 64.4% | 56.3% | 62.7% | 60.4% | 61.3% |
| 2056 | 62.5% | 61.7% | 64.2% | 56.4% | 63% | 60.5% | 61.5% |
| 2055 | 62.7% | 62.1% | 64.1% | 56.5% | 63.3% | 60.6% | 61.6% |
| 2054 | 62.8% | 62.5% | 64% | 56.7% | 63.5% | 60.7% | 61.7% |
| 2053 | 62.9% | 62.8% | 63.8% | 57% | 63.8% | 60.8% | 61.8% |
| 2052 | 63.1% | 63.1% | 63.7% | 57.2% | 64% | 60.8% | 62% |
| 2051 | 63.2% | 63.5% | 63.5% | 57.5% | 64.3% | 60.9% | 62.1% |
| 2050 | 63.4% | 63.8% | 63.4% | 57.8% | 64.6% | 61% | 62.2% |
| 2049 | 63.5% | 64.1% | 63.2% | 58.1% | 64.8% | 61.1% | 62.4% |
| 2048 | 63.6% | 64.3% | 63% | 58.4% | 65.1% | 61.2% | 62.5% |
| 2047 | 63.8% | 64.6% | 62.9% | 58.7% | 65.3% | 61.3% | 62.6% |
| 2046 | 63.9% | 64.9% | 62.7% | 59% | 65.5% | 61.5% | 62.7% |
| 2045 | 64% | 65.1% | 62.5% | 59.4% | 65.8% | 61.6% | 62.8% |
| 2044 | 64.1% | 65.3% | 62.3% | 59.7% | 66% | 61.7% | 62.9% |
| 2043 | 64.2% | 65.5% | 62.2% | 60% | 66.2% | 61.8% | 62.9% |
| 2042 | 64.3% | 65.7% | 62% | 60.3% | 66.4% | 61.9% | 62.9% |
| 2041 | 64.4% | 65.9% | 61.7% | 60.7% | 66.6% | 62% | 62.9% |
| 2040 | 64.5% | 66.2% | 61.5% | 61% | 66.8% | 62.1% | 63% |
| 2039 | 64.7% | 66.4% | 61.3% | 61.3% | 67% | 62.1% | 63% |
| 2038 | 64.8% | 66.7% | 61% | 61.6% | 67.1% | 62.2% | 63% |
| 2037 | 64.9% | 67% | 60.8% | 61.9% | 67.3% | 62.3% | 63.1% |
| 2036 | 65.1% | 67.3% | 60.6% | 62.1% | 67.4% | 62.5% | 63.2% |
| 2035 | 65.2% | 67.5% | 60.3% | 62.3% | 67.6% | 62.7% | 63.3% |
| 2034 | 65.3% | 67.7% | 60.1% | 62.6% | 67.7% | 62.9% | 63.4% |
| 2033 | 65.4% | 67.9% | 59.8% | 62.8% | 67.7% | 63% | 63.5% |
| 2032 | 65.4% | 67.9% | 59.5% | 62.9% | 67.8% | 63.1% | 63.5% |
| 2031 | 65.4% | 67.9% | 59.2% | 63% | 67.8% | 63.3% | 63.5% |
| 2030 | 65.4% | 67.9% | 58.9% | 63.2% | 67.8% | 63.4% | 63.6% |
| 2029 | 65.4% | 67.9% | 58.6% | 63.4% | 67.8% | 63.6% | 63.6% |
| 2028 | 65.4% | 68% | 58.3% | 63.5% | 67.8% | 63.9% | 63.7% |
| 2027 | 65.4% | 67.9% | 58% | 63.7% | 67.8% | 64.1% | 63.8% |
| 2026 | 65.2% | 67.7% | 57.7% | 63.9% | 67.7% | 64.4% | 63.9% |
| 2025 | 65.2% | 67.6% | 57.5% | 64% | 67.7% | 64.5% | 63.9% |
| 2024 | 65.1% | 67.3% | 57.2% | 64.2% | 67.7% | 64.8% | 64% |
| 2023 | 65% | 67.2% | 56.9% | 64.4% | 67.6% | 65% | 64% |
| 2022 | 64.9% | 67.1% | 56.6% | 64.6% | 67.5% | 65.2% | 64% |
| 2021 | 64.9% | 67% | 56.3% | 64.8% | 67.4% | 65.4% | 64.1% |
| 2020 | 64.8% | 66.9% | 56.1% | 65% | 67.3% | 65.6% | 64.2% |
| 2019 | 64.9% | 66.9% | 55.8% | 65.2% | 67.1% | 65.8% | 64.3% |
| 2018 | 64.9% | 66.9% | 55.6% | 65.5% | 67.1% | 66% | 64.4% |
| 2017 | 65% | 66.9% | 55.4% | 65.9% | 66.9% | 66.2% | 64.5% |
| 2016 | 65.1% | 67% | 55.2% | 66.2% | 66.8% | 66.4% | 64.5% |
| 2015 | 65.1% | 67% | 55.1% | 66.6% | 66.6% | 66.6% | 64.6% |
| 2014 | 65.2% | 67% | 55% | 67% | 66.4% | 66.8% | 64.7% |
| 2013 | 65.2% | 66.9% | 54.9% | 67.3% | 66.2% | 67.1% | 64.7% |
| 2012 | 65.2% | 66.9% | 54.8% | 67.7% | 66% | 67.3% | 64.9% |
| 2011 | 65.2% | 66.7% | 54.7% | 68% | 65.8% | 67.5% | 65% |
| 2010 | 65.1% | 66.6% | 54.6% | 68.1% | 65.5% | 67.7% | 65.1% |
| 2009 | 65% | 66.3% | 54.5% | 68.2% | 65.2% | 67.7% | 65.1% |
| 2008 | 64.9% | 66.1% | 54.4% | 68.2% | 64.9% | 67.8% | 65% |
| 2007 | 64.7% | 65.8% | 54.3% | 68.1% | 64.5% | 67.9% | 64.9% |
| 2006 | 64.5% | 65.5% | 54.2% | 68.1% | 64.2% | 67.8% | 64.9% |
| 2005 | 64.3% | 65% | 54.1% | 68.1% | 63.8% | 67.7% | 64.7% |
| 2004 | 64% | 64.6% | 53.9% | 68.1% | 63.5% | 67.5% | 64.6% |
| 2003 | 63.7% | 64.1% | 53.8% | 68% | 63.1% | 67.4% | 64.5% |
| 2002 | 63.4% | 63.7% | 53.6% | 67.9% | 62.8% | 67.2% | 64.3% |
| 2001 | 63.1% | 63.2% | 53.4% | 67.8% | 62.4% | 67% | 64.1% |
| 2000 | 62.8% | 62.8% | 53.3% | 67.6% | 62.1% | 66.8% | 64% |
| 1999 | 62.5% | 62.4% | 53.1% | 67.4% | 61.7% | 66.6% | 63.9% |
| 1998 | 62.2% | 62.1% | 52.9% | 67.2% | 61.4% | 66.5% | 63.8% |
| 1997 | 61.9% | 61.7% | 52.7% | 67% | 61% | 66.3% | 63.7% |
| 1996 | 61.7% | 61.3% | 52.6% | 66.9% | 60.7% | 66.1% | 63.6% |
| 1995 | 61.5% | 61% | 52.6% | 66.8% | 60.3% | 66% | 63.5% |
| 1994 | 61.3% | 60.7% | 52.4% | 66.8% | 60% | 65.9% | 63.5% |
| 1993 | 61.2% | 60.5% | 52.3% | 66.8% | 59.7% | 65.9% | 63.5% |
| 1992 | 61.1% | 60.3% | 52.2% | 66.8% | 59.4% | 66% | 63.5% |
| 1991 | 61% | 60.2% | 52.1% | 66.8% | 59% | 66.1% | 63.5% |
| 1990 | 60.9% | 60% | 51.9% | 66.8% | 58.7% | 66.3% | 63.5% |
| 1989 | 60.8% | 59.8% | 51.8% | 66.8% | 58.4% | 66.5% | 63.5% |
| 1988 | 60.7% | 59.6% | 51.8% | 66.9% | 58.1% | 66.7% | 63.4% |
| 1987 | 60.5% | 59.4% | 51.7% | 66.9% | 57.9% | 66.9% | 63.3% |
| 1986 | 60.4% | 59.1% | 51.7% | 66.9% | 57.6% | 67% | 63.1% |
| 1985 | 60.1% | 58.8% | 51.6% | 66.8% | 57.3% | 67% | 62.9% |
| 1984 | 59.9% | 58.4% | 51.6% | 66.7% | 57% | 66.9% | 62.7% |
| 1983 | 59.6% | 58% | 51.6% | 66.4% | 56.7% | 66.9% | 62.5% |
| 1982 | 59.3% | 57.6% | 51.6% | 66% | 56.4% | 66.9% | 62.3% |
| 1981 | 59% | 57.3% | 51.6% | 65.7% | 56.1% | 66.8% | 62.1% |
| 1980 | 58.7% | 56.9% | 51.6% | 65.3% | 55.8% | 66.7% | 61.9% |
| 1979 | 58.4% | 56.5% | 51.7% | 65.2% | 55.5% | 66.4% | 61.6% |
| 1978 | 58% | 56% | 51.7% | 65% | 55.2% | 66.1% | 61.3% |
| 1977 | 57.7% | 55.5% | 51.8% | 64.9% | 54.9% | 65.7% | 61% |
| 1976 | 57.5% | 55.3% | 51.8% | 64.8% | 54.6% | 65.2% | 60.7% |
| 1975 | 57.4% | 55.2% | 51.9% | 64.7% | 54.4% | 64.7% | 60.4% |
| 1974 | 57.3% | 55.2% | 52% | 64.6% | 54.1% | 64.1% | 60.1% |
| 1973 | 57.3% | 55.1% | 52.1% | 64.5% | 53.9% | 63.4% | 59.9% |
| 1972 | 57.2% | 55% | 52.2% | 64.3% | 53.6% | 62.8% | 59.7% |
| 1971 | 57.1% | 54.9% | 52.3% | 64.3% | 53.4% | 62.2% | 59.6% |
| 1970 | 57% | 54.8% | 52.4% | 64.2% | 53.2% | 61.7% | 59.5% |
| 1969 | 56.9% | 54.7% | 52.5% | 64.1% | 53.1% | 61.3% | 59.5% |
| 1968 | 56.9% | 54.7% | 52.6% | 64% | 52.9% | 60.9% | 59.4% |
| 1967 | 56.9% | 54.7% | 52.7% | 64% | 52.8% | 60.5% | 59.3% |
| 1966 | 56.8% | 54.6% | 52.9% | 64% | 52.7% | 60.2% | 59.2% |
| 1965 | 56.9% | 54.7% | 53% | 64% | 52.7% | 59.9% | 59.1% |
| 1964 | 57% | 54.9% | 53.2% | 64% | 52.7% | 59.8% | 59.1% |
| 1963 | 57.2% | 55.2% | 53.3% | 63.9% | 52.7% | 59.7% | 59% |
| 1962 | 57.4% | 55.6% | 53.5% | 63.9% | 52.8% | 59.6% | 59% |
| 1961 | 57.5% | 55.7% | 53.6% | 64% | 52.9% | 59.5% | 58.9% |
| 1960 | 57.6% | 55.8% | 53.7% | 64.2% | 53% | 59.8% | 59% |
Data sources: World Bank | Health (1960–2025, retrieved 2026-07-08); National Statistics, Taiwan (1960–2025, retrieved 2026-07-08); United Nations | World Population Prospects (2026–2100, retrieved 2026-07-08); U.S. Census Bureau (1960–2025, retrieved 2026-07-08).
GeoRank.org/demographics | CC BY
About 65.2% of the demographic are working-age adults of 15-64 years old. The share of working adults has been growing since 1960 but stagnated in the 2010s and is projected to decline in the future.
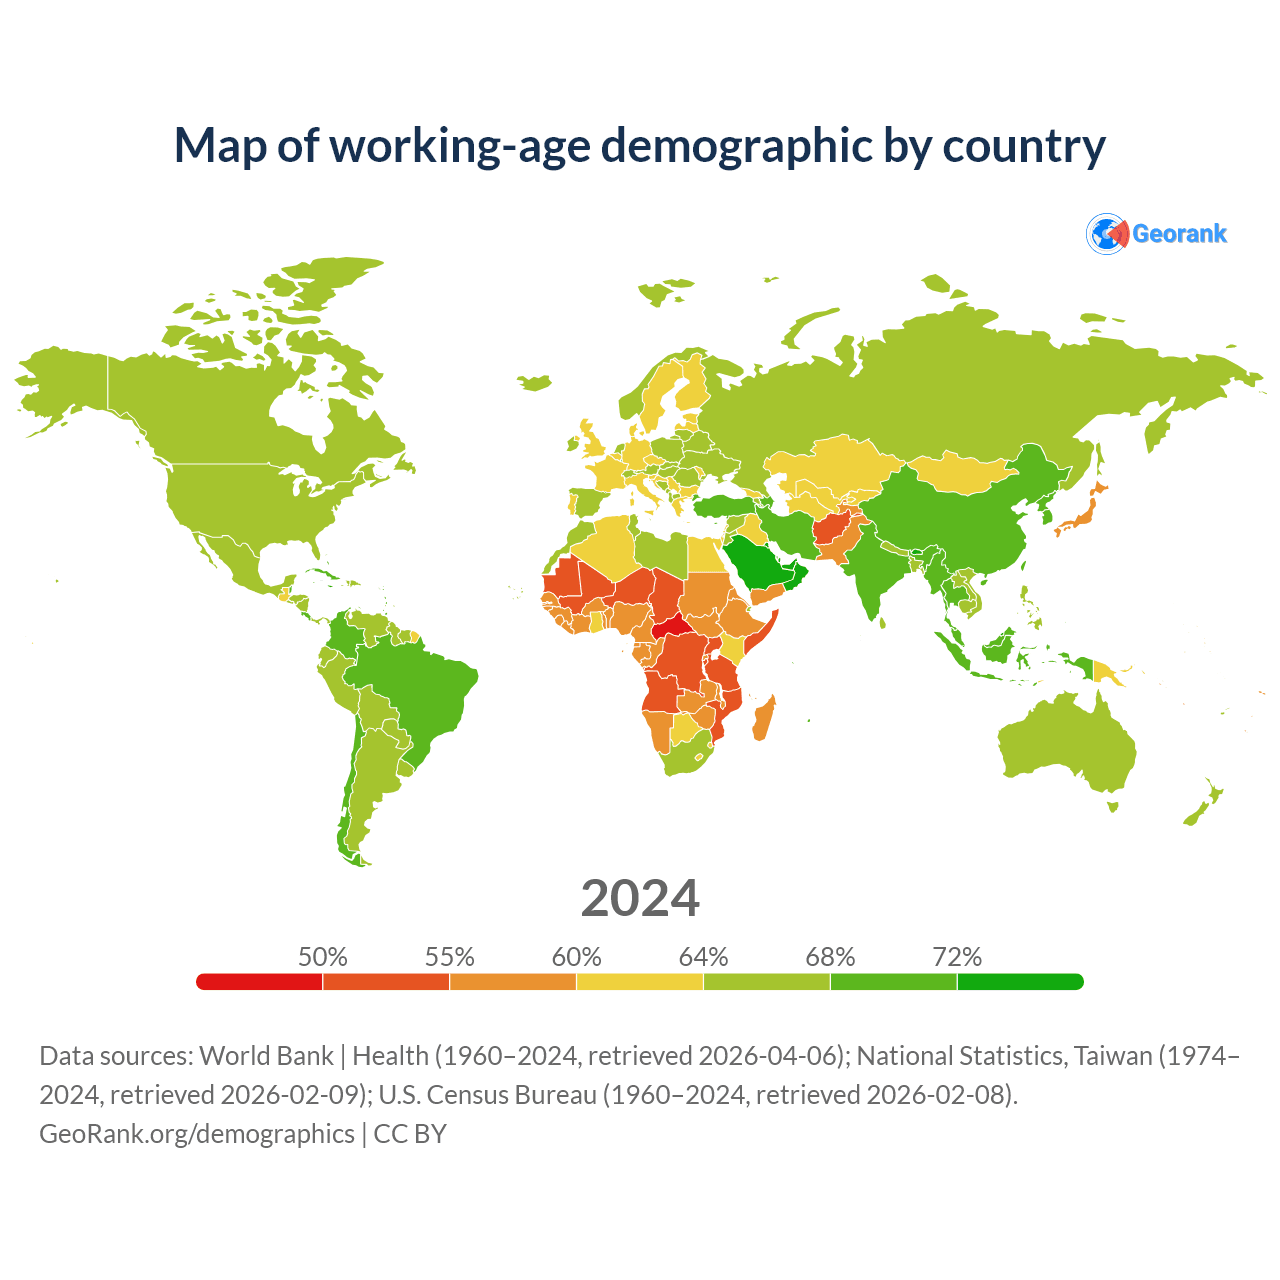
Map of working-age demographic by country
Data sources: World Bank | Health (1960–2025, retrieved 2026-07-08); National Statistics, Taiwan (1974–2025, retrieved 2026-07-08); U.S. Census Bureau (1960–2025, retrieved 2026-07-08).
GeoRank.org/demographics | CC BY
The map above shows how the share of working-age adults (15-64 years old) is distributed around the globe.
World demographics
| Population |
8309473806
|
|---|---|
| Median age | 31.8 years |
| Average age | 34 years |
| Working age population share | 65.2% |
| Age dependency ratio | 53.4% |
| Young-age dependency ratio | 37.4% |
| Old-age dependency ratio | 16% |
| Male:Female ratio | 50.3:49.7 |
| Fertility rate | 2.19 |
| Life expectancy | 73.8 years |
Compare countries by 7 more topics
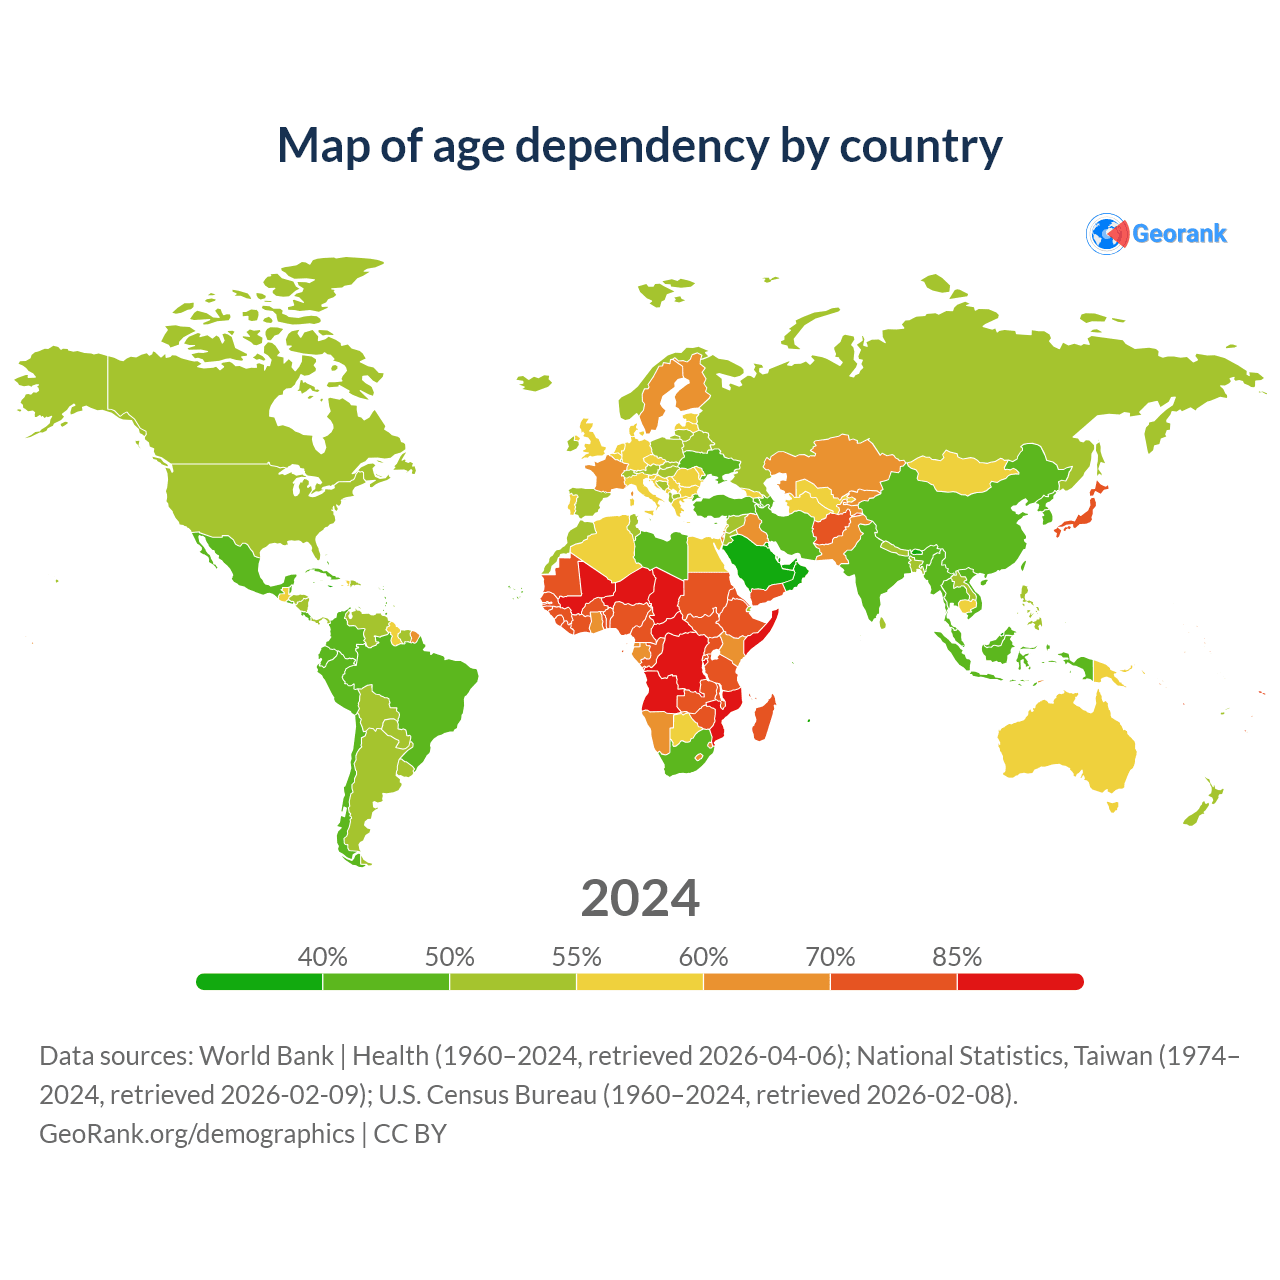
Map of age dependency by country
Data sources: World Bank | Health (1960–2025, retrieved 2026-07-08); National Statistics, Taiwan (1974–2025, retrieved 2026-07-08); U.S. Census Bureau (1960–2025, retrieved 2026-07-08).
GeoRank.org/demographics | CC BY
The age dependency ratio is a measure of the economic burden that dependents (children under 15 and people over 64) place on the working-age population. It's calculated by dividing the number of dependents by the number of working-age people. The current global age dependency ratio is 53.4%.
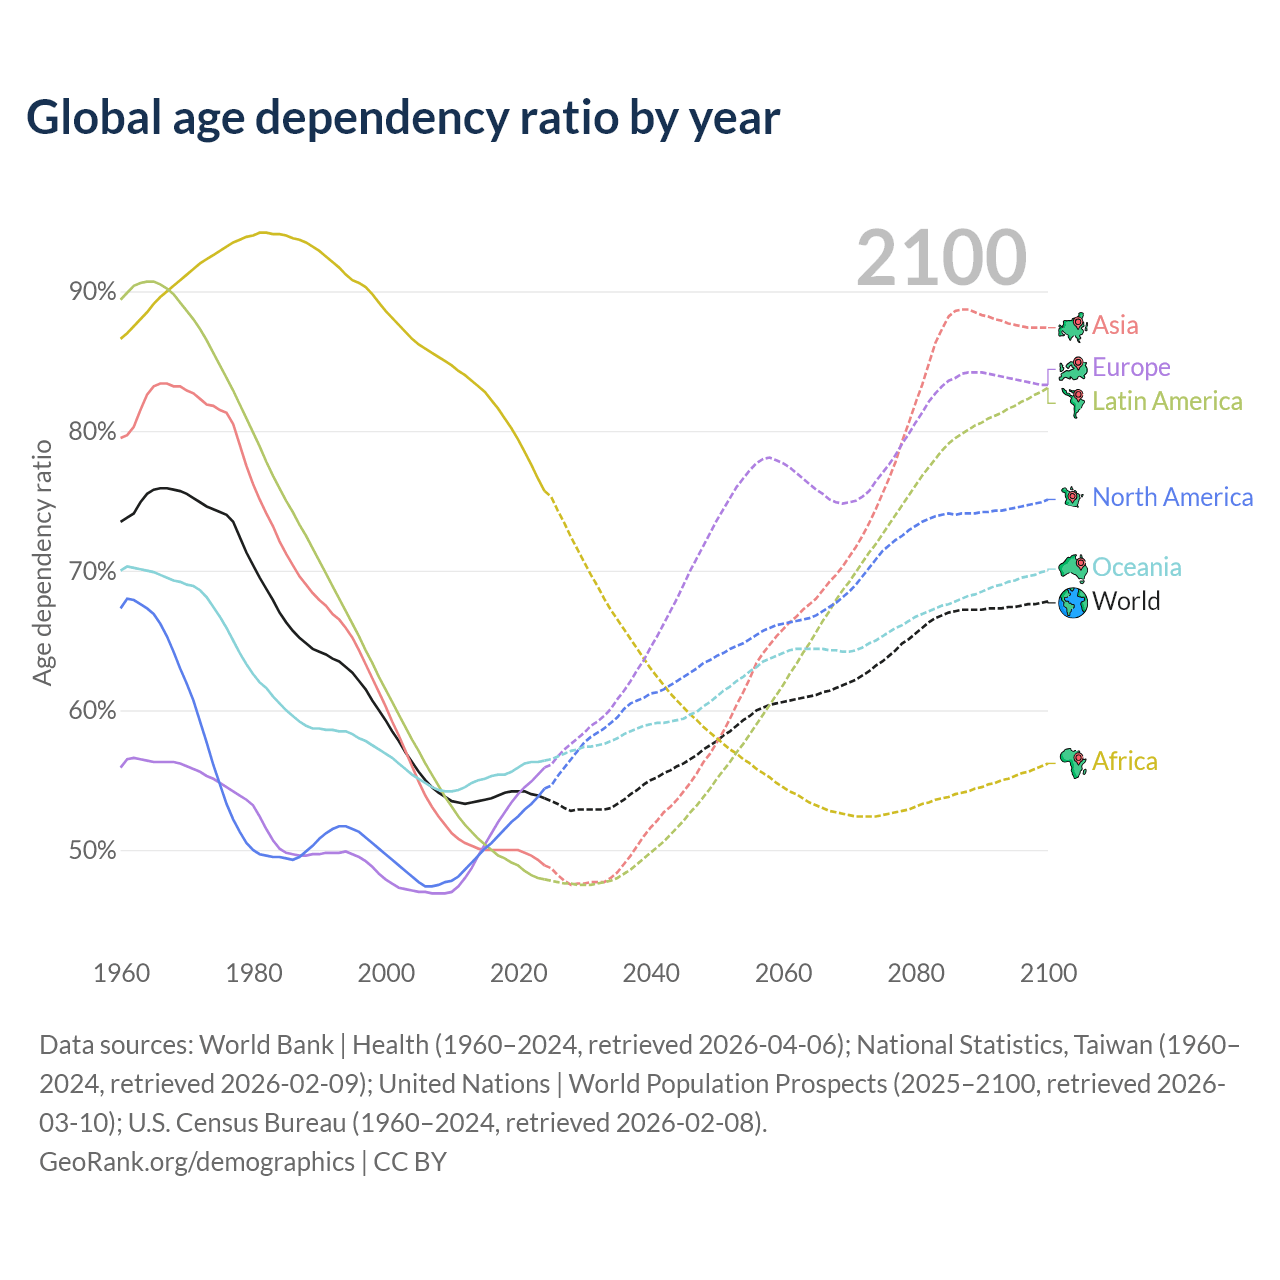
Global age dependency ratio by year
| Year | Age dependency ratio | ||||||
|---|---|---|---|---|---|---|---|
| World | Asia | Africa | Europe | Latin America | North America | Oceania | |
| 2100 | 67.8% | 87.3% | 56.1% | 83.4% | 83.1% | 75.1% | 70% |
| 2099 | 67.7% | 87.2% | 55.9% | 83.4% | 82.8% | 74.9% | 69.8% |
| 2098 | 67.6% | 87.2% | 55.8% | 83.4% | 82.6% | 74.8% | 69.7% |
| 2097 | 67.6% | 87.3% | 55.6% | 83.5% | 82.3% | 74.7% | 69.6% |
| 2096 | 67.5% | 87.3% | 55.4% | 83.6% | 82% | 74.6% | 69.5% |
| 2095 | 67.4% | 87.4% | 55.3% | 83.7% | 81.8% | 74.5% | 69.3% |
| 2094 | 67.4% | 87.6% | 55.1% | 83.8% | 81.6% | 74.4% | 69.2% |
| 2093 | 67.3% | 87.7% | 54.9% | 84% | 81.3% | 74.3% | 69% |
| 2092 | 67.3% | 87.8% | 54.8% | 84.1% | 81.1% | 74.3% | 68.8% |
| 2091 | 67.3% | 88% | 54.7% | 84.2% | 80.9% | 74.2% | 68.7% |
| 2090 | 67.2% | 88.2% | 54.5% | 84.2% | 80.6% | 74.2% | 68.5% |
| 2089 | 67.2% | 88.3% | 54.4% | 84.2% | 80.3% | 74.2% | 68.3% |
| 2088 | 67.2% | 88.5% | 54.2% | 84.2% | 80.1% | 74.1% | 68.1% |
| 2087 | 67.2% | 88.5% | 54.1% | 84.2% | 79.8% | 74.1% | 68% |
| 2086 | 67.1% | 88.4% | 54% | 83.9% | 79.5% | 74% | 67.8% |
| 2085 | 67% | 88% | 53.8% | 83.6% | 79.1% | 74.1% | 67.6% |
| 2084 | 66.8% | 87.1% | 53.7% | 83.2% | 78.6% | 74% | 67.5% |
| 2083 | 66.6% | 86.1% | 53.5% | 82.7% | 78% | 73.9% | 67.3% |
| 2082 | 66.3% | 84.6% | 53.4% | 82.1% | 77.4% | 73.7% | 67.1% |
| 2081 | 65.9% | 83.2% | 53.2% | 81.3% | 76.8% | 73.5% | 66.9% |
| 2080 | 65.5% | 81.9% | 53.1% | 80.6% | 76.1% | 73.2% | 66.6% |
| 2079 | 65.1% | 80.5% | 52.9% | 79.9% | 75.4% | 72.9% | 66.4% |
| 2078 | 64.8% | 79.1% | 52.8% | 79.1% | 74.7% | 72.5% | 66.1% |
| 2077 | 64.3% | 77.7% | 52.7% | 78.4% | 74% | 72.2% | 65.9% |
| 2076 | 63.9% | 76.5% | 52.6% | 77.7% | 73.3% | 71.8% | 65.6% |
| 2075 | 63.5% | 75.4% | 52.5% | 77% | 72.6% | 71.4% | 65.3% |
| 2074 | 63.2% | 74.2% | 52.4% | 76.4% | 71.9% | 70.9% | 65% |
| 2073 | 62.8% | 73.2% | 52.4% | 75.8% | 71.3% | 70.3% | 64.8% |
| 2072 | 62.5% | 72.4% | 52.4% | 75.3% | 70.6% | 69.6% | 64.5% |
| 2071 | 62.2% | 71.6% | 52.4% | 75% | 69.9% | 69% | 64.3% |
| 2070 | 62% | 70.9% | 52.5% | 74.9% | 69.2% | 68.5% | 64.2% |
| 2069 | 61.8% | 70.2% | 52.5% | 74.8% | 68.5% | 68.1% | 64.2% |
| 2068 | 61.6% | 69.6% | 52.7% | 74.9% | 67.8% | 67.7% | 64.2% |
| 2067 | 61.4% | 69% | 52.8% | 75.2% | 67.1% | 67.4% | 64.3% |
| 2066 | 61.3% | 68.5% | 53% | 75.5% | 66.4% | 67.1% | 64.4% |
| 2065 | 61.1% | 67.9% | 53.2% | 75.8% | 65.6% | 66.8% | 64.4% |
| 2064 | 61% | 67.5% | 53.4% | 76.2% | 64.8% | 66.6% | 64.4% |
| 2063 | 60.9% | 67.1% | 53.7% | 76.6% | 64.1% | 66.5% | 64.4% |
| 2062 | 60.8% | 66.6% | 54% | 77% | 63.3% | 66.4% | 64.4% |
| 2061 | 60.7% | 66.2% | 54.2% | 77.4% | 62.6% | 66.3% | 64.3% |
| 2060 | 60.6% | 65.7% | 54.5% | 77.7% | 61.8% | 66.2% | 64.1% |
| 2059 | 60.5% | 65.2% | 54.8% | 77.9% | 61.1% | 66.1% | 63.9% |
| 2058 | 60.4% | 64.6% | 55.2% | 78.1% | 60.4% | 65.9% | 63.7% |
| 2057 | 60.2% | 64% | 55.5% | 78% | 59.7% | 65.7% | 63.4% |
| 2056 | 60% | 63.3% | 55.8% | 77.7% | 59% | 65.4% | 63.1% |
| 2055 | 59.6% | 62.2% | 56.2% | 77.2% | 58.3% | 65.1% | 62.8% |
| 2054 | 59.3% | 61.2% | 56.5% | 76.6% | 57.6% | 64.8% | 62.4% |
| 2053 | 58.9% | 60.3% | 56.9% | 75.9% | 57% | 64.6% | 62.1% |
| 2052 | 58.5% | 59.3% | 57.2% | 75.2% | 56.3% | 64.4% | 61.7% |
| 2051 | 58.2% | 58.4% | 57.6% | 74.4% | 55.7% | 64.1% | 61.4% |
| 2050 | 57.8% | 57.6% | 58% | 73.5% | 55% | 63.9% | 61% |
| 2049 | 57.5% | 56.9% | 58.4% | 72.7% | 54.4% | 63.6% | 60.6% |
| 2048 | 57.2% | 56.2% | 58.9% | 71.8% | 53.8% | 63.4% | 60.3% |
| 2047 | 56.8% | 55.4% | 59.3% | 70.9% | 53.2% | 63% | 59.9% |
| 2046 | 56.5% | 54.8% | 59.8% | 70% | 52.7% | 62.7% | 59.7% |
| 2045 | 56.2% | 54.1% | 60.2% | 69% | 52.1% | 62.4% | 59.4% |
| 2044 | 56% | 53.6% | 60.8% | 68% | 51.6% | 62.1% | 59.3% |
| 2043 | 55.7% | 53.1% | 61.3% | 67.1% | 51.1% | 61.8% | 59.2% |
| 2042 | 55.5% | 52.6% | 61.9% | 66.2% | 50.6% | 61.5% | 59.1% |
| 2041 | 55.2% | 52.1% | 62.5% | 65.3% | 50.2% | 61.3% | 59.1% |
| 2040 | 55% | 51.6% | 63.1% | 64.5% | 49.8% | 61.2% | 59% |
| 2039 | 54.7% | 50.9% | 63.8% | 63.6% | 49.4% | 60.9% | 58.9% |
| 2038 | 54.3% | 50.3% | 64.4% | 62.8% | 49% | 60.7% | 58.7% |
| 2037 | 54% | 49.6% | 65.1% | 62.1% | 48.6% | 60.5% | 58.5% |
| 2036 | 53.6% | 49% | 65.8% | 61.4% | 48.3% | 60.1% | 58.3% |
| 2035 | 53.3% | 48.4% | 66.6% | 60.8% | 48% | 59.5% | 58% |
| 2034 | 53% | 48% | 67.3% | 60.1% | 47.8% | 59.1% | 57.8% |
| 2033 | 52.9% | 47.7% | 68.1% | 59.6% | 47.7% | 58.7% | 57.6% |
| 2032 | 52.9% | 47.7% | 68.9% | 59.2% | 47.6% | 58.4% | 57.5% |
| 2031 | 52.9% | 47.7% | 69.8% | 58.8% | 47.5% | 58.1% | 57.4% |
| 2030 | 52.9% | 47.6% | 70.7% | 58.4% | 47.5% | 57.7% | 57.4% |
| 2029 | 52.9% | 47.6% | 71.6% | 58% | 47.5% | 57.1% | 57.2% |
| 2028 | 52.8% | 47.6% | 72.5% | 57.5% | 47.6% | 56.5% | 57.1% |
| 2027 | 53% | 47.8% | 73.5% | 57.1% | 47.6% | 55.9% | 56.9% |
| 2026 | 53.3% | 48.3% | 74.4% | 56.7% | 47.7% | 55.3% | 56.7% |
| 2025 | 53.4% | 48.5% | 74.9% | 56.4% | 47.8% | 54.9% | 56.6% |
| 2024 | 53.7% | 48.9% | 75.8% | 55.9% | 47.9% | 54.4% | 56.4% |
| 2023 | 53.9% | 49.3% | 76.8% | 55.4% | 48% | 53.8% | 56.3% |
| 2022 | 54% | 49.6% | 77.7% | 54.9% | 48.3% | 53.3% | 56.3% |
| 2021 | 54.2% | 49.8% | 78.6% | 54.5% | 48.5% | 52.9% | 56.2% |
| 2020 | 54.2% | 50% | 79.4% | 54% | 48.9% | 52.4% | 55.9% |
| 2019 | 54.2% | 50.1% | 80.3% | 53.4% | 49.1% | 52% | 55.6% |
| 2018 | 54.1% | 50.1% | 81% | 52.7% | 49.4% | 51.5% | 55.4% |
| 2017 | 53.9% | 50% | 81.7% | 52% | 49.6% | 51% | 55.4% |
| 2016 | 53.7% | 50% | 82.3% | 51.2% | 50% | 50.5% | 55.3% |
| 2015 | 53.6% | 50.1% | 82.9% | 50.4% | 50.4% | 50.1% | 55.1% |
| 2014 | 53.5% | 50.2% | 83.3% | 49.6% | 50.8% | 49.6% | 55% |
| 2013 | 53.4% | 50.3% | 83.7% | 48.7% | 51.3% | 49.1% | 54.8% |
| 2012 | 53.3% | 50.5% | 84.1% | 48% | 51.8% | 48.6% | 54.5% |
| 2011 | 53.4% | 50.8% | 84.5% | 47.4% | 52.4% | 48.1% | 54.3% |
| 2010 | 53.5% | 51.3% | 84.8% | 47% | 53.1% | 47.8% | 54.2% |
| 2009 | 53.8% | 51.9% | 85.1% | 46.9% | 53.8% | 47.7% | 54.2% |
| 2008 | 54.1% | 52.5% | 85.5% | 46.9% | 54.6% | 47.5% | 54.3% |
| 2007 | 54.5% | 53.2% | 85.8% | 46.9% | 55.4% | 47.4% | 54.6% |
| 2006 | 55% | 54% | 86% | 47% | 56.2% | 47.4% | 54.8% |
| 2005 | 55.6% | 55% | 86.3% | 47% | 57.1% | 47.7% | 55.1% |
| 2004 | 56.3% | 56.1% | 86.7% | 47.1% | 58% | 48.1% | 55.4% |
| 2003 | 57% | 57.2% | 87.2% | 47.2% | 58.9% | 48.5% | 55.8% |
| 2002 | 57.8% | 58.2% | 87.7% | 47.3% | 59.8% | 48.9% | 56.3% |
| 2001 | 58.6% | 59.3% | 88.2% | 47.6% | 60.7% | 49.3% | 56.6% |
| 2000 | 59.3% | 60.4% | 88.7% | 47.9% | 61.6% | 49.7% | 57% |
| 1999 | 60% | 61.4% | 89.3% | 48.3% | 62.5% | 50.1% | 57.3% |
| 1998 | 60.7% | 62.4% | 89.9% | 48.8% | 63.4% | 50.5% | 57.5% |
| 1997 | 61.5% | 63.4% | 90.4% | 49.2% | 64.4% | 50.9% | 57.8% |
| 1996 | 62.1% | 64.4% | 90.6% | 49.5% | 65.3% | 51.3% | 58.1% |
| 1995 | 62.7% | 65.3% | 90.8% | 49.7% | 66.2% | 51.5% | 58.3% |
| 1994 | 63.1% | 66% | 91.3% | 49.9% | 67.1% | 51.7% | 58.5% |
| 1993 | 63.5% | 66.6% | 91.8% | 49.9% | 68% | 51.7% | 58.6% |
| 1992 | 63.7% | 67% | 92.2% | 49.8% | 68.9% | 51.5% | 58.6% |
| 1991 | 64% | 67.5% | 92.5% | 49.8% | 69.8% | 51.2% | 58.7% |
| 1990 | 64.2% | 68% | 93% | 49.7% | 70.8% | 50.8% | 58.7% |
| 1989 | 64.4% | 68.5% | 93.3% | 49.7% | 71.6% | 50.3% | 58.7% |
| 1988 | 64.8% | 69.1% | 93.5% | 49.6% | 72.5% | 49.9% | 58.9% |
| 1987 | 65.2% | 69.7% | 93.7% | 49.6% | 73.3% | 49.5% | 59.2% |
| 1986 | 65.7% | 70.4% | 93.9% | 49.7% | 74.2% | 49.3% | 59.6% |
| 1985 | 66.3% | 71.3% | 94% | 49.8% | 75% | 49.4% | 60.1% |
| 1984 | 67% | 72.2% | 94.1% | 50.1% | 75.9% | 49.5% | 60.5% |
| 1983 | 67.9% | 73.2% | 94.2% | 50.7% | 76.9% | 49.5% | 61.1% |
| 1982 | 68.7% | 74.2% | 94.2% | 51.5% | 77.8% | 49.6% | 61.6% |
| 1981 | 69.5% | 75.1% | 94.2% | 52.4% | 78.9% | 49.7% | 62% |
| 1980 | 70.4% | 76.3% | 94% | 53.2% | 79.9% | 50% | 62.6% |
| 1979 | 71.3% | 77.5% | 93.9% | 53.6% | 80.9% | 50.5% | 63.3% |
| 1978 | 72.4% | 79% | 93.7% | 53.9% | 81.9% | 51.3% | 64.1% |
| 1977 | 73.5% | 80.5% | 93.5% | 54.2% | 82.9% | 52.2% | 65% |
| 1976 | 74% | 81.3% | 93.2% | 54.5% | 83.8% | 53.3% | 65.9% |
| 1975 | 74.2% | 81.6% | 92.9% | 54.8% | 84.8% | 54.7% | 66.7% |
| 1974 | 74.4% | 81.8% | 92.6% | 55.1% | 85.7% | 56.1% | 67.4% |
| 1973 | 74.6% | 82% | 92.3% | 55.3% | 86.5% | 57.7% | 68.1% |
| 1972 | 74.9% | 82.4% | 92% | 55.6% | 87.3% | 59.2% | 68.6% |
| 1971 | 75.2% | 82.7% | 91.6% | 55.8% | 88% | 60.7% | 68.9% |
| 1970 | 75.5% | 83% | 91.2% | 56% | 88.7% | 61.9% | 69% |
| 1969 | 75.7% | 83.2% | 90.8% | 56.2% | 89.3% | 63% | 69.2% |
| 1968 | 75.8% | 83.2% | 90.4% | 56.3% | 89.8% | 64.2% | 69.3% |
| 1967 | 75.9% | 83.4% | 90% | 56.3% | 90.2% | 65.3% | 69.5% |
| 1966 | 75.9% | 83.5% | 89.6% | 56.3% | 90.5% | 66.2% | 69.7% |
| 1965 | 75.8% | 83.2% | 89% | 56.3% | 90.7% | 66.9% | 69.9% |
| 1964 | 75.5% | 82.6% | 88.5% | 56.4% | 90.7% | 67.3% | 70% |
| 1963 | 74.9% | 81.6% | 88% | 56.5% | 90.7% | 67.6% | 70.1% |
| 1962 | 74.1% | 80.3% | 87.5% | 56.6% | 90.4% | 67.9% | 70.2% |
| 1961 | 73.8% | 79.7% | 87% | 56.5% | 89.9% | 68% | 70.3% |
| 1960 | 73.5% | 79.5% | 86.6% | 55.9% | 89.4% | 67.3% | 70% |
Data sources: World Bank | Health (1960–2025, retrieved 2026-07-08); National Statistics, Taiwan (1960–2025, retrieved 2026-07-08); United Nations | World Population Prospects (2026–2100, retrieved 2026-07-08); U.S. Census Bureau (1960–2025, retrieved 2026-07-08).
GeoRank.org/demographics | CC BY
The age dependency ratio has been declining globally since the 1960s, driven largely by falling birth rates in Asia, Latin America, and Africa. Most regions bottomed out between 2010 and 2020 and are now rising as populations age. Europe leads this reversal, projected to reach into almost 75% by 2050, while Africa stands out as the only region still on a downward trend, with its younger population and continued high fertility rates. By 2050, all regions except Africa are expected to have higher dependency ratios than they do today.
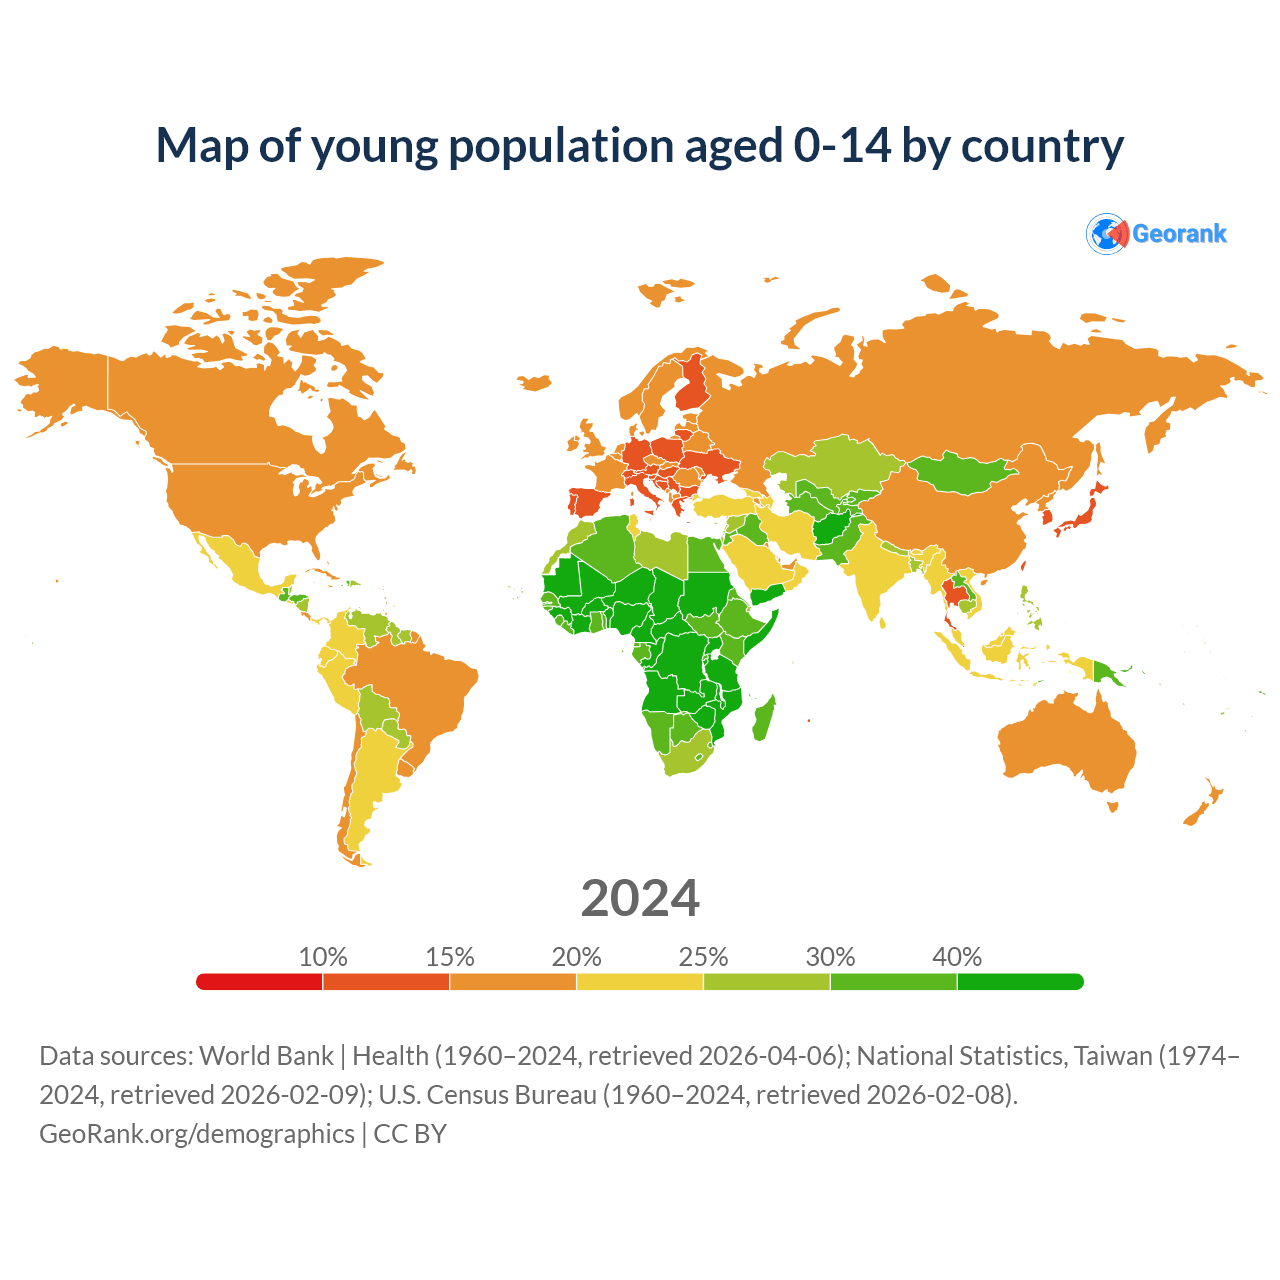
Map of young population aged 0-14 by country
Data sources: World Bank | Health (1960–2025, retrieved 2026-07-08); National Statistics, Taiwan (1974–2025, retrieved 2026-07-08); U.S. Census Bureau (1960–2025, retrieved 2026-07-08).
GeoRank.org/demographics | CC BY
The world map above shows that Africa and some parts of the Middle East and Asia are regions with the highest percentage of young demographics.
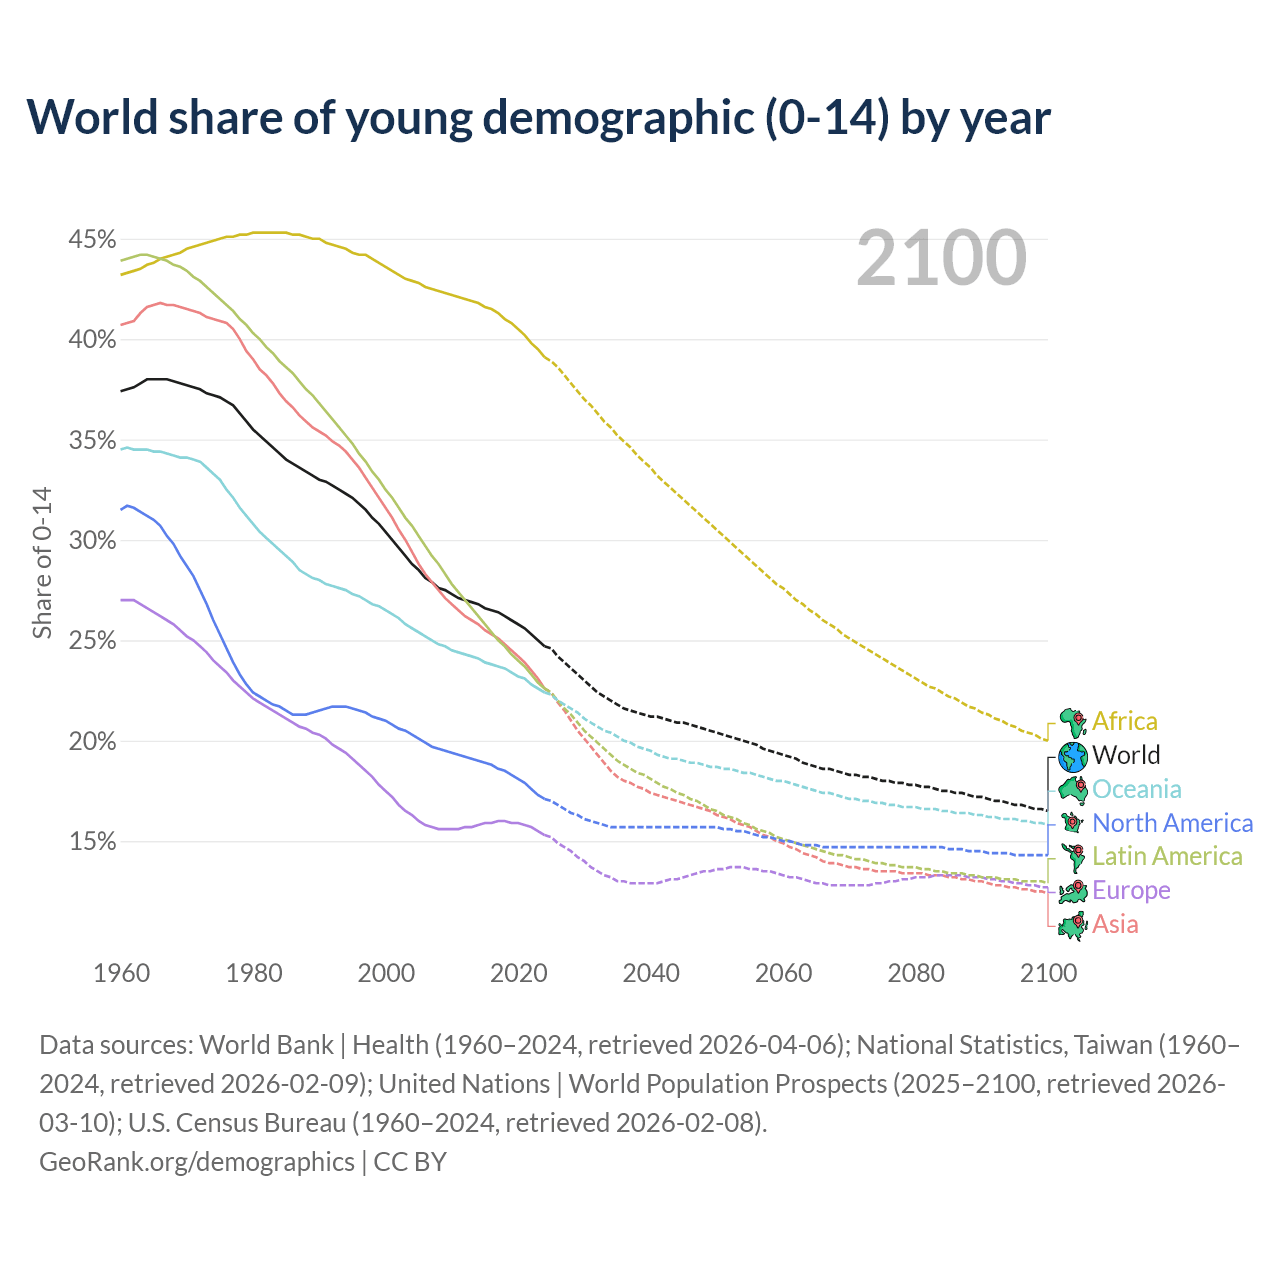
World share of young demographic (0-14) by year
| Year | Share of 0-14 | ||||||
|---|---|---|---|---|---|---|---|
| World | Asia | Africa | Europe | Latin America | North America | Oceania | |
| 2100 | 16.5% | 12.5% | 20% | 12.7% | 12.9% | 14.3% | 15.8% |
| 2099 | 16.6% | 12.5% | 20.2% | 12.7% | 13% | 14.3% | 15.9% |
| 2098 | 16.6% | 12.5% | 20.3% | 12.8% | 13% | 14.3% | 15.9% |
| 2097 | 16.7% | 12.6% | 20.4% | 12.8% | 13% | 14.3% | 16% |
| 2096 | 16.8% | 12.6% | 20.6% | 12.9% | 13% | 14.3% | 16% |
| 2095 | 16.8% | 12.7% | 20.7% | 12.9% | 13.1% | 14.3% | 16.1% |
| 2094 | 16.9% | 12.7% | 20.8% | 13% | 13.1% | 14.4% | 16.1% |
| 2093 | 17% | 12.8% | 21% | 13% | 13.1% | 14.4% | 16.2% |
| 2092 | 17% | 12.9% | 21.1% | 13.1% | 13.2% | 14.4% | 16.2% |
| 2091 | 17.1% | 12.9% | 21.3% | 13.1% | 13.2% | 14.4% | 16.2% |
| 2090 | 17.2% | 13% | 21.4% | 13.2% | 13.2% | 14.5% | 16.3% |
| 2089 | 17.2% | 13% | 21.6% | 13.2% | 13.3% | 14.5% | 16.3% |
| 2088 | 17.3% | 13.1% | 21.7% | 13.2% | 13.3% | 14.5% | 16.4% |
| 2087 | 17.4% | 13.2% | 21.9% | 13.3% | 13.4% | 14.6% | 16.4% |
| 2086 | 17.4% | 13.2% | 22.1% | 13.3% | 13.4% | 14.6% | 16.4% |
| 2085 | 17.5% | 13.3% | 22.2% | 13.3% | 13.4% | 14.6% | 16.5% |
| 2084 | 17.5% | 13.3% | 22.4% | 13.3% | 13.5% | 14.7% | 16.5% |
| 2083 | 17.6% | 13.3% | 22.6% | 13.2% | 13.5% | 14.7% | 16.6% |
| 2082 | 17.7% | 13.4% | 22.8% | 13.2% | 13.6% | 14.7% | 16.6% |
| 2081 | 17.7% | 13.4% | 22.9% | 13.2% | 13.6% | 14.7% | 16.6% |
| 2080 | 17.8% | 13.4% | 23.1% | 13.1% | 13.7% | 14.7% | 16.7% |
| 2079 | 17.8% | 13.5% | 23.3% | 13.1% | 13.7% | 14.7% | 16.7% |
| 2078 | 17.9% | 13.5% | 23.5% | 13.1% | 13.8% | 14.7% | 16.7% |
| 2077 | 17.9% | 13.5% | 23.7% | 13% | 13.8% | 14.7% | 16.8% |
| 2076 | 18% | 13.5% | 23.9% | 13% | 13.8% | 14.7% | 16.8% |
| 2075 | 18% | 13.5% | 24.1% | 12.9% | 13.9% | 14.7% | 16.9% |
| 2074 | 18.1% | 13.6% | 24.3% | 12.9% | 13.9% | 14.7% | 16.9% |
| 2073 | 18.2% | 13.6% | 24.5% | 12.8% | 14% | 14.7% | 17% |
| 2072 | 18.2% | 13.6% | 24.7% | 12.8% | 14.1% | 14.7% | 17% |
| 2071 | 18.3% | 13.7% | 24.9% | 12.8% | 14.1% | 14.7% | 17.1% |
| 2070 | 18.3% | 13.7% | 25.1% | 12.8% | 14.2% | 14.7% | 17.1% |
| 2069 | 18.4% | 13.8% | 25.4% | 12.8% | 14.3% | 14.7% | 17.2% |
| 2068 | 18.5% | 13.9% | 25.6% | 12.8% | 14.3% | 14.7% | 17.3% |
| 2067 | 18.6% | 14% | 25.8% | 12.8% | 14.4% | 14.7% | 17.4% |
| 2066 | 18.6% | 14.1% | 26.1% | 12.9% | 14.5% | 14.7% | 17.4% |
| 2065 | 18.7% | 14.2% | 26.3% | 12.9% | 14.6% | 14.8% | 17.5% |
| 2064 | 18.8% | 14.3% | 26.5% | 13% | 14.7% | 14.8% | 17.6% |
| 2063 | 18.9% | 14.4% | 26.8% | 13.1% | 14.8% | 14.8% | 17.7% |
| 2062 | 19.1% | 14.6% | 27.1% | 13.1% | 14.9% | 14.9% | 17.8% |
| 2061 | 19.2% | 14.7% | 27.3% | 13.2% | 15% | 15% | 17.9% |
| 2060 | 19.3% | 14.9% | 27.6% | 13.3% | 15.1% | 15% | 18% |
| 2059 | 19.4% | 15.1% | 27.9% | 13.4% | 15.3% | 15.1% | 18% |
| 2058 | 19.5% | 15.2% | 28.1% | 13.5% | 15.4% | 15.2% | 18.1% |
| 2057 | 19.6% | 15.4% | 28.4% | 13.5% | 15.5% | 15.2% | 18.2% |
| 2056 | 19.8% | 15.5% | 28.7% | 13.6% | 15.6% | 15.3% | 18.3% |
| 2055 | 19.9% | 15.7% | 29% | 13.6% | 15.8% | 15.4% | 18.4% |
| 2054 | 20% | 15.8% | 29.3% | 13.7% | 15.9% | 15.4% | 18.4% |
| 2053 | 20.1% | 16% | 29.6% | 13.7% | 16.1% | 15.5% | 18.5% |
| 2052 | 20.2% | 16.1% | 29.9% | 13.7% | 16.2% | 15.6% | 18.6% |
| 2051 | 20.3% | 16.2% | 30.2% | 13.6% | 16.4% | 15.6% | 18.6% |
| 2050 | 20.4% | 16.4% | 30.5% | 13.6% | 16.5% | 15.7% | 18.7% |
| 2049 | 20.5% | 16.5% | 30.8% | 13.5% | 16.7% | 15.7% | 18.8% |
| 2048 | 20.6% | 16.6% | 31.1% | 13.5% | 16.8% | 15.7% | 18.8% |
| 2047 | 20.7% | 16.7% | 31.4% | 13.4% | 17% | 15.7% | 18.9% |
| 2046 | 20.8% | 16.8% | 31.7% | 13.3% | 17.1% | 15.7% | 18.9% |
| 2045 | 20.9% | 16.9% | 32% | 13.2% | 17.3% | 15.7% | 19% |
| 2044 | 20.9% | 17% | 32.3% | 13.1% | 17.4% | 15.7% | 19.1% |
| 2043 | 21% | 17.1% | 32.6% | 13.1% | 17.6% | 15.7% | 19.1% |
| 2042 | 21.1% | 17.2% | 33% | 13% | 17.8% | 15.7% | 19.2% |
| 2041 | 21.2% | 17.4% | 33.3% | 12.9% | 17.9% | 15.7% | 19.3% |
| 2040 | 21.2% | 17.5% | 33.6% | 12.9% | 18.1% | 15.7% | 19.5% |
| 2039 | 21.3% | 17.6% | 33.9% | 12.9% | 18.3% | 15.7% | 19.6% |
| 2038 | 21.4% | 17.8% | 34.3% | 12.9% | 18.4% | 15.7% | 19.7% |
| 2037 | 21.5% | 17.9% | 34.6% | 12.9% | 18.6% | 15.7% | 19.9% |
| 2036 | 21.6% | 18.1% | 34.9% | 13% | 18.8% | 15.7% | 20.1% |
| 2035 | 21.8% | 18.3% | 35.3% | 13% | 19.1% | 15.7% | 20.2% |
| 2034 | 22% | 18.6% | 35.6% | 13.2% | 19.3% | 15.7% | 20.4% |
| 2033 | 22.2% | 18.9% | 36% | 13.3% | 19.6% | 15.8% | 20.5% |
| 2032 | 22.4% | 19.3% | 36.3% | 13.5% | 19.9% | 15.9% | 20.7% |
| 2031 | 22.7% | 19.7% | 36.7% | 13.7% | 20.2% | 16% | 20.9% |
| 2030 | 23% | 20.1% | 37.1% | 14% | 20.5% | 16.1% | 21.2% |
| 2029 | 23.3% | 20.6% | 37.5% | 14.2% | 20.9% | 16.3% | 21.4% |
| 2028 | 23.6% | 21% | 37.8% | 14.5% | 21.3% | 16.4% | 21.6% |
| 2027 | 23.9% | 21.5% | 38.2% | 14.7% | 21.6% | 16.6% | 21.8% |
| 2026 | 24.2% | 22% | 38.6% | 14.9% | 22% | 16.8% | 22.1% |
| 2025 | 24.4% | 22.2% | 38.8% | 15.1% | 22.2% | 16.9% | 22.2% |
| 2024 | 24.7% | 22.6% | 39.2% | 15.3% | 22.6% | 17.1% | 22.4% |
| 2023 | 25% | 23.1% | 39.5% | 15.5% | 23% | 17.3% | 22.6% |
| 2022 | 25.3% | 23.5% | 39.9% | 15.7% | 23.3% | 17.6% | 22.9% |
| 2021 | 25.6% | 23.9% | 40.2% | 15.8% | 23.7% | 17.9% | 23.1% |
| 2020 | 25.8% | 24.3% | 40.5% | 15.9% | 24% | 18.1% | 23.3% |
| 2019 | 26% | 24.6% | 40.8% | 15.9% | 24.4% | 18.3% | 23.4% |
| 2018 | 26.2% | 24.9% | 41.1% | 16% | 24.7% | 18.5% | 23.6% |
| 2017 | 26.4% | 25.1% | 41.3% | 16% | 25% | 18.6% | 23.7% |
| 2016 | 26.5% | 25.3% | 41.5% | 15.9% | 25.4% | 18.8% | 23.8% |
| 2015 | 26.6% | 25.6% | 41.7% | 15.9% | 25.8% | 18.9% | 24% |
| 2014 | 26.8% | 25.8% | 41.8% | 15.8% | 26.2% | 19% | 24.1% |
| 2013 | 26.9% | 26.1% | 41.9% | 15.7% | 26.6% | 19.1% | 24.2% |
| 2012 | 27% | 26.3% | 42.1% | 15.7% | 27% | 19.2% | 24.3% |
| 2011 | 27.1% | 26.6% | 42.2% | 15.6% | 27.4% | 19.3% | 24.4% |
| 2010 | 27.3% | 26.9% | 42.3% | 15.6% | 27.9% | 19.4% | 24.5% |
| 2009 | 27.5% | 27.2% | 42.4% | 15.6% | 28.3% | 19.5% | 24.7% |
| 2008 | 27.6% | 27.5% | 42.5% | 15.6% | 28.8% | 19.6% | 24.8% |
| 2007 | 27.9% | 27.9% | 42.6% | 15.7% | 29.2% | 19.7% | 25% |
| 2006 | 28.1% | 28.4% | 42.7% | 15.8% | 29.7% | 19.9% | 25.2% |
| 2005 | 28.5% | 28.9% | 42.8% | 16% | 30.2% | 20.1% | 25.4% |
| 2004 | 28.8% | 29.5% | 42.9% | 16.3% | 30.7% | 20.3% | 25.6% |
| 2003 | 29.2% | 30% | 43.1% | 16.5% | 31.1% | 20.5% | 25.8% |
| 2002 | 29.6% | 30.6% | 43.2% | 16.8% | 31.6% | 20.6% | 26.1% |
| 2001 | 30% | 31.1% | 43.4% | 17.2% | 32.1% | 20.8% | 26.3% |
| 2000 | 30.4% | 31.7% | 43.6% | 17.5% | 32.5% | 21% | 26.5% |
| 1999 | 30.8% | 32.2% | 43.8% | 17.8% | 33% | 21.1% | 26.7% |
| 1998 | 31.1% | 32.7% | 44% | 18.2% | 33.5% | 21.2% | 26.8% |
| 1997 | 31.5% | 33.2% | 44.2% | 18.5% | 33.9% | 21.4% | 27% |
| 1996 | 31.8% | 33.6% | 44.3% | 18.8% | 34.4% | 21.5% | 27.2% |
| 1995 | 32.1% | 34.1% | 44.3% | 19.1% | 34.8% | 21.6% | 27.3% |
| 1994 | 32.3% | 34.4% | 44.5% | 19.4% | 35.2% | 21.7% | 27.5% |
| 1993 | 32.5% | 34.7% | 44.6% | 19.6% | 35.6% | 21.7% | 27.6% |
| 1992 | 32.7% | 35% | 44.7% | 19.8% | 36% | 21.7% | 27.7% |
| 1991 | 32.9% | 35.2% | 44.9% | 20.1% | 36.4% | 21.6% | 27.8% |
| 1990 | 33% | 35.5% | 45% | 20.3% | 36.8% | 21.5% | 28% |
| 1989 | 33.2% | 35.7% | 45.1% | 20.4% | 37.2% | 21.4% | 28.1% |
| 1988 | 33.3% | 36% | 45.1% | 20.6% | 37.6% | 21.3% | 28.3% |
| 1987 | 33.6% | 36.3% | 45.2% | 20.7% | 37.9% | 21.3% | 28.5% |
| 1986 | 33.8% | 36.6% | 45.2% | 20.9% | 38.3% | 21.3% | 28.9% |
| 1985 | 34% | 37% | 45.3% | 21.1% | 38.6% | 21.5% | 29.2% |
| 1984 | 34.3% | 37.4% | 45.3% | 21.3% | 38.9% | 21.7% | 29.5% |
| 1983 | 34.6% | 37.8% | 45.3% | 21.5% | 39.3% | 21.8% | 29.9% |
| 1982 | 34.9% | 38.2% | 45.3% | 21.7% | 39.6% | 22% | 30.2% |
| 1981 | 35.2% | 38.5% | 45.3% | 21.9% | 40% | 22.2% | 30.4% |
| 1980 | 35.5% | 39% | 45.3% | 22.1% | 40.4% | 22.4% | 30.8% |
| 1979 | 35.8% | 39.4% | 45.2% | 22.4% | 40.7% | 22.8% | 31.2% |
| 1978 | 36.3% | 40% | 45.2% | 22.7% | 41% | 23.3% | 31.6% |
| 1977 | 36.7% | 40.5% | 45.1% | 23% | 41.4% | 23.9% | 32.1% |
| 1976 | 36.9% | 40.8% | 45.1% | 23.4% | 41.7% | 24.6% | 32.5% |
| 1975 | 37.1% | 40.9% | 45% | 23.7% | 42% | 25.3% | 33% |
| 1974 | 37.2% | 41% | 44.9% | 24% | 42.3% | 26% | 33.3% |
| 1973 | 37.3% | 41.1% | 44.8% | 24.4% | 42.6% | 26.8% | 33.6% |
| 1972 | 37.5% | 41.3% | 44.7% | 24.7% | 42.9% | 27.5% | 33.9% |
| 1971 | 37.6% | 41.4% | 44.6% | 25% | 43.1% | 28.2% | 34% |
| 1970 | 37.7% | 41.5% | 44.5% | 25.2% | 43.4% | 28.7% | 34.1% |
| 1969 | 37.8% | 41.6% | 44.3% | 25.5% | 43.6% | 29.2% | 34.2% |
| 1968 | 37.9% | 41.7% | 44.2% | 25.8% | 43.8% | 29.8% | 34.2% |
| 1967 | 38% | 41.8% | 44.1% | 26% | 43.9% | 30.2% | 34.3% |
| 1966 | 38% | 41.8% | 44% | 26.2% | 44% | 30.7% | 34.4% |
| 1965 | 38% | 41.7% | 43.8% | 26.4% | 44.1% | 31% | 34.4% |
| 1964 | 38% | 41.6% | 43.7% | 26.6% | 44.2% | 31.2% | 34.5% |
| 1963 | 37.8% | 41.3% | 43.5% | 26.8% | 44.2% | 31.4% | 34.5% |
| 1962 | 37.6% | 40.9% | 43.4% | 27% | 44.1% | 31.6% | 34.5% |
| 1961 | 37.5% | 40.8% | 43.3% | 27% | 44% | 31.7% | 34.6% |
| 1960 | 37.4% | 40.7% | 43.2% | 26.9% | 43.9% | 31.5% | 34.5% |
Data sources: World Bank | Health (1960–2025, retrieved 2026-07-08); National Statistics, Taiwan (1960–2025, retrieved 2026-07-08); United Nations | World Population Prospects (2026–2100, retrieved 2026-07-08); U.S. Census Bureau (1960–2025, retrieved 2026-07-08).
GeoRank.org/demographics | CC BY
The share of the youth population has been declining in recent decades. The percentage of young people is 24.4% today, it was 37.4% in 1960 and projected to be 20.4% by 2050.
Map of population aged 65+ by country
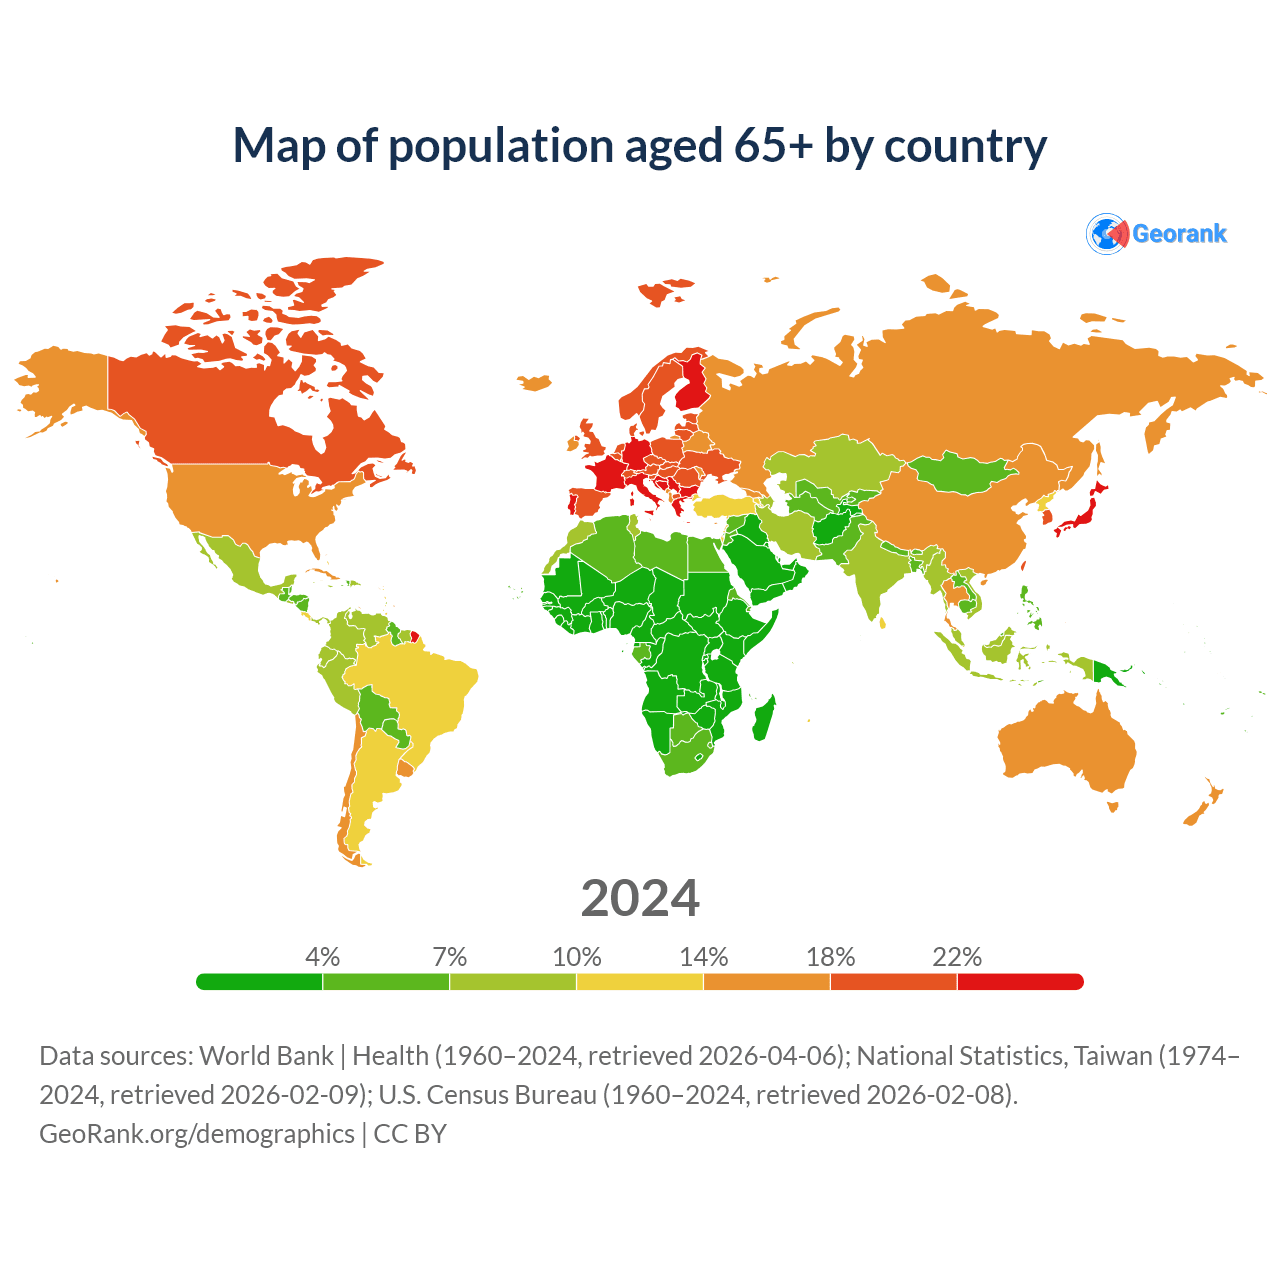
Data sources: World Bank | Health (1960–2025, retrieved 2026-07-08); National Statistics, Taiwan (1974–2025, retrieved 2026-07-08); U.S. Census Bureau (1960–2025, retrieved 2026-07-08).
GeoRank.org/demographics | CC BY
Above is a map with the share of the old population in each country that highlights the variations in older population ratios across the globe.
World share of population aged 65+ by year
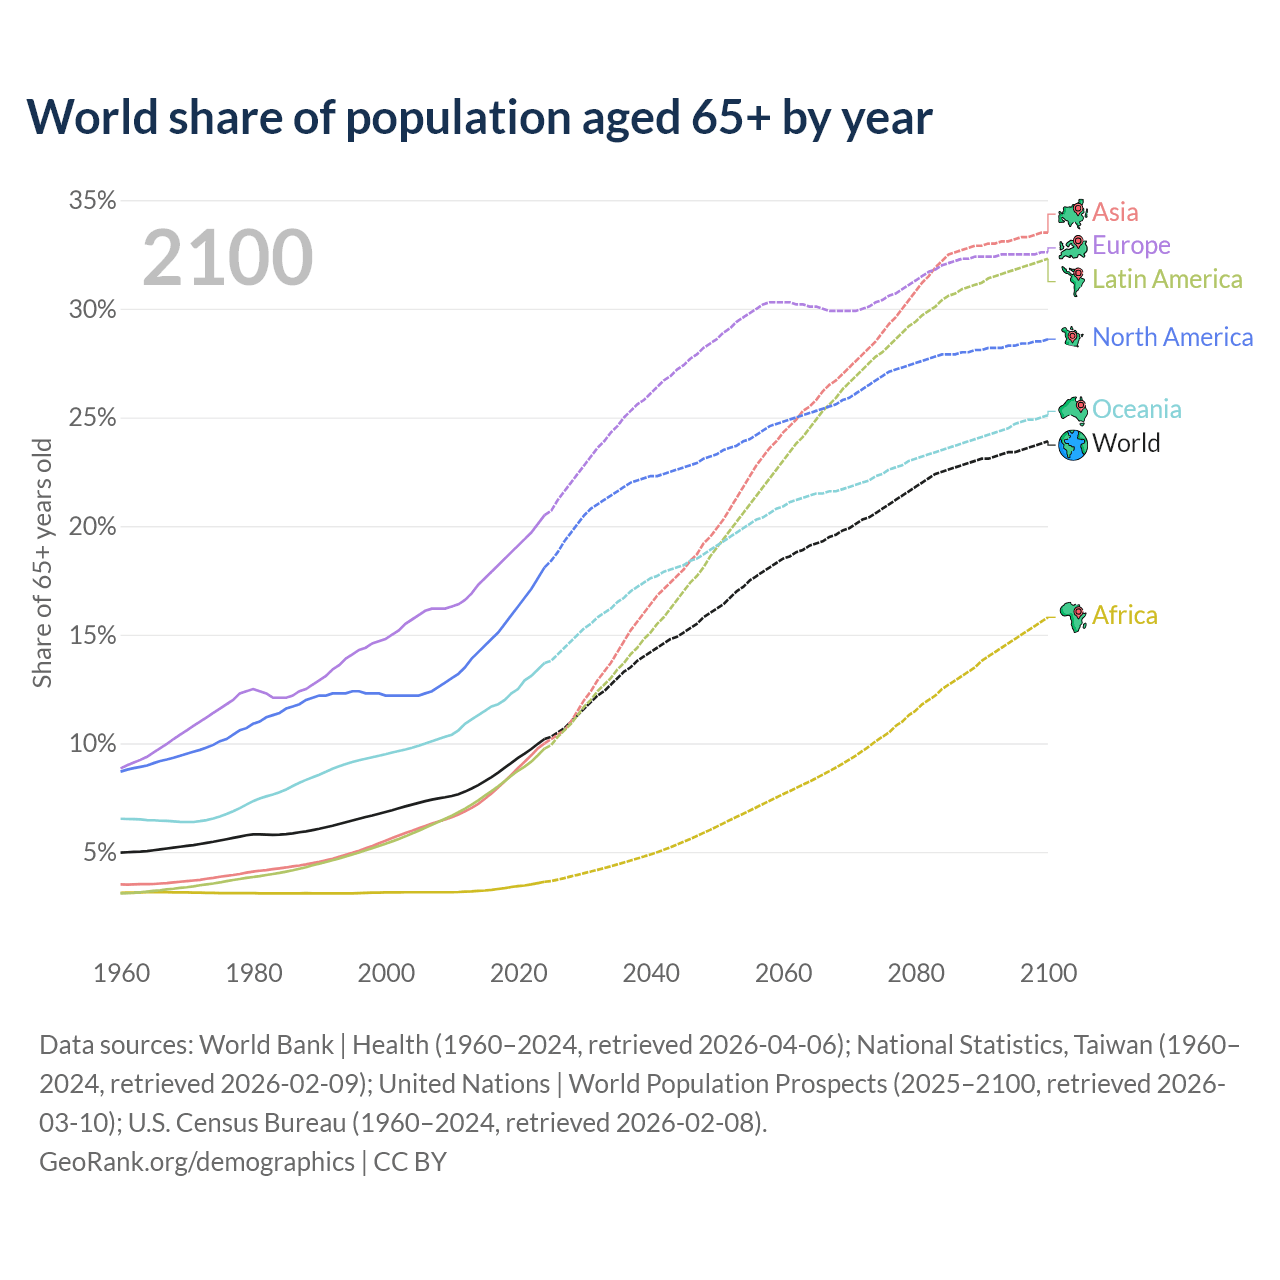
| Year | Share of 65+ years old | ||||||
|---|---|---|---|---|---|---|---|
| World | Asia | Africa | Europe | Latin America | North America | Oceania | |
| 2100 | 23.9% | 33.5% | 15.8% | 32.6% | 32.3% | 28.6% | 25.1% |
| 2099 | 23.8% | 33.4% | 15.6% | 32.6% | 32.2% | 28.5% | 25% |
| 2098 | 23.7% | 33.3% | 15.4% | 32.6% | 32.1% | 28.5% | 24.9% |
| 2097 | 23.6% | 33.3% | 15.2% | 32.5% | 32% | 28.4% | 24.8% |
| 2096 | 23.5% | 33.2% | 15% | 32.5% | 31.9% | 28.4% | 24.7% |
| 2095 | 23.4% | 33.1% | 14.8% | 32.5% | 31.8% | 28.3% | 24.6% |
| 2094 | 23.4% | 33.1% | 14.6% | 32.5% | 31.7% | 28.3% | 24.5% |
| 2093 | 23.3% | 33% | 14.4% | 32.5% | 31.6% | 28.2% | 24.4% |
| 2092 | 23.2% | 33% | 14.1% | 32.5% | 31.5% | 28.2% | 24.3% |
| 2091 | 23.1% | 32.9% | 13.9% | 32.4% | 31.3% | 28.2% | 24.2% |
| 2090 | 23.1% | 32.8% | 13.7% | 32.4% | 31.2% | 28.1% | 24.1% |
| 2089 | 23% | 32.8% | 13.5% | 32.4% | 31.1% | 28.1% | 24% |
| 2088 | 22.9% | 32.7% | 13.3% | 32.3% | 31% | 28% | 23.9% |
| 2087 | 22.8% | 32.6% | 13.1% | 32.3% | 30.8% | 28% | 23.8% |
| 2086 | 22.7% | 32.5% | 12.9% | 32.2% | 30.7% | 27.9% | 23.7% |
| 2085 | 22.6% | 32.4% | 12.7% | 32.1% | 30.6% | 27.9% | 23.6% |
| 2084 | 22.5% | 32.1% | 12.4% | 32% | 30.4% | 27.9% | 23.5% |
| 2083 | 22.4% | 31.8% | 12.2% | 31.9% | 30.1% | 27.8% | 23.4% |
| 2082 | 22.2% | 31.5% | 12% | 31.7% | 29.9% | 27.7% | 23.3% |
| 2081 | 22% | 31.1% | 11.7% | 31.5% | 29.7% | 27.6% | 23.2% |
| 2080 | 21.8% | 30.7% | 11.5% | 31.3% | 29.4% | 27.5% | 23.1% |
| 2079 | 21.6% | 30.3% | 11.2% | 31.1% | 29.1% | 27.4% | 23% |
| 2078 | 21.4% | 30% | 11% | 30.9% | 28.9% | 27.3% | 22.8% |
| 2077 | 21.2% | 29.5% | 10.8% | 30.8% | 28.6% | 27.2% | 22.7% |
| 2076 | 21% | 29.2% | 10.5% | 30.6% | 28.3% | 27.1% | 22.6% |
| 2075 | 20.8% | 28.8% | 10.3% | 30.4% | 28% | 26.9% | 22.4% |
| 2074 | 20.6% | 28.5% | 10.1% | 30.3% | 27.7% | 26.7% | 22.3% |
| 2073 | 20.4% | 28.1% | 9.84% | 30.1% | 27.5% | 26.5% | 22.1% |
| 2072 | 20.3% | 27.8% | 9.63% | 30% | 27.2% | 26.3% | 22% |
| 2071 | 20.1% | 27.5% | 9.42% | 29.9% | 26.9% | 26.1% | 21.9% |
| 2070 | 19.9% | 27.2% | 9.23% | 29.9% | 26.6% | 25.9% | 21.8% |
| 2069 | 19.8% | 27% | 9.04% | 29.9% | 26.3% | 25.8% | 21.7% |
| 2068 | 19.6% | 26.7% | 8.87% | 29.9% | 25.9% | 25.6% | 21.6% |
| 2067 | 19.5% | 26.4% | 8.7% | 29.9% | 25.6% | 25.5% | 21.6% |
| 2066 | 19.3% | 26.1% | 8.54% | 30% | 25.2% | 25.4% | 21.5% |
| 2065 | 19.2% | 25.8% | 8.38% | 30.1% | 24.9% | 25.3% | 21.4% |
| 2064 | 19.1% | 25.5% | 8.22% | 30.1% | 24.5% | 25.2% | 21.4% |
| 2063 | 18.9% | 25.2% | 8.08% | 30.2% | 24.1% | 25.1% | 21.3% |
| 2062 | 18.8% | 24.9% | 7.93% | 30.2% | 23.7% | 25% | 21.2% |
| 2061 | 18.6% | 24.5% | 7.78% | 30.3% | 23.4% | 24.9% | 21.1% |
| 2060 | 18.5% | 24.2% | 7.63% | 30.3% | 23% | 24.8% | 20.9% |
| 2059 | 18.3% | 23.9% | 7.49% | 30.3% | 22.6% | 24.7% | 20.8% |
| 2058 | 18.1% | 23.5% | 7.34% | 30.3% | 22.2% | 24.6% | 20.6% |
| 2057 | 17.9% | 23.1% | 7.19% | 30.2% | 21.8% | 24.4% | 20.4% |
| 2056 | 17.7% | 22.7% | 7.04% | 30% | 21.4% | 24.2% | 20.2% |
| 2055 | 17.5% | 22.2% | 6.89% | 29.8% | 21% | 24% | 20% |
| 2054 | 17.2% | 21.7% | 6.75% | 29.6% | 20.6% | 23.9% | 19.8% |
| 2053 | 17% | 21.2% | 6.6% | 29.4% | 20.2% | 23.7% | 19.7% |
| 2052 | 16.7% | 20.7% | 6.45% | 29.1% | 19.8% | 23.6% | 19.5% |
| 2051 | 16.4% | 20.3% | 6.3% | 28.9% | 19.3% | 23.5% | 19.3% |
| 2050 | 16.2% | 19.9% | 6.15% | 28.6% | 18.9% | 23.3% | 19.1% |
| 2049 | 16% | 19.5% | 6% | 28.4% | 18.5% | 23.2% | 18.9% |
| 2048 | 15.8% | 19.1% | 5.86% | 28.2% | 18.1% | 23.1% | 18.7% |
| 2047 | 15.5% | 18.7% | 5.72% | 27.9% | 17.7% | 22.9% | 18.5% |
| 2046 | 15.3% | 18.3% | 5.59% | 27.7% | 17.3% | 22.8% | 18.4% |
| 2045 | 15.1% | 18% | 5.45% | 27.4% | 17% | 22.7% | 18.2% |
| 2044 | 14.9% | 17.6% | 5.33% | 27.2% | 16.6% | 22.6% | 18.1% |
| 2043 | 14.8% | 17.3% | 5.2% | 26.9% | 16.2% | 22.5% | 18% |
| 2042 | 14.6% | 17% | 5.09% | 26.7% | 15.8% | 22.4% | 17.9% |
| 2041 | 14.4% | 16.7% | 4.98% | 26.4% | 15.5% | 22.3% | 17.7% |
| 2040 | 14.2% | 16.4% | 4.88% | 26.1% | 15.1% | 22.3% | 17.6% |
| 2039 | 14% | 16% | 4.78% | 25.8% | 14.8% | 22.2% | 17.4% |
| 2038 | 13.8% | 15.5% | 4.69% | 25.6% | 14.4% | 22.1% | 17.2% |
| 2037 | 13.5% | 15.1% | 4.59% | 25.3% | 14.1% | 22% | 17% |
| 2036 | 13.3% | 14.6% | 4.5% | 25% | 13.7% | 21.8% | 16.7% |
| 2035 | 13% | 14.2% | 4.42% | 24.6% | 13.4% | 21.6% | 16.5% |
| 2034 | 12.7% | 13.7% | 4.33% | 24.3% | 13% | 21.4% | 16.2% |
| 2033 | 12.4% | 13.2% | 4.25% | 23.9% | 12.7% | 21.2% | 16% |
| 2032 | 12.2% | 12.8% | 4.17% | 23.6% | 12.3% | 21% | 15.8% |
| 2031 | 11.9% | 12.4% | 4.09% | 23.2% | 12% | 20.8% | 15.5% |
| 2030 | 11.6% | 11.9% | 4.02% | 22.8% | 11.6% | 20.5% | 15.3% |
| 2029 | 11.3% | 11.5% | 3.94% | 22.4% | 11.3% | 20.1% | 15% |
| 2028 | 11% | 11% | 3.87% | 22% | 10.9% | 19.7% | 14.7% |
| 2027 | 10.7% | 10.6% | 3.79% | 21.6% | 10.6% | 19.3% | 14.4% |
| 2026 | 10.5% | 10.4% | 3.72% | 21.2% | 10.2% | 18.8% | 14.1% |
| 2025 | 10.4% | 10.3% | 3.69% | 21% | 10.1% | 18.6% | 13.9% |
| 2024 | 10.2% | 10% | 3.63% | 20.5% | 9.75% | 18.1% | 13.6% |
| 2023 | 9.98% | 9.73% | 3.56% | 20.1% | 9.44% | 17.6% | 13.4% |
| 2022 | 9.74% | 9.42% | 3.5% | 19.7% | 9.15% | 17.1% | 13.1% |
| 2021 | 9.53% | 9.12% | 3.46% | 19.4% | 8.92% | 16.7% | 12.8% |
| 2020 | 9.33% | 8.85% | 3.43% | 19.1% | 8.73% | 16.3% | 12.5% |
| 2019 | 9.11% | 8.54% | 3.39% | 18.8% | 8.5% | 15.9% | 12.2% |
| 2018 | 8.88% | 8.23% | 3.34% | 18.5% | 8.25% | 15.5% | 12% |
| 2017 | 8.66% | 7.94% | 3.29% | 18.2% | 8.02% | 15.1% | 11.8% |
| 2016 | 8.45% | 7.68% | 3.26% | 17.9% | 7.79% | 14.8% | 11.6% |
| 2015 | 8.26% | 7.43% | 3.23% | 17.6% | 7.58% | 14.5% | 11.5% |
| 2014 | 8.08% | 7.2% | 3.21% | 17.3% | 7.37% | 14.2% | 11.3% |
| 2013 | 7.92% | 7.01% | 3.19% | 16.9% | 7.17% | 13.9% | 11.1% |
| 2012 | 7.78% | 6.85% | 3.18% | 16.6% | 6.99% | 13.5% | 10.9% |
| 2011 | 7.66% | 6.7% | 3.16% | 16.4% | 6.82% | 13.2% | 10.6% |
| 2010 | 7.58% | 6.58% | 3.15% | 16.3% | 6.67% | 13% | 10.4% |
| 2009 | 7.52% | 6.48% | 3.15% | 16.2% | 6.52% | 12.8% | 10.3% |
| 2008 | 7.47% | 6.39% | 3.15% | 16.2% | 6.38% | 12.6% | 10.1% |
| 2007 | 7.41% | 6.29% | 3.15% | 16.2% | 6.25% | 12.4% | 10.1% |
| 2006 | 7.34% | 6.19% | 3.15% | 16.1% | 6.11% | 12.3% | 9.98% |
| 2005 | 7.26% | 6.08% | 3.15% | 15.9% | 5.98% | 12.2% | 9.89% |
| 2004 | 7.18% | 5.97% | 3.15% | 15.7% | 5.85% | 12.2% | 9.8% |
| 2003 | 7.1% | 5.86% | 3.15% | 15.5% | 5.72% | 12.2% | 9.71% |
| 2002 | 7.01% | 5.74% | 3.14% | 15.2% | 5.6% | 12.2% | 9.64% |
| 2001 | 6.92% | 5.62% | 3.14% | 15% | 5.48% | 12.2% | 9.57% |
| 2000 | 6.84% | 5.51% | 3.13% | 14.8% | 5.38% | 12.2% | 9.49% |
| 1999 | 6.76% | 5.39% | 3.13% | 14.7% | 5.27% | 12.3% | 9.42% |
| 1998 | 6.68% | 5.27% | 3.13% | 14.6% | 5.18% | 12.3% | 9.36% |
| 1997 | 6.61% | 5.16% | 3.12% | 14.4% | 5.08% | 12.3% | 9.28% |
| 1996 | 6.53% | 5.05% | 3.11% | 14.3% | 4.98% | 12.4% | 9.21% |
| 1995 | 6.45% | 4.95% | 3.1% | 14.1% | 4.88% | 12.4% | 9.13% |
| 1994 | 6.37% | 4.86% | 3.1% | 13.9% | 4.79% | 12.3% | 9.05% |
| 1993 | 6.29% | 4.77% | 3.1% | 13.6% | 4.7% | 12.3% | 8.94% |
| 1992 | 6.21% | 4.68% | 3.1% | 13.4% | 4.62% | 12.3% | 8.82% |
| 1991 | 6.14% | 4.61% | 3.09% | 13.1% | 4.54% | 12.2% | 8.69% |
| 1990 | 6.07% | 4.54% | 3.1% | 12.9% | 4.46% | 12.2% | 8.55% |
| 1989 | 6.01% | 4.48% | 3.1% | 12.7% | 4.38% | 12.1% | 8.43% |
| 1988 | 5.96% | 4.42% | 3.1% | 12.6% | 4.3% | 12% | 8.32% |
| 1987 | 5.91% | 4.37% | 3.1% | 12.4% | 4.23% | 11.8% | 8.19% |
| 1986 | 5.86% | 4.33% | 3.1% | 12.2% | 4.15% | 11.7% | 8.03% |
| 1985 | 5.82% | 4.29% | 3.1% | 12.1% | 4.09% | 11.6% | 7.87% |
| 1984 | 5.8% | 4.24% | 3.1% | 12.1% | 4.04% | 11.4% | 7.74% |
| 1983 | 5.79% | 4.2% | 3.1% | 12.1% | 3.99% | 11.3% | 7.64% |
| 1982 | 5.8% | 4.17% | 3.1% | 12.3% | 3.94% | 11.2% | 7.55% |
| 1981 | 5.81% | 4.13% | 3.1% | 12.4% | 3.89% | 11% | 7.45% |
| 1980 | 5.81% | 4.09% | 3.11% | 12.5% | 3.85% | 10.9% | 7.33% |
| 1979 | 5.77% | 4.04% | 3.11% | 12.4% | 3.81% | 10.7% | 7.18% |
| 1978 | 5.71% | 3.99% | 3.11% | 12.3% | 3.76% | 10.6% | 7.02% |
| 1977 | 5.65% | 3.94% | 3.11% | 12% | 3.71% | 10.4% | 6.88% |
| 1976 | 5.59% | 3.9% | 3.11% | 11.8% | 3.65% | 10.2% | 6.75% |
| 1975 | 5.53% | 3.85% | 3.11% | 11.6% | 3.6% | 10.1% | 6.63% |
| 1974 | 5.47% | 3.81% | 3.12% | 11.4% | 3.55% | 9.93% | 6.53% |
| 1973 | 5.42% | 3.76% | 3.12% | 11.2% | 3.51% | 9.81% | 6.47% |
| 1972 | 5.37% | 3.72% | 3.13% | 11% | 3.47% | 9.7% | 6.41% |
| 1971 | 5.32% | 3.69% | 3.13% | 10.8% | 3.42% | 9.61% | 6.38% |
| 1970 | 5.28% | 3.66% | 3.14% | 10.6% | 3.38% | 9.52% | 6.37% |
| 1969 | 5.24% | 3.63% | 3.14% | 10.4% | 3.35% | 9.42% | 6.38% |
| 1968 | 5.2% | 3.6% | 3.14% | 10.2% | 3.31% | 9.34% | 6.4% |
| 1967 | 5.16% | 3.57% | 3.15% | 9.98% | 3.28% | 9.26% | 6.42% |
| 1966 | 5.12% | 3.55% | 3.15% | 9.78% | 3.24% | 9.19% | 6.44% |
| 1965 | 5.08% | 3.53% | 3.15% | 9.58% | 3.21% | 9.08% | 6.45% |
| 1964 | 5.04% | 3.52% | 3.14% | 9.38% | 3.18% | 8.98% | 6.47% |
| 1963 | 5.02% | 3.51% | 3.14% | 9.24% | 3.15% | 8.92% | 6.49% |
| 1962 | 5.01% | 3.51% | 3.13% | 9.12% | 3.12% | 8.86% | 6.5% |
| 1961 | 4.99% | 3.5% | 3.12% | 8.99% | 3.11% | 8.79% | 6.51% |
| 1960 | 4.97% | 3.51% | 3.12% | 8.85% | 3.1% | 8.7% | 6.53% |
Data sources: World Bank | Health (1960–2025, retrieved 2026-07-08); National Statistics, Taiwan (1960–2025, retrieved 2026-07-08); United Nations | World Population Prospects (2026–2100, retrieved 2026-07-08); U.S. Census Bureau (1960–2025, retrieved 2026-07-08).
GeoRank.org/demographics | CC BY
The share of the old demographic is growing all over the world as life expectancy increases and the fertility rate declines. The percentage of old people (65+) is 10.4% today, it was 4.97% in 1960 and is projected to be 16.2% by 2050.
Religion demographics in the World
|
World
|
|
|---|---|
| Religion | Share of population |
| Christianity | 2.41B (29%) |
| Islam | 2.21B (26.6%) |
| Atheism | 1.92B (23.1%) |
| Hinduism | 1.25B (15%) |
| Buddhism | 331M (3.98%) |
| Judaism | 16.1M (0.19%) |
| All other | 180M (2.16%) |
Help us show the world through your eyes
Share a photo of your city and help others discover what it looks like to live there. Your contribution makes our data come alive.
Data sources:
- World Bank | Health (1960–2025, retrieved 2026-07-08)
- National Statistics, Taiwan (1960–2025, retrieved 2026-07-08)
- United Nations | World Population Prospects (2026–2100, retrieved 2026-07-08)
- U.S. Census Bureau (1960–2025, retrieved 2026-07-08)
- Pew Research Center (2020, retrieved 2026-07-08)
- Central Intelligence Agency (CIA) (2025, retrieved 2026-07-08)
Creative Commons Attribution (CC BY) — you’re free to copy, share, remix, adapt, and use even commercially as long as you give appropriate credit and clearly indicate if you made changes. Other sources may be subject to different license terms.