The Cayman Islands is a high-income country with a population of 75.8K people. The capital and largest city is George Town, with 40.2K residents.
The Cayman Islands ranks 158/197 by GDP ($7.77B) and 6/197 by GDP per capita ($104,293). The top category for both exports and imports is business & finance services.
Main facts and rankings
 Cayman Islands
|
Rank | |
|---|---|---|
| Population |
77917
|
187/197 |
| GDP |
$7.77B
2024 |
158/197 |
| GDP per capita |
$104,293
2024 |
6/197 |
| GDP per capita, PPP |
$88,428
2023 |
10/197 |
| Average annual personal income after taxes |
$94,558
2026 |
3/197 |
| Land area | 92.7 sq mi | 190/197 |
| Population density | 833 ppl/mi² | 31/197 |
| Fertility rate | 1.53 | 135/196 |
| Median age | 39.7 years | 50/196 |
| Life expectancy | 80.9 years | 42/197 |
Cayman Islands trends dashboard: time-series charts
The Cayman Islands' economy ranked
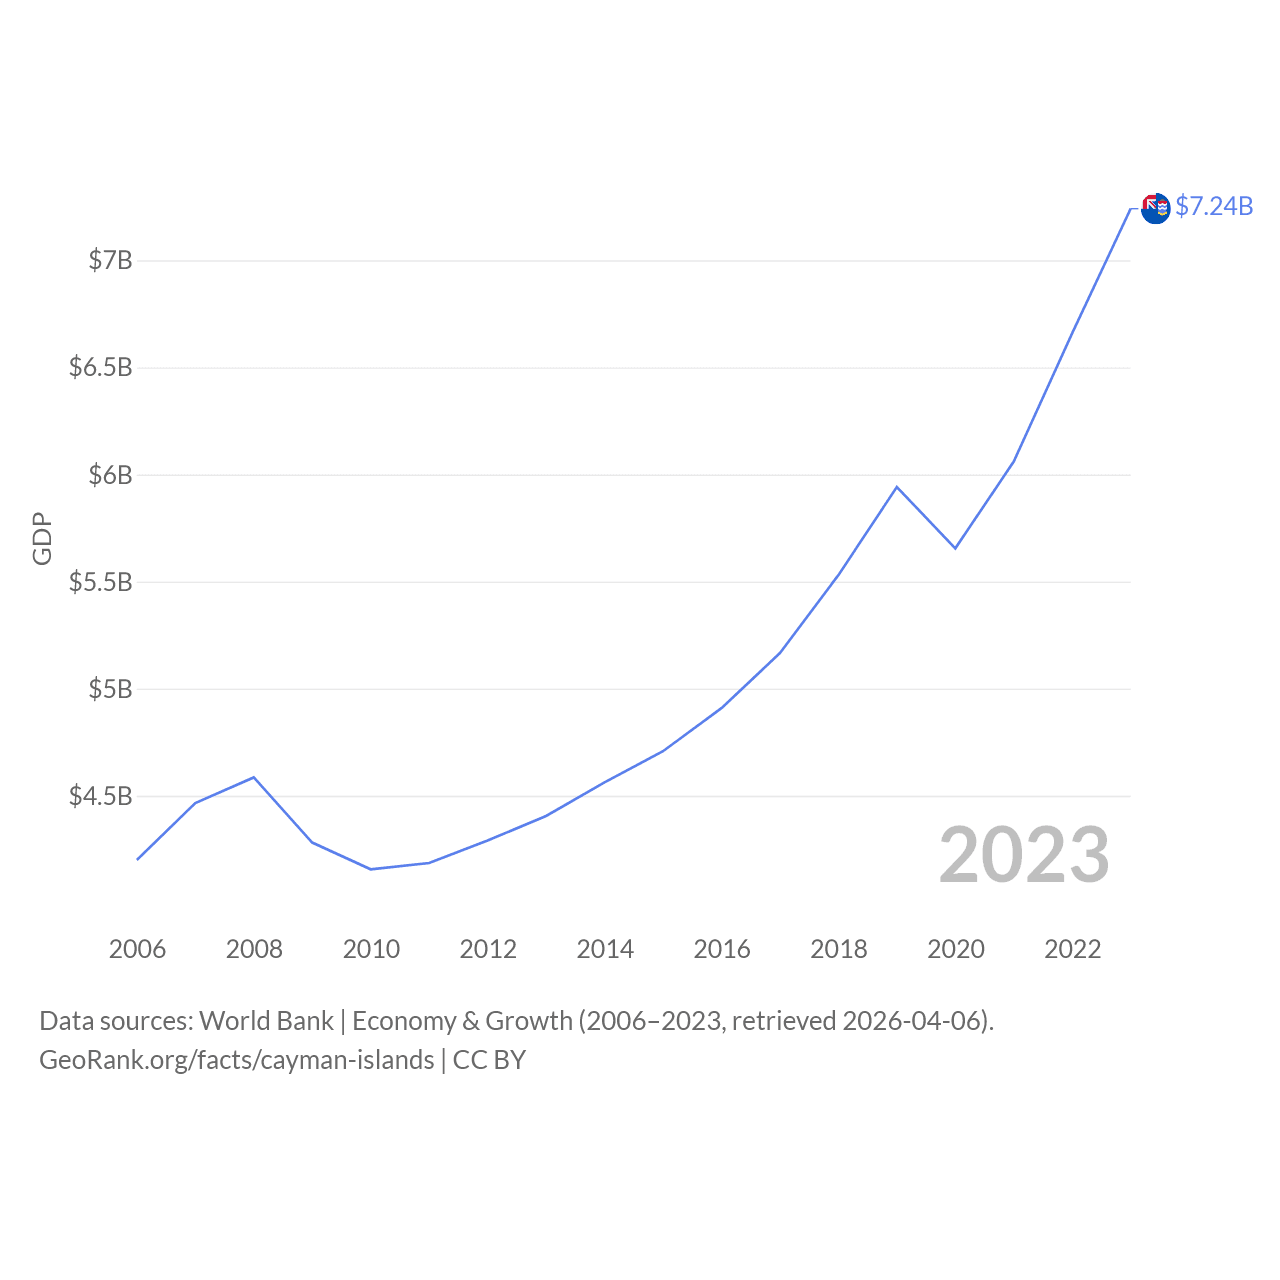
| Year | GDP |
|---|---|
| 2024 | $7,765,336,505 |
| 2023 | $7,308,564,549 |
| 2022 | $6,653,516,041 |
| 2021 | $6,060,813,808 |
| 2020 | $5,655,357,984 |
| 2019 | $5,941,896,608 |
| 2018 | $5,530,178,441 |
| 2017 | $5,166,281,305 |
| 2016 | $4,909,322,237 |
| 2015 | $4,708,167,233 |
| 2014 | $4,562,853,611 |
| 2013 | $4,405,796,023 |
| 2012 | $4,291,004,524 |
| 2011 | $4,186,073,104 |
| 2010 | $4,156,841,107 |
| 2009 | $4,281,714,567 |
| 2008 | $4,585,949,024 |
| 2007 | $4,466,278,065 |
| 2006 | $4,200,288,241 |
Data sources: World Bank | Economy & Growth (2006–2024, retrieved 2026-07-08).
GeoRank.org/facts/cayman-islands | CC BY 
The Cayman Islands' economy ranked
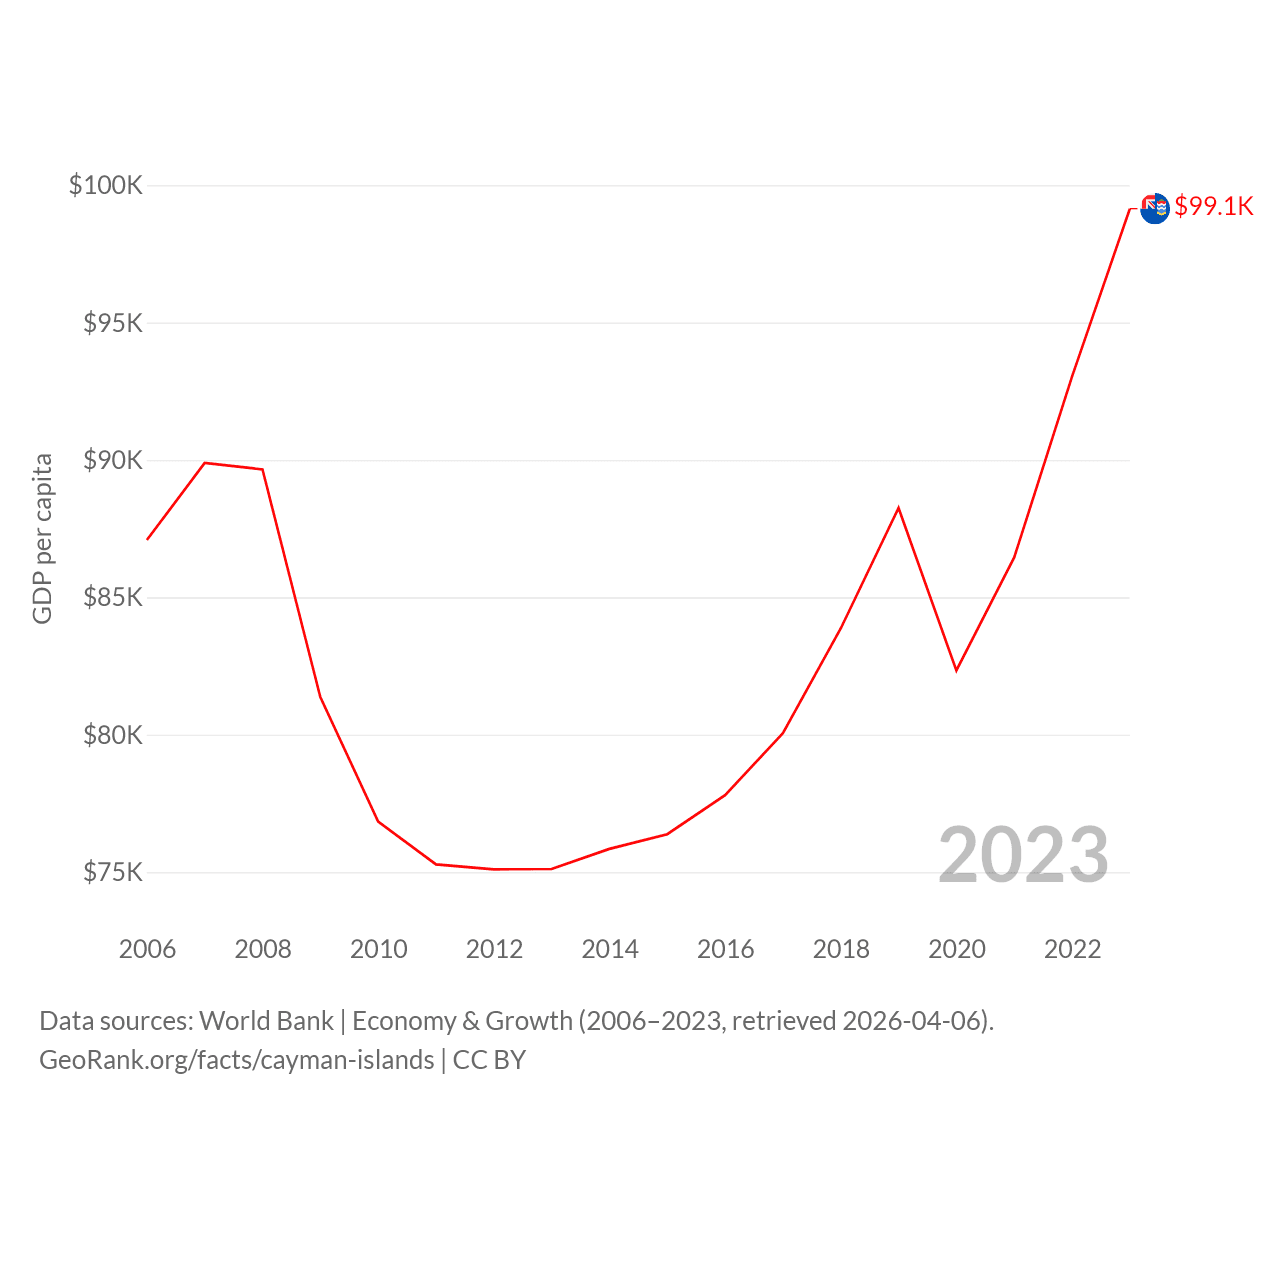
| Year | GDP per capita |
|---|---|
| 2024 | $104,293 |
| 2023 | $100,065 |
| 2022 | $92,938 |
| 2021 | $86,450 |
| 2020 | $82,339 |
| 2019 | $88,254 |
| 2018 | $83,866 |
| 2017 | $80,054 |
| 2016 | $77,802 |
| 2015 | $76,379 |
| 2014 | $75,845 |
| 2013 | $75,114 |
| 2012 | $75,102 |
| 2011 | $75,281 |
| 2010 | $76,838 |
| 2009 | $81,374 |
| 2008 | $89,655 |
| 2007 | $89,888 |
| 2006 | $87,085 |
Data sources: World Bank | Economy & Growth (2006–2024, retrieved 2026-07-08).
GeoRank.org/facts/cayman-islands | CC BY
The Cayman Islands' life expectancy calculator
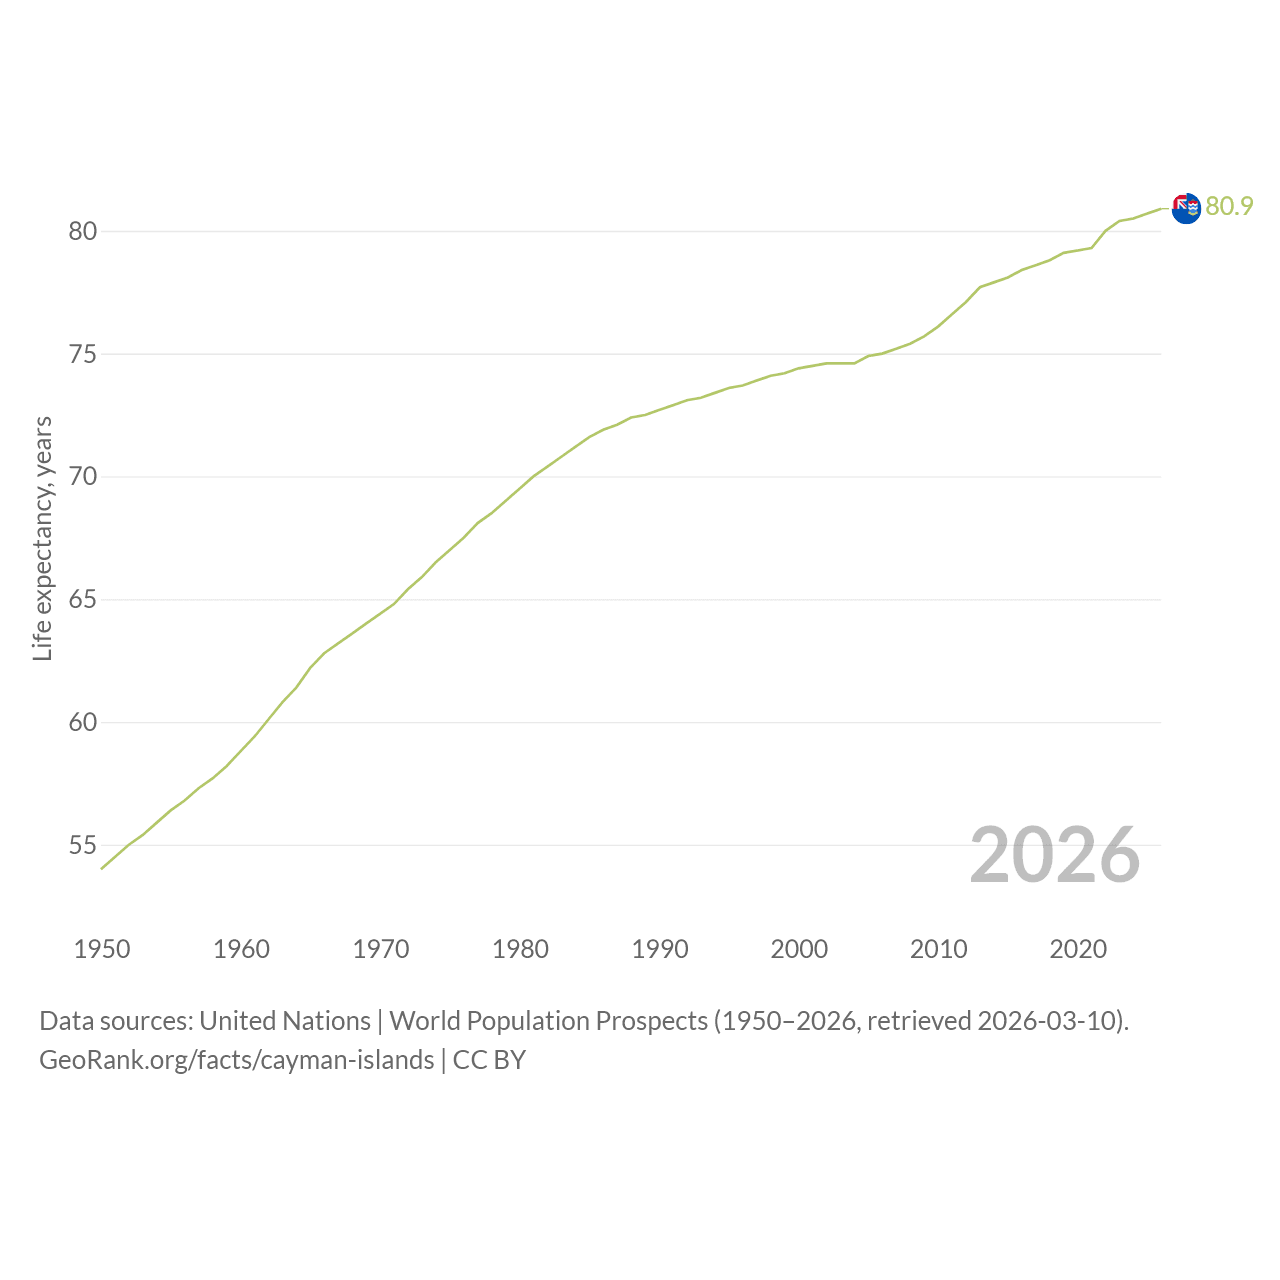
| Year | Life expectancy, years |
|---|---|
| 2026 | 80.9 |
| 2025 | 80.7 |
| 2024 | 80.5 |
| 2023 | 80.4 |
| 2022 | 80 |
| 2021 | 79.3 |
| 2020 | 79.2 |
| 2019 | 79.1 |
| 2018 | 78.8 |
| 2017 | 78.6 |
| 2016 | 78.4 |
| 2015 | 78.1 |
| 2014 | 77.9 |
| 2013 | 77.7 |
| 2012 | 77.1 |
| 2011 | 76.6 |
| 2010 | 76.1 |
| 2009 | 75.7 |
| 2008 | 75.4 |
| 2007 | 75.2 |
| 2006 | 75 |
| 2005 | 74.9 |
| 2004 | 74.6 |
| 2003 | 74.6 |
| 2002 | 74.6 |
| 2001 | 74.5 |
| 2000 | 74.4 |
| 1999 | 74.2 |
| 1998 | 74.1 |
| 1997 | 73.9 |
| 1996 | 73.7 |
| 1995 | 73.6 |
| 1994 | 73.4 |
| 1993 | 73.2 |
| 1992 | 73.1 |
| 1991 | 72.9 |
| 1990 | 72.7 |
| 1989 | 72.5 |
| 1988 | 72.4 |
| 1987 | 72.1 |
| 1986 | 71.9 |
| 1985 | 71.6 |
| 1984 | 71.2 |
| 1983 | 70.8 |
| 1982 | 70.4 |
| 1981 | 70 |
| 1980 | 69.5 |
| 1979 | 69 |
| 1978 | 68.5 |
| 1977 | 68.1 |
| 1976 | 67.5 |
| 1975 | 67 |
| 1974 | 66.5 |
| 1973 | 65.9 |
| 1972 | 65.4 |
| 1971 | 64.8 |
| 1970 | 64.4 |
| 1969 | 64 |
| 1968 | 63.6 |
| 1967 | 63.2 |
| 1966 | 62.8 |
| 1965 | 62.2 |
| 1964 | 61.4 |
| 1963 | 60.8 |
| 1962 | 60.1 |
| 1961 | 59.4 |
| 1960 | 58.8 |
| 1959 | 58.2 |
| 1958 | 57.7 |
| 1957 | 57.3 |
| 1956 | 56.8 |
| 1955 | 56.4 |
| 1954 | 55.9 |
| 1953 | 55.4 |
| 1952 | 55 |
| 1951 | 54.5 |
| 1950 | 54 |
Data sources: United Nations | World Population Prospects (1950–2026, retrieved 2026-07-08).
GeoRank.org/facts/cayman-islands | CC BY
The Cayman Islands' population clock and projection
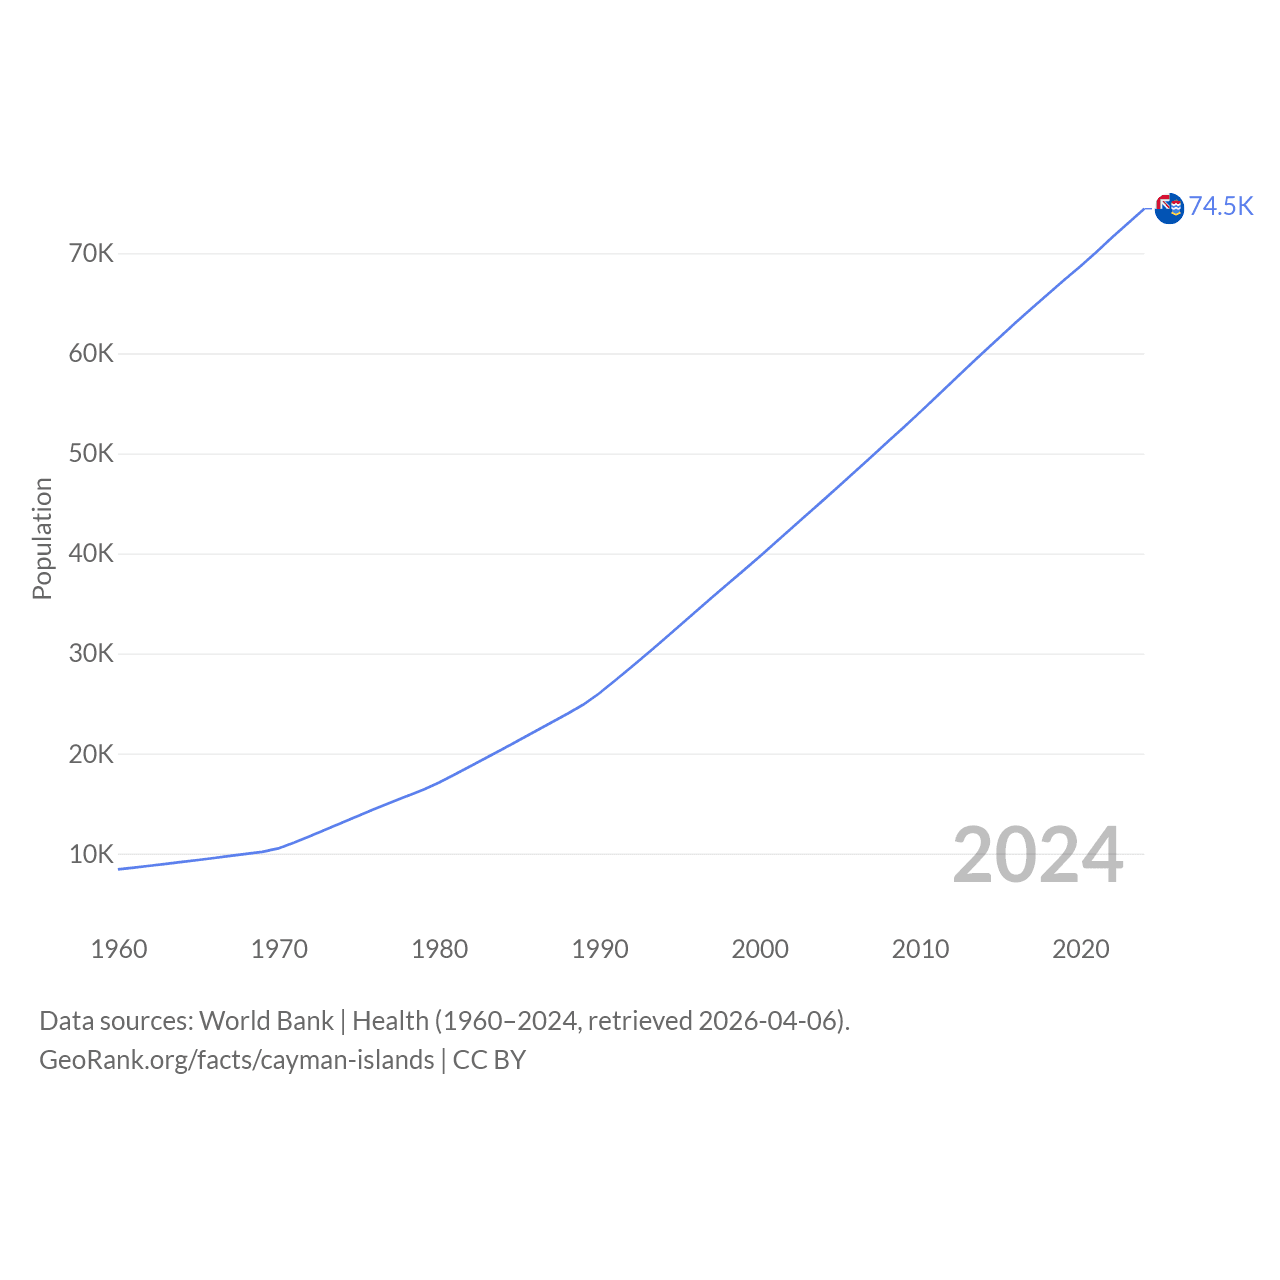
| Year | Population |
|---|---|
| 2025 | 75,844 |
| 2024 | 74,457 |
| 2023 | 73,038 |
| 2022 | 71,591 |
| 2021 | 70,108 |
| 2020 | 68,684 |
| 2019 | 67,327 |
| 2018 | 65,941 |
| 2017 | 64,535 |
| 2016 | 63,100 |
| 2015 | 61,642 |
| 2014 | 60,160 |
| 2013 | 58,655 |
| 2012 | 57,136 |
| 2011 | 55,606 |
| 2010 | 54,099 |
| 2009 | 52,618 |
| 2008 | 51,151 |
| 2007 | 49,687 |
| 2006 | 48,232 |
| 2005 | 46,788 |
| 2004 | 45,352 |
| 2003 | 43,934 |
| 2002 | 42,514 |
| 2001 | 41,089 |
| 2000 | 39,674 |
| 1999 | 38,284 |
| 1998 | 36,922 |
| 1997 | 35,543 |
| 1996 | 34,143 |
| 1995 | 32,743 |
| 1994 | 31,352 |
| 1993 | 29,976 |
| 1992 | 28,621 |
| 1991 | 27,294 |
| 1990 | 25,999 |
| 1989 | 24,874 |
| 1988 | 23,951 |
| 1987 | 23,073 |
| 1986 | 22,197 |
| 1985 | 21,324 |
| 1984 | 20,454 |
| 1983 | 19,598 |
| 1982 | 18,750 |
| 1981 | 17,905 |
| 1980 | 17,079 |
| 1979 | 16,351 |
| 1978 | 15,727 |
| 1977 | 15,105 |
| 1976 | 14,454 |
| 1975 | 13,788 |
| 1974 | 13,114 |
| 1973 | 12,438 |
| 1972 | 11,764 |
| 1971 | 11,098 |
| 1970 | 10,517 |
| 1969 | 10,165 |
| 1968 | 9,971 |
| 1967 | 9,769 |
| 1966 | 9,560 |
| 1965 | 9,361 |
| 1964 | 9,166 |
| 1963 | 8,970 |
| 1962 | 8,781 |
| 1961 | 8,601 |
| 1960 | 8,428 |
Data sources: World Bank | Health (1960–2025, retrieved 2026-07-08).
GeoRank.org/facts/cayman-islands | CC BY
The Cayman Islands' birth and fertility rates
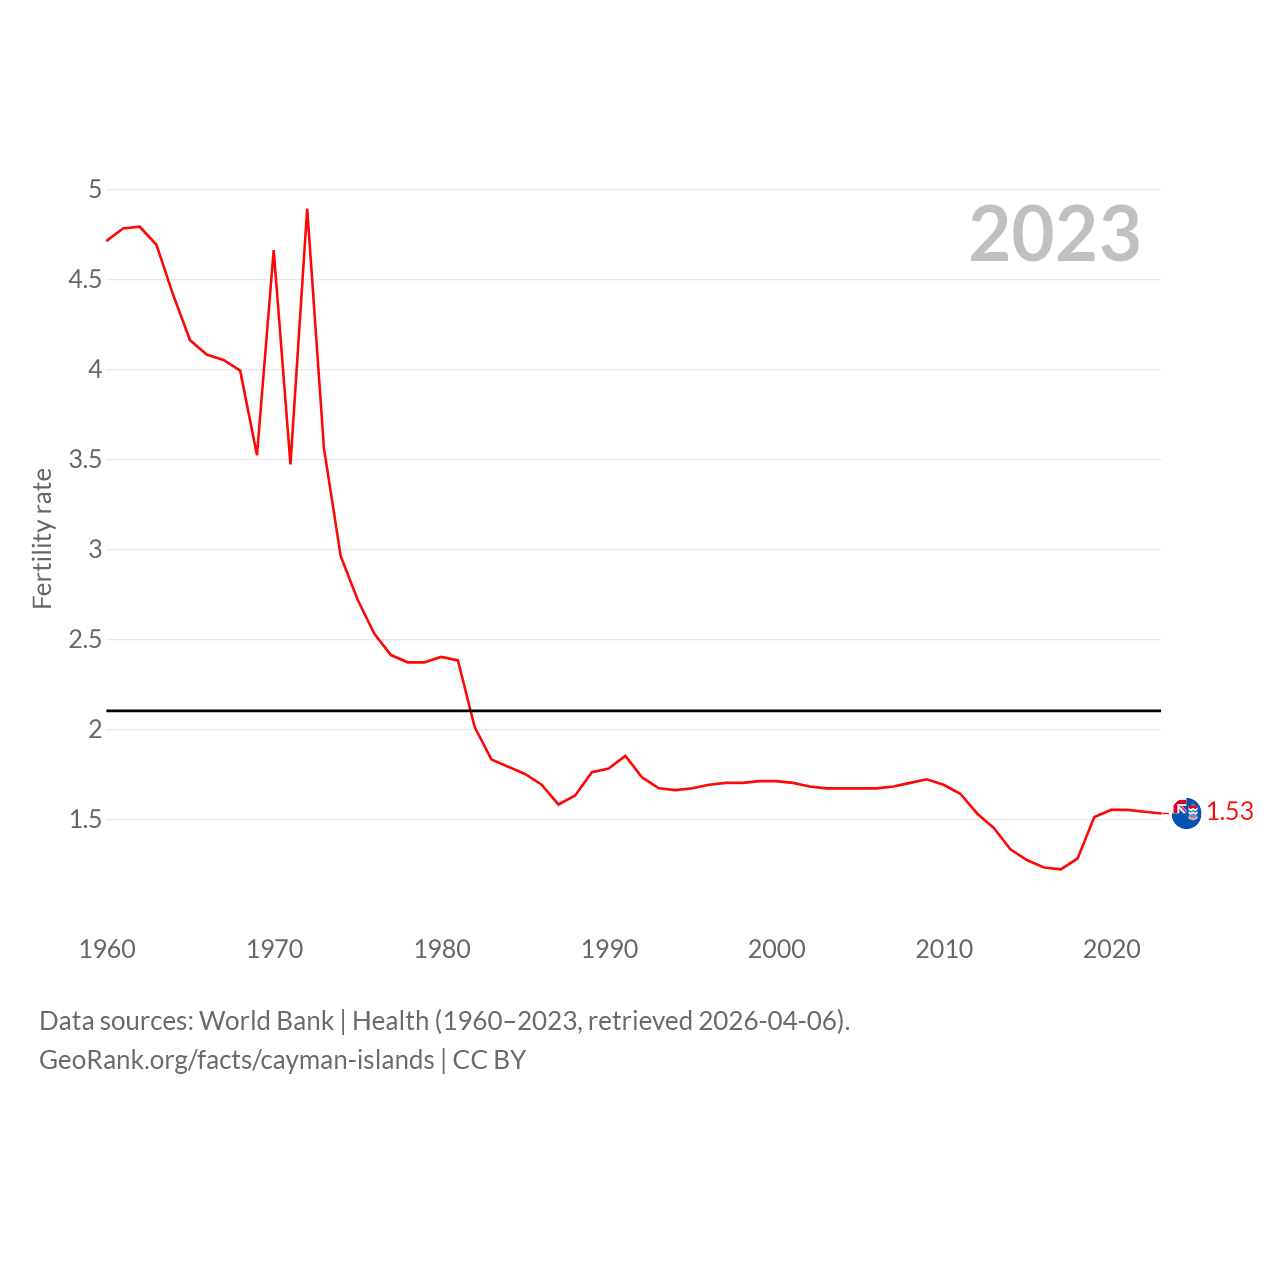
| Year | Fertility rate |
|---|---|
| 2024 | 1.53 |
| 2023 | 1.53 |
| 2022 | 1.54 |
| 2021 | 1.55 |
| 2020 | 1.55 |
| 2019 | 1.51 |
| 2018 | 1.28 |
| 2017 | 1.22 |
| 2016 | 1.23 |
| 2015 | 1.27 |
| 2014 | 1.33 |
| 2013 | 1.45 |
| 2012 | 1.53 |
| 2011 | 1.64 |
| 2010 | 1.69 |
| 2009 | 1.72 |
| 2008 | 1.7 |
| 2007 | 1.68 |
| 2006 | 1.67 |
| 2005 | 1.67 |
| 2004 | 1.67 |
| 2003 | 1.67 |
| 2002 | 1.68 |
| 2001 | 1.7 |
| 2000 | 1.71 |
| 1999 | 1.71 |
| 1998 | 1.7 |
| 1997 | 1.7 |
| 1996 | 1.69 |
| 1995 | 1.67 |
| 1994 | 1.66 |
| 1993 | 1.67 |
| 1992 | 1.73 |
| 1991 | 1.85 |
| 1990 | 1.78 |
| 1989 | 1.76 |
| 1988 | 1.63 |
| 1987 | 1.58 |
| 1986 | 1.69 |
| 1985 | 1.75 |
| 1984 | 1.79 |
| 1983 | 1.83 |
| 1982 | 2.01 |
| 1981 | 2.38 |
| 1980 | 2.4 |
| 1979 | 2.37 |
| 1978 | 2.37 |
| 1977 | 2.41 |
| 1976 | 2.53 |
| 1975 | 2.72 |
| 1974 | 2.96 |
| 1973 | 3.56 |
| 1972 | 4.89 |
| 1971 | 3.47 |
| 1970 | 4.66 |
| 1969 | 3.52 |
| 1968 | 3.99 |
| 1967 | 4.05 |
| 1966 | 4.08 |
| 1965 | 4.16 |
| 1964 | 4.41 |
| 1963 | 4.69 |
| 1962 | 4.79 |
| 1961 | 4.78 |
| 1960 | 4.71 |
Data sources: World Bank | Health (1960–2024, retrieved 2026-07-08).
GeoRank.org/facts/cayman-islands | CC BY
The Cayman Islands' demographics
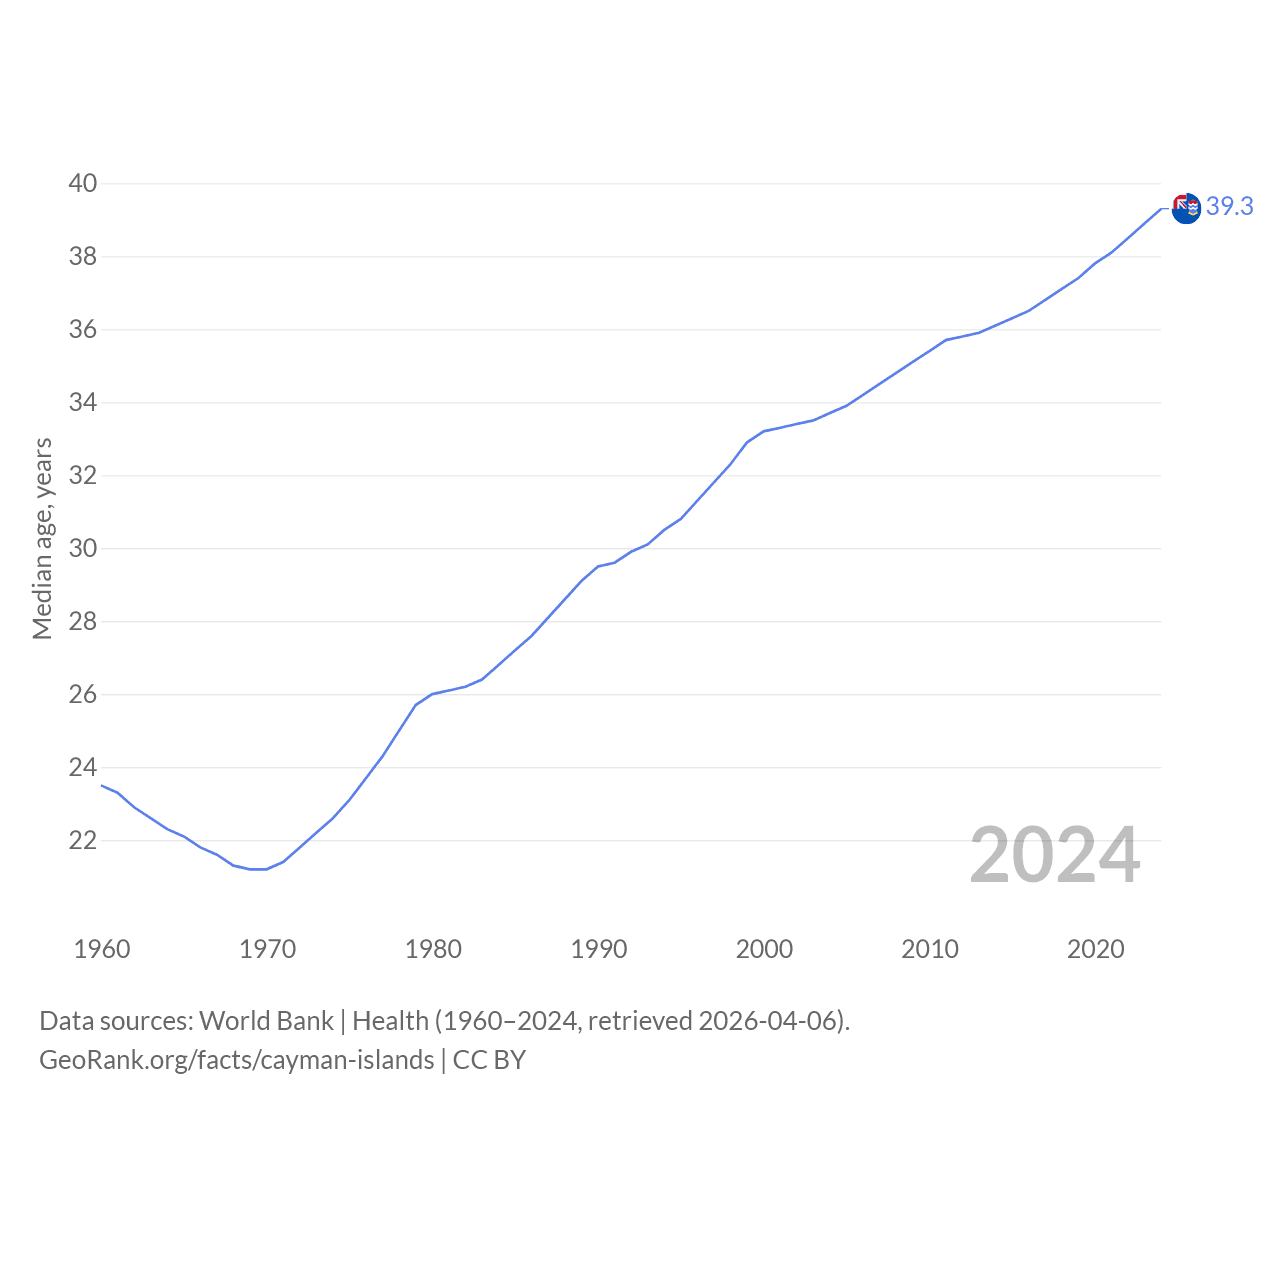
| Year | Median age, years |
|---|---|
| 2025 | 39.7 |
| 2024 | 39.3 |
| 2023 | 38.9 |
| 2022 | 38.5 |
| 2021 | 38.1 |
| 2020 | 37.8 |
| 2019 | 37.4 |
| 2018 | 37.1 |
| 2017 | 36.8 |
| 2016 | 36.5 |
| 2015 | 36.3 |
| 2014 | 36.1 |
| 2013 | 35.9 |
| 2012 | 35.8 |
| 2011 | 35.7 |
| 2010 | 35.4 |
| 2009 | 35.1 |
| 2008 | 34.8 |
| 2007 | 34.5 |
| 2006 | 34.2 |
| 2005 | 33.9 |
| 2004 | 33.7 |
| 2003 | 33.5 |
| 2002 | 33.4 |
| 2001 | 33.3 |
| 2000 | 33.2 |
| 1999 | 32.9 |
| 1998 | 32.3 |
| 1997 | 31.8 |
| 1996 | 31.3 |
| 1995 | 30.8 |
| 1994 | 30.5 |
| 1993 | 30.1 |
| 1992 | 29.9 |
| 1991 | 29.6 |
| 1990 | 29.5 |
| 1989 | 29.1 |
| 1988 | 28.6 |
| 1987 | 28.1 |
| 1986 | 27.6 |
| 1985 | 27.2 |
| 1984 | 26.8 |
| 1983 | 26.4 |
| 1982 | 26.2 |
| 1981 | 26.1 |
| 1980 | 26 |
| 1979 | 25.7 |
| 1978 | 25 |
| 1977 | 24.3 |
| 1976 | 23.7 |
| 1975 | 23.1 |
| 1974 | 22.6 |
| 1973 | 22.2 |
| 1972 | 21.8 |
| 1971 | 21.4 |
| 1970 | 21.2 |
| 1969 | 21.2 |
| 1968 | 21.3 |
| 1967 | 21.6 |
| 1966 | 21.8 |
| 1965 | 22.1 |
| 1964 | 22.3 |
| 1963 | 22.6 |
| 1962 | 22.9 |
| 1961 | 23.3 |
| 1960 | 23.5 |
Data sources: World Bank | Health (1960–2025, retrieved 2026-07-08).
GeoRank.org/facts/cayman-islands | CC BY
Cayman Islands vs. World: Interactive Maps
Use the buttons below to toggle between world maps that display different statistics comparing the Cayman Islands with other countries.
Cayman Islands: National Statistics
Finance
|
Cayman Islands
|
Rank | |
|---|---|---|
| GNI, Atlas method |
$6.1B
2024 |
157/194 |
| Government expenditure, % of GDP |
14%
2026 |
187/195 |
| Education expenditure, % of GDP |
1.57%
2023 |
183/193 |
| Unemployment rate |
4.2%
2015 |
127/196 |
| Services, % of GDP |
86.5%
2024 |
2/191 |
| Industry, % of GDP |
7.64%
2024 |
191/194 |
| Economic freedom index |
74
2026 |
22/197 |
| Listed domestic companies |
4
2020 |
103/103 |
| Market capitalization of domestic companies |
$644M
2020 |
96/100 |
| Total reserves including gold |
$252M
2024 |
169/177 |
| Personal remittances received |
$11.5M
2024 |
178/191 |
| International tourist arrivals |
660,000
2020 |
110/188 |
| International tourism as share of exports |
22.9%
2019 |
33/184 |
Energy
|
Cayman Islands
|
Rank | |
|---|---|---|
| Carbon dioxide (CO2) emissions |
0.37 megatons
2024 |
170/187 |
| CO2 emissions per capita |
5 tons
2024 |
51/187 |
| Renewable energy use share |
0%
2022 |
192/193 |
| Renewable electricity output share |
2.94%
2021 |
170/192 |
| Hydroelectric share |
0%
2021 |
156/192 |
| Nuclear share |
0%
2021 |
58/192 |
| Electricity access |
100%
2023 |
20/195 |
Society
|
Cayman Islands
|
Rank | |
|---|---|---|
| % of world population |
0.0009%
2025 |
187/197 |
| Annual migration change |
+888
2025 |
65/196 |
| Urban population |
100%
2025 |
1/195 |
| Male:Female ratio |
50.2:49.8
2025 |
N/A |
| Quality of life index |
85.3
2026 |
25/197 |
| Corruption Perceptions Index |
76
2026 |
17/197 |
| Higher education index |
13
2026 |
161/183 |
| Homicides per 100K people |
4.37
2020 |
81/197 |
| Road traffic mortality per 100K people |
14
2026 |
102/197 |
| Adult literacy rate |
98.9%
2017 |
61/196 |
| English speaking |
88.8%
2026 |
18/197 |
| People using the Internet |
81.1%
2017 |
98/195 |
Health
|
Cayman Islands
|
Rank | |
|---|---|---|
| Life expectancy |
80.9 years
2026 |
42/197 |
| Physicians per 1,000 people |
1.94
1997 |
88/193 |
| Diabetes prevalence |
11.1%
2024 |
60/195 |
| Air quality index |
78
2026 |
46/197 |
Territory
|
Cayman Islands
|
Rank | |
|---|---|---|
| % of world land |
0.0002%
2026 |
190/197 |
| Land area per capita |
1,222 sq mi
2025 |
166/197 |
| Agricultural land area |
10.4 sq mi
2026 |
189/194 |
| Forest area |
48.6 sq mi
2026 |
176/196 |
| Roads length |
488 mi
2007 |
163/176 |
Compare the Cayman Islands with other countries
Help us show the world through your eyes
Share a photo of your city and help others discover what it looks like to live there. Your contribution makes our data come alive.
Data sources:
- World Bank | Health (1960–2025, retrieved 2026-07-08)
- United Nations | World Population Prospects (1950–2026, retrieved 2026-07-08)
- U.S. Census Bureau (1960–2025, retrieved 2026-07-08)
- Central Intelligence Agency (CIA) (2000–2019, retrieved 2026-07-08)
- LivingCost (2026, retrieved 2026-07-08)
- EduRank (2026, retrieved 2026-07-08)
Creative Commons Attribution (CC BY) — you’re free to copy, share, remix, adapt, and use even commercially as long as you give appropriate credit and clearly indicate if you made changes. Other sources may be subject to different license terms.