Somalia ranked 149/197 by economy size with a GDP of $13B and 191/197 by GDP per capita at $661.
In 2025, Somalia made up 0.01% of the world's economy, compared to 0.01% in 1960.
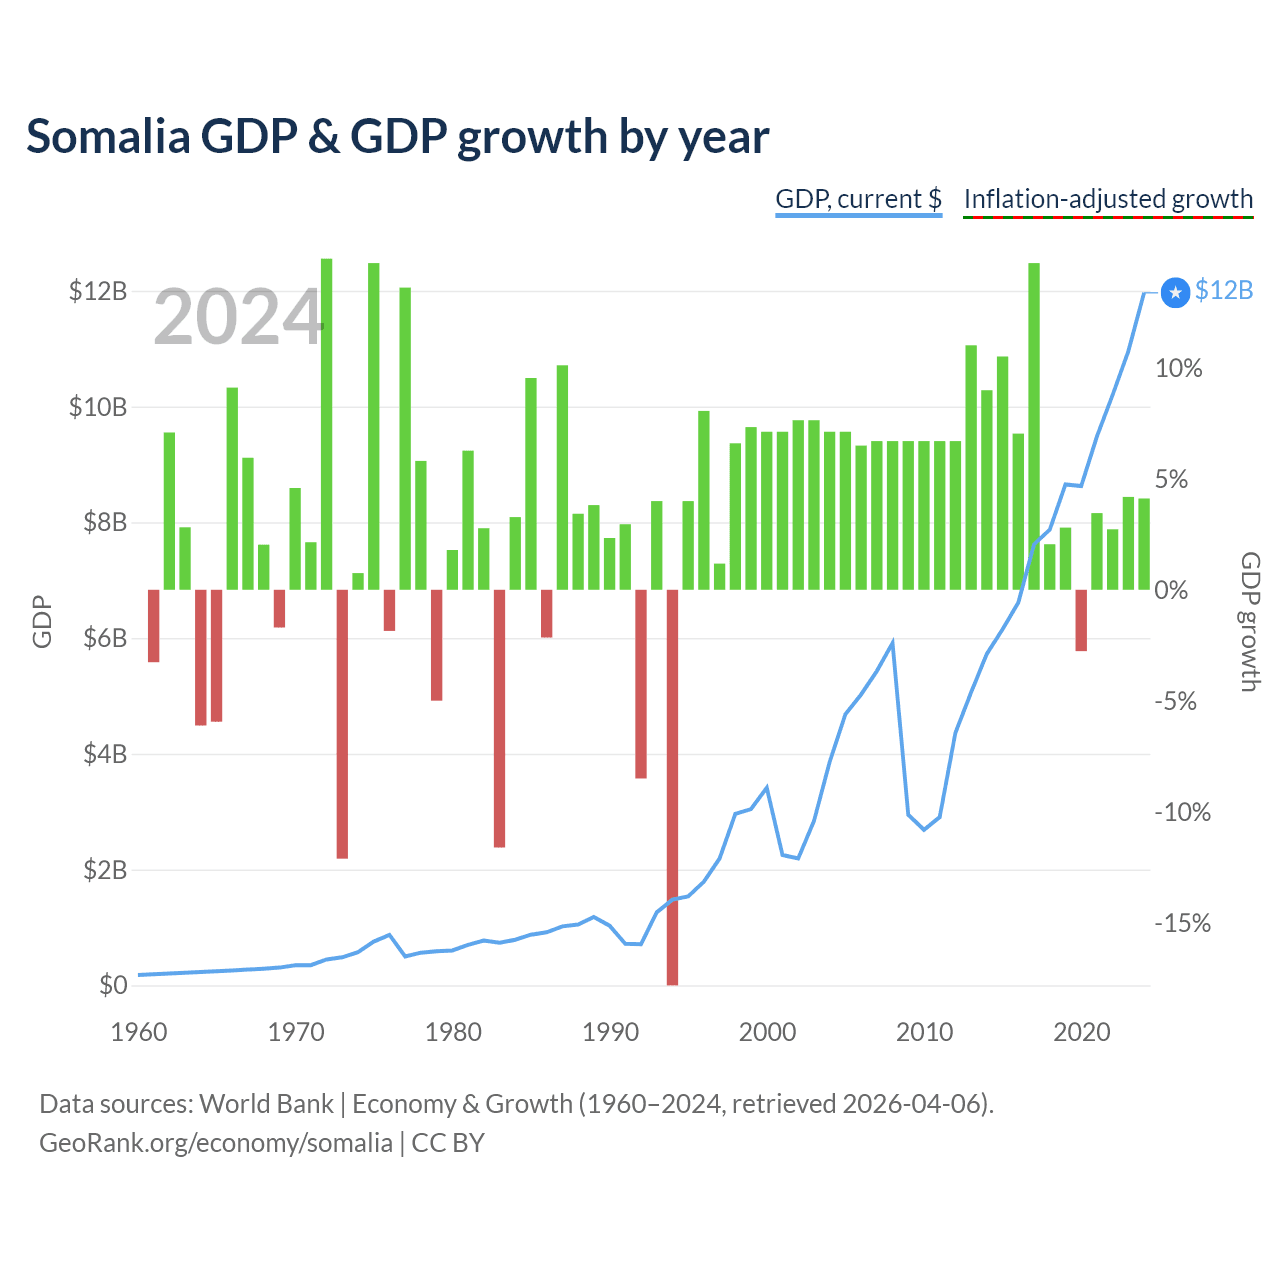
Somalia GDP & GDP growth by year
| Year | GDP | GDP growth |
|---|---|---|
| 2025 | $12,995,200,000 | 2.99% |
| 2024 | $11,967,000,000 | 4.11% |
| 2023 | $10,958,000,000 | 4.18% |
| 2022 | $10,203,000,000 | 2.72% |
| 2021 | $9,483,000,000 | 3.45% |
| 2020 | $8,628,000,000 | -2.76% |
| 2019 | $8,656,000,000 | 2.8% |
| 2018 | $7,873,000,000 | 2.05% |
| 2017 | $7,621,501,710 | 14.7% |
| 2016 | $6,613,743,070 | 7.03% |
| 2015 | $6,152,149,100 | 10.5% |
| 2014 | $5,728,399,720 | 8.98% |
| 2013 | $5,062,881,600 | 11% |
| 2012 | $4,364,670,160 | 6.69% |
| 2011 | $2,906,000,097 | 6.69% |
| 2010 | $2,687,807,004 | 6.69% |
| 2009 | $2,948,594,552 | 6.69% |
| 2008 | $5,913,620,293 | 6.69% |
| 2007 | $5,430,713,729 | 6.69% |
| 2006 | $5,026,743,282 | 6.49% |
| 2005 | $4,683,246,454 | 7.11% |
| 2004 | $3,859,592,813 | 7.11% |
| 2003 | $2,836,724,352 | 7.63% |
| 2002 | $2,192,684,135 | 7.63% |
| 2001 | $2,252,847,465 | 7.11% |
| 2000 | $3,412,797,450 | 7.11% |
| 1999 | $3,045,751,528 | 7.32% |
| 1998 | $2,962,047,564 | 6.59% |
| 1997 | $2,191,749,014 | 1.18% |
| 1996 | $1,792,234,297 | 8.05% |
| 1995 | $1,534,756,135 | 3.99% |
| 1994 | $1,481,205,098 | -17.8% |
| 1993 | $1,260,132,956 | 3.99% |
| 1992 | $709,297,579 | -8.49% |
| 1991 | $717,974,930 | 2.95% |
| 1990 | $1,031,282,081 | 2.33% |
| 1989 | $1,181,360,844 | 3.81% |
| 1988 | $1,051,596,967 | 3.42% |
| 1987 | $1,018,972,664 | 10.1% |
| 1986 | $916,590,786 | -2.15% |
| 1985 | $875,702,247 | 9.53% |
| 1984 | $787,434,542 | 3.27% |
| 1983 | $735,408,642 | -11.6% |
| 1982 | $774,578,932 | 2.77% |
| 1981 | $699,302,473 | 6.26% |
| 1980 | $602,515,548 | 1.79% |
| 1979 | $589,566,929 | -4.99% |
| 1978 | $564,571,823 | 5.8% |
| 1977 | $498,550,725 | 13.6% |
| 1976 | $871,344,245 | -1.85% |
| 1975 | $757,015,879 | 14.7% |
| 1974 | $572,504,036 | 0.75% |
| 1973 | $483,699,611 | -12.1% |
| 1972 | $447,883,941 | 14.9% |
| 1971 | $347,039,446 | 2.14% |
| 1970 | $347,985,394 | 4.58% |
| 1969 | $306,357,285 | -1.7% |
| 1968 | $286,719,885 | 2.03% |
| 1967 | $271,781,887 | 5.94% |
| 1966 | $257,375,897 | 9.1% |
| 1965 | $243,725,898 | -5.94% |
| 1964 | $229,529,913 | -6.11% |
| 1963 | $216,145,936 | 2.81% |
| 1962 | $203,531,928 | 7.08% |
| 1961 | $191,659,914 | -3.26% |
| 1960 | $180,459,937 | - |
Data sources: World Bank | Economy & Growth (1960–2025, retrieved 2026-07-08).
GeoRank.org/economy/somalia | CC BY 
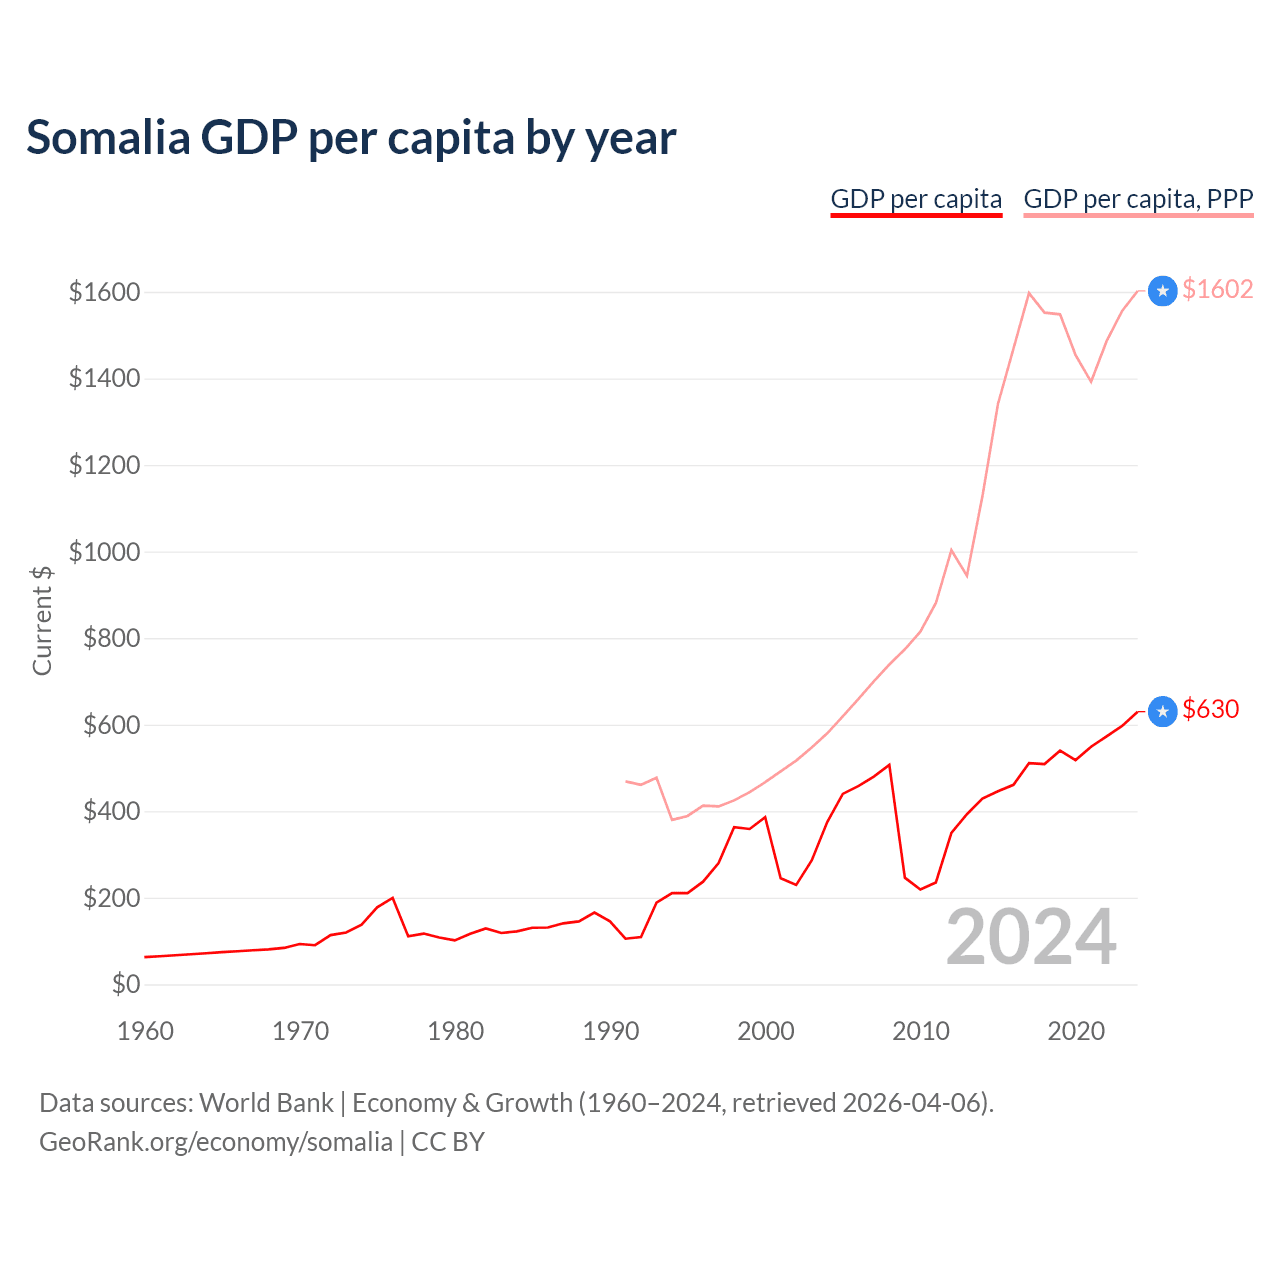
Somalia GDP per capita by year
| Year | Current $ | |
|---|---|---|
| GDP per capita | GDP per capita, PPP | |
| 2025 | $661 | - |
| 2024 | $630 | $1,602 |
| 2023 | $597 | $1,556 |
| 2022 | $573 | $1,486 |
| 2021 | $549 | $1,392 |
| 2020 | $518 | $1,454 |
| 2019 | $540 | $1,548 |
| 2018 | $509 | $1,552 |
| 2017 | $511 | $1,597 |
| 2016 | $461 | $1,469 |
| 2015 | $446 | $1,341 |
| 2014 | $429 | $1,128 |
| 2013 | $393 | $944 |
| 2012 | $350 | $1,003 |
| 2011 | $235.3 | $881 |
| 2010 | $219.2 | $815 |
| 2009 | $246.5 | $774 |
| 2008 | $507 | $739 |
| 2007 | $480 | $700 |
| 2006 | $458 | $659 |
| 2005 | $440 | $619 |
| 2004 | $375 | $580 |
| 2003 | $286.3 | $547 |
| 2002 | $229.6 | $517 |
| 2001 | $244.9 | $492 |
| 2000 | $386 | $467 |
| 1999 | $359 | $444 |
| 1998 | $363 | $425 |
| 1997 | $280.1 | $411 |
| 1996 | $237.2 | $413 |
| 1995 | $210.7 | $389 |
| 1994 | $210.8 | $380 |
| 1993 | $188.6 | $477 |
| 1992 | $109.2 | $461 |
| 1991 | $105.4 | $469 |
| 1990 | $145.6 | - |
| 1989 | $166 | - |
| 1988 | $145.3 | - |
| 1987 | $141 | - |
| 1986 | $131.4 | - |
| 1985 | $130.8 | - |
| 1984 | $122.5 | - |
| 1983 | $118.6 | - |
| 1982 | $129 | - |
| 1981 | $116.9 | - |
| 1980 | $101.5 | - |
| 1979 | $108.2 | - |
| 1978 | $117.3 | - |
| 1977 | $111.2 | - |
| 1976 | $199.6 | - |
| 1975 | $177.8 | - |
| 1974 | $137.9 | - |
| 1973 | $119.6 | - |
| 1972 | $113.7 | - |
| 1971 | $90.4 | - |
| 1970 | $93.1 | - |
| 1969 | $84.1 | - |
| 1968 | $80.8 | - |
| 1967 | $78.7 | - |
| 1966 | $76.5 | - |
| 1965 | $74.4 | - |
| 1964 | $71.9 | - |
| 1963 | $69.5 | - |
| 1962 | $67.2 | - |
| 1961 | $64.9 | - |
| 1960 | $62.7 | - |
Data sources: World Bank | Economy & Growth (1960–2025, retrieved 2026-07-08).
GeoRank.org/economy/somalia | CC BY
Somalia has a GDP per capita of $661, ranking 191/197, a GDP per capita based on purchasing power parity (PPP) of $1,602, ranking 194/197, and a median annual after tax income of $1,415, ranking 184/197.
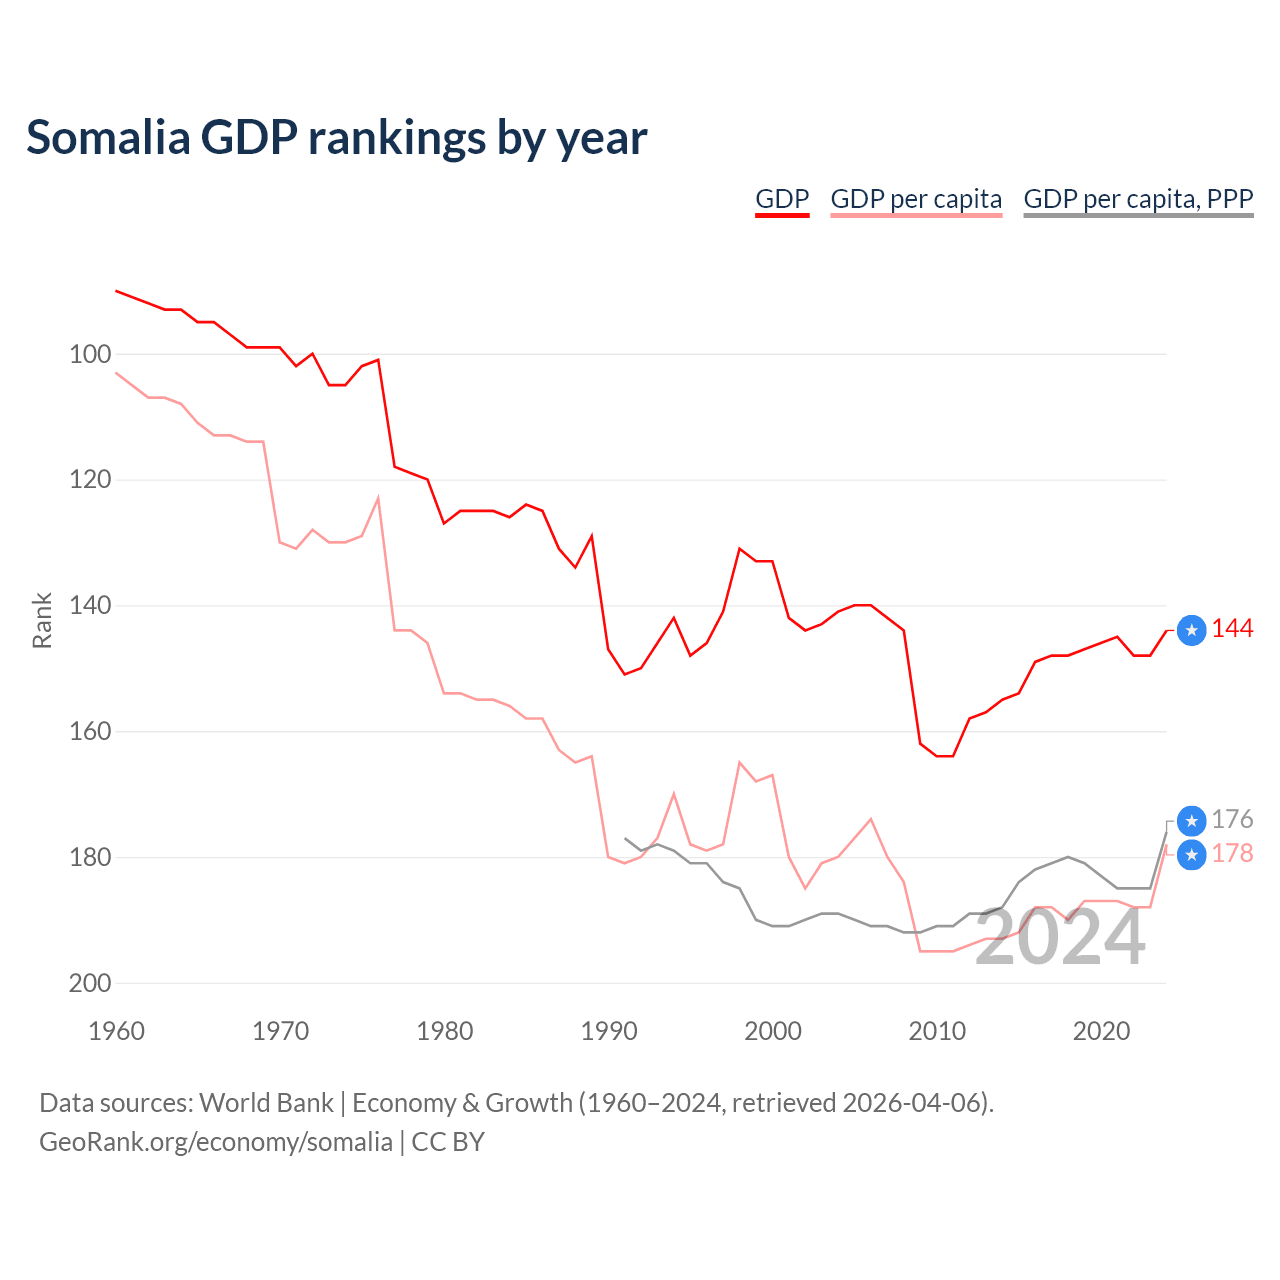
Somalia GDP rankings by year
| Year | Rank | ||
|---|---|---|---|
| GDP | GDP per capita | GDP per capita, PPP | |
| 2025 | 140 | 175 | - |
| 2024 | 146 | 184 | 176 |
| 2023 | 148 | 188 | 185 |
| 2022 | 148 | 188 | 185 |
| 2021 | 145 | 187 | 185 |
| 2020 | 146 | 187 | 183 |
| 2019 | 147 | 187 | 181 |
| 2018 | 148 | 190 | 180 |
| 2017 | 148 | 188 | 181 |
| 2016 | 149 | 188 | 182 |
| 2015 | 154 | 192 | 184 |
| 2014 | 155 | 193 | 188 |
| 2013 | 157 | 193 | 189 |
| 2012 | 158 | 194 | 189 |
| 2011 | 164 | 195 | 191 |
| 2010 | 164 | 195 | 191 |
| 2009 | 162 | 195 | 192 |
| 2008 | 144 | 184 | 192 |
| 2007 | 142 | 180 | 191 |
| 2006 | 140 | 174 | 191 |
| 2005 | 140 | 177 | 190 |
| 2004 | 141 | 180 | 189 |
| 2003 | 143 | 181 | 189 |
| 2002 | 144 | 185 | 190 |
| 2001 | 142 | 180 | 191 |
| 2000 | 133 | 167 | 191 |
| 1999 | 133 | 168 | 190 |
| 1998 | 131 | 165 | 185 |
| 1997 | 141 | 178 | 184 |
| 1996 | 146 | 179 | 181 |
| 1995 | 148 | 178 | 181 |
| 1994 | 142 | 170 | 179 |
| 1993 | 146 | 177 | 178 |
| 1992 | 150 | 180 | 179 |
| 1991 | 151 | 181 | 177 |
| 1990 | 147 | 180 | - |
| 1989 | 129 | 164 | - |
| 1988 | 134 | 165 | - |
| 1987 | 131 | 163 | - |
| 1986 | 125 | 158 | - |
| 1985 | 124 | 158 | - |
| 1984 | 126 | 156 | - |
| 1983 | 125 | 155 | - |
| 1982 | 125 | 155 | - |
| 1981 | 125 | 154 | - |
| 1980 | 127 | 154 | - |
| 1979 | 120 | 146 | - |
| 1978 | 119 | 144 | - |
| 1977 | 118 | 144 | - |
| 1976 | 101 | 123 | - |
| 1975 | 102 | 129 | - |
| 1974 | 105 | 130 | - |
| 1973 | 105 | 130 | - |
| 1972 | 100 | 128 | - |
| 1971 | 102 | 131 | - |
| 1970 | 99 | 130 | - |
| 1969 | 99 | 114 | - |
| 1968 | 99 | 114 | - |
| 1967 | 97 | 113 | - |
| 1966 | 95 | 113 | - |
| 1965 | 95 | 111 | - |
| 1964 | 93 | 108 | - |
| 1963 | 93 | 107 | - |
| 1962 | 92 | 107 | - |
| 1961 | 91 | 105 | - |
| 1960 | 90 | 103 | - |
Data sources: World Bank | Economy & Growth (1960–2025, retrieved 2026-07-08).
GeoRank.org/economy/somalia | CC BY
Compared with 2000, in 2025 Somalia is ranked 140th out of 179 by GDP (down from 133rd), 175th by GDP per capita (down from 167th), and 176th by GDP per capita PPP (up from 191st).
Economic indicators
 Somalia
|
Rank | |
|---|---|---|
| Gross domestic product |
$13B
2025 |
149/197 |
| GDP growth |
2.99%
2024-2025 |
108/194 |
| GDP per capita |
$661
2025 |
191/197 |
| GDP per capita, PPP |
$1,602
2024 |
194/197 |
| Average annual personal income after taxes |
$1,415
2026 |
184/197 |
| Government expenditure, % of GDP |
13%
2026 |
190/195 |
| Consumer prices inflation |
3.7%
2024-2025 |
73/195 |
| Unemployment rate |
11.1%
2022 |
30/196 |
| Population |
20653532
|
67/197 |
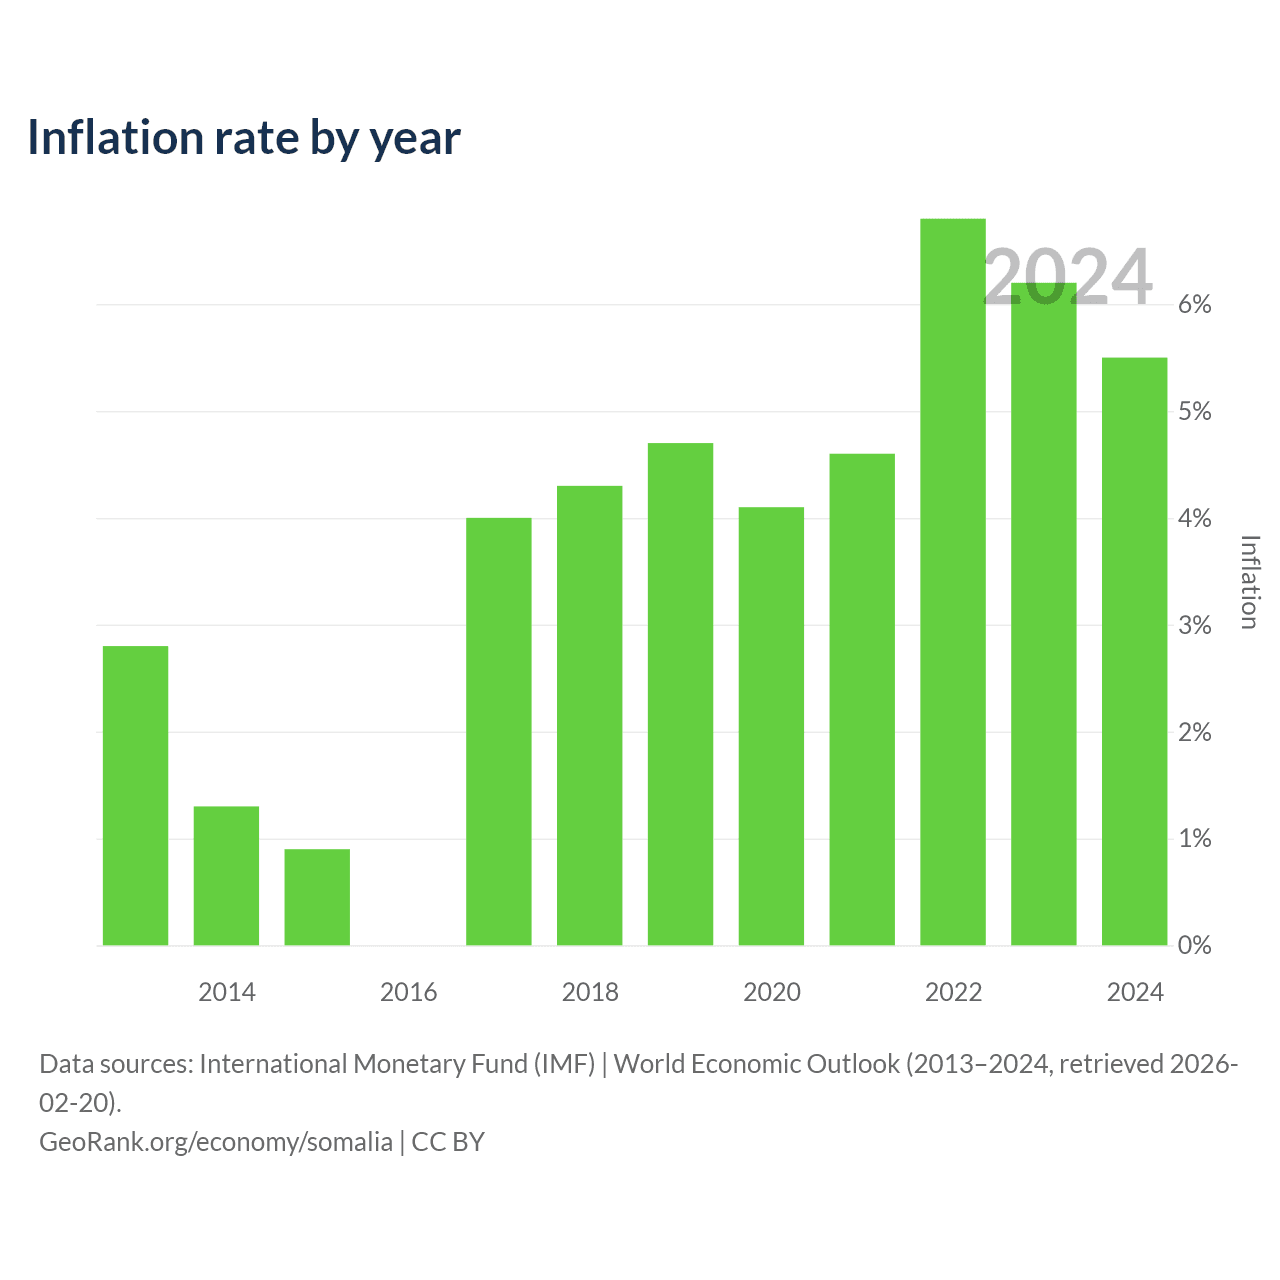
Inflation rate by year
| Year | Inflation |
|---|---|
| 2025 | 3.7% |
| 2024 | 5.5% |
| 2023 | 6.2% |
| 2022 | 6.8% |
| 2021 | 4.6% |
| 2020 | 4.1% |
| 2019 | 4.7% |
| 2018 | 4.3% |
| 2017 | 4% |
| 2016 | 0% |
| 2015 | 0.9% |
| 2014 | 1.3% |
| 2013 | 2.8% |
Data sources: International Monetary Fund (IMF) | World Economic Outlook (2013–2025, retrieved 2026-07-08).
GeoRank.org/economy/somalia | CC BY
Over the past 13 years, Somalia has had an average annual inflation rate of 3.76%. In 2025, inflation was 3.7%. The bar chart above shows consumer price inflation by year.
Balance of trade
|
Somalia
|
Rank | |
|---|---|---|
| Imports of goods and services, % of GDP |
98.8%
2025 |
9/182 |
| Exports of goods and services, % of GDP |
29.2%
2025 |
117/193 |
Somalia top 10 trading partners
Somalia's biggest trading partner accounting for 32.5% of all exports and imports is the United Arab Emirates, with a trade balance between the two of -$1.46B: Somalia exports $380M worth of goods and services to the United Arab Emirates and imports $1.84B.
Below is the list of the top 10 trade partners of Somalia.
| Rank | Country | Trade value | Share of total trade | Export to | Import from | Top export to | Top import from |
|---|---|---|---|---|---|---|---|
| 1 |
 UAE
UAE
|
$2.22B | 32.5% | $380M | $1.84B | Precious metals & jewellery | Machinery & equipment |
| 2 |
 China
China
|
$1.03B | 15% | $2.99M | $1.02B | Raw agricultural goods | Textiles & consumer goods |
| 3 |
 India
India
|
$828M | 12.1% | $33.9M | $794M | Metals | Processed food, beverages & tobacco |
| 4 |
 Oman
Oman
|
$522M | 7.62% | $217M | $304M | Animal & marine products | Raw materials & minerals |
| 5 |
 Saudi Arabia
|
$370M | 5.41% | $338M | $32.2M | Animal & marine products | Processed food, beverages & tobacco |
| 6 |
 Turkey
|
$319M | 4.66% | $1.99M | $317M | Raw agricultural goods | Processed food, beverages & tobacco |
| 7 |
 Indonesia
|
$163M | 2.38% | $31K | $163M | Animal & marine products | Processed food, beverages & tobacco |
| 8 |
 Ethiopia
|
$143M | 2.09% | $1.08M | $142M | Raw agricultural goods | Raw agricultural goods |
| 9 |
 Egypt
Egypt
|
$140M | 2.04% | $7.78M | $132M | Animal & marine products | Raw agricultural goods |
| 10 |
 Djibouti
|
$138M | 2.02% | $84.2M | $54M | Wood & paper products | Machinery & equipment |
Top 10 exports
|
Somalia
|
Rank | |
|---|---|---|
| Animal & marine products | $343M | 80/192 |
| Raw agricultural goods | $32.6M | 136/193 |
| Metals | $26.4M | 142/192 |
| Machinery & equipment | $8.85M | 169/193 |
| Processed food, beverages & tobacco | $1.98M | 178/192 |
| Chemicals & pharma | $1.76M | 170/193 |
| Raw materials & minerals | $1.09M | 176/193 |
| Precious metals & jewellery | $711K | 156/190 |
| Wood & paper products | $543K | 170/192 |
| Textiles & consumer goods | $375K | 176/193 |
Top 10 imports
|
Somalia
|
Rank | |
|---|---|---|
| Processed food, beverages & tobacco | $827M | 112/193 |
| Textiles & consumer goods | $595M | 115/193 |
| Raw agricultural goods | $457M | 117/193 |
| Machinery & equipment | $417M | 158/193 |
| Chemicals & pharma | $302M | 148/193 |
| Metals | $193M | 146/193 |
| Wood & paper products | $81.6M | 145/193 |
| Raw materials & minerals | $75.8M | 174/193 |
| Animal & marine products | $58.8M | 153/193 |
| Miscellaneous | $44.5M | 112/193 |
Economic freedom indices
|
Somalia
|
Rank | |
|---|---|---|
| Economic freedom | 29 | 193/197 |
| Property rights | 0.8 | 181/182 |
| Government integrity | 9.6 | 176/182 |
| Judicial effectiveness | 1.7 | 181/182 |
| Tax burden | 99.9 | 3/182 |
| Fiscal health | 0 | 180/181 |
| Business freedom | 25.9 | 181/182 |
| Labor freedom | 26.8 | 180/182 |
Other economic metrics
|
Somalia
|
Rank | |
|---|---|---|
| Industry, % of GDP |
9.66%
1986 |
187/194 |
| Agriculture, forestry, and fishing, % of GDP |
55.8%
1990 |
1/193 |
|
GNI, Atlas method
|
$12.5B
2025 |
148/194 |
| GNI per capita, PPP |
$1,640
2025 |
187/191 |
| Total reserves including gold |
$23.1M
1989 |
176/177 |
|
Net inflows of foreign direct investment
|
$765M
2024 |
102/193 |
|
Net outflows of foreign direct investment
|
$0
2024 |
158/193 |
|
Servicing debt to the IMF, % of GNI
|
0.13%
2024 |
120/121 |
| Poverty at national poverty lines |
55.4%
2022 |
15/176 |
|
Gross capital formation, % of GDP
|
28.1%
2025 |
45/179 |
Compare Somalia vs other countries
GDP per capita map
Data sources: World Bank | Economy & Growth (1985–2025, retrieved 2026-07-08); U.S. Census Bureau (1985–2025, retrieved 2026-07-08).
GeoRank.org/economy/somalia | CC BY
Help us show the world through your eyes
Share a photo of your city and help others discover what it looks like to live there. Your contribution makes our data come alive.
Data sources:
- World Bank | Economy & Growth (1960–2026, retrieved 2026-07-08)
- U.S. Census Bureau (1985–2025, retrieved 2026-07-08)
- TradeMap (2025, retrieved 2026-07-08)
- International Monetary Fund (IMF) | World Economic Outlook (2013–2025, retrieved 2026-07-08)
- The Heritage Foundation | Economic Freedom Index (2017–2026, retrieved 2026-07-08)
- United Nations | World Population Prospects (2026, retrieved 2026-07-08)
- LivingCost (2026, retrieved 2026-07-08)
Creative Commons Attribution (CC BY) — you’re free to copy, share, remix, adapt, and use even commercially as long as you give appropriate credit and clearly indicate if you made changes. Other sources may be subject to different license terms.
Gross National Income (GNI) measures a country's total income. It encompasses income earned by residents, businesses, and foreign sources, defined as employee compensation and investment profits. GNI adds product taxes not included elsewhere and subtracts subsidies. It accounts for income from residents working abroad but excludes earnings from foreigners within the country.
Foreign direct investment (FDI, net inflows) shows how much capital foreign investors bring into a country after accounting for any funds that flow back in the opposite direction. It represents the net value of overseas companies establishing, expanding, or financing businesses in the reporting country. A positive number means more capital entered the country than was withdrawn, while a negative number means foreign investors pulled out more than they invested.
Foreign direct investment (FDI, net outflows) shows how much capital residents of a country invest abroad after accounting for any funds that flow back in the opposite direction. It represents the net value of domestic companies establishing, expanding, or financing businesses in other countries. A positive number means more capital was invested abroad than withdrawn, while a negative number means residents pulled back more than they invested.
Principal and interest payments to the IMF in currency, goods, or services on long-term debt expressed as a share of GNI.
Formerly gross domestic investment, gross capital formation measures the share of a country’s economic output invested in fixed assets, including buildings, machinery, and infrastructure. It indicates how much of the economy is devoted to building productive capacity.