Liechtenstein ranked 156/197 by economy size with a GDP of $8.91B and 2/197 by GDP per capita at $220,167.
In 2024, Liechtenstein made up 0.008% of the world's economy, compared to 0.003% in 1970.
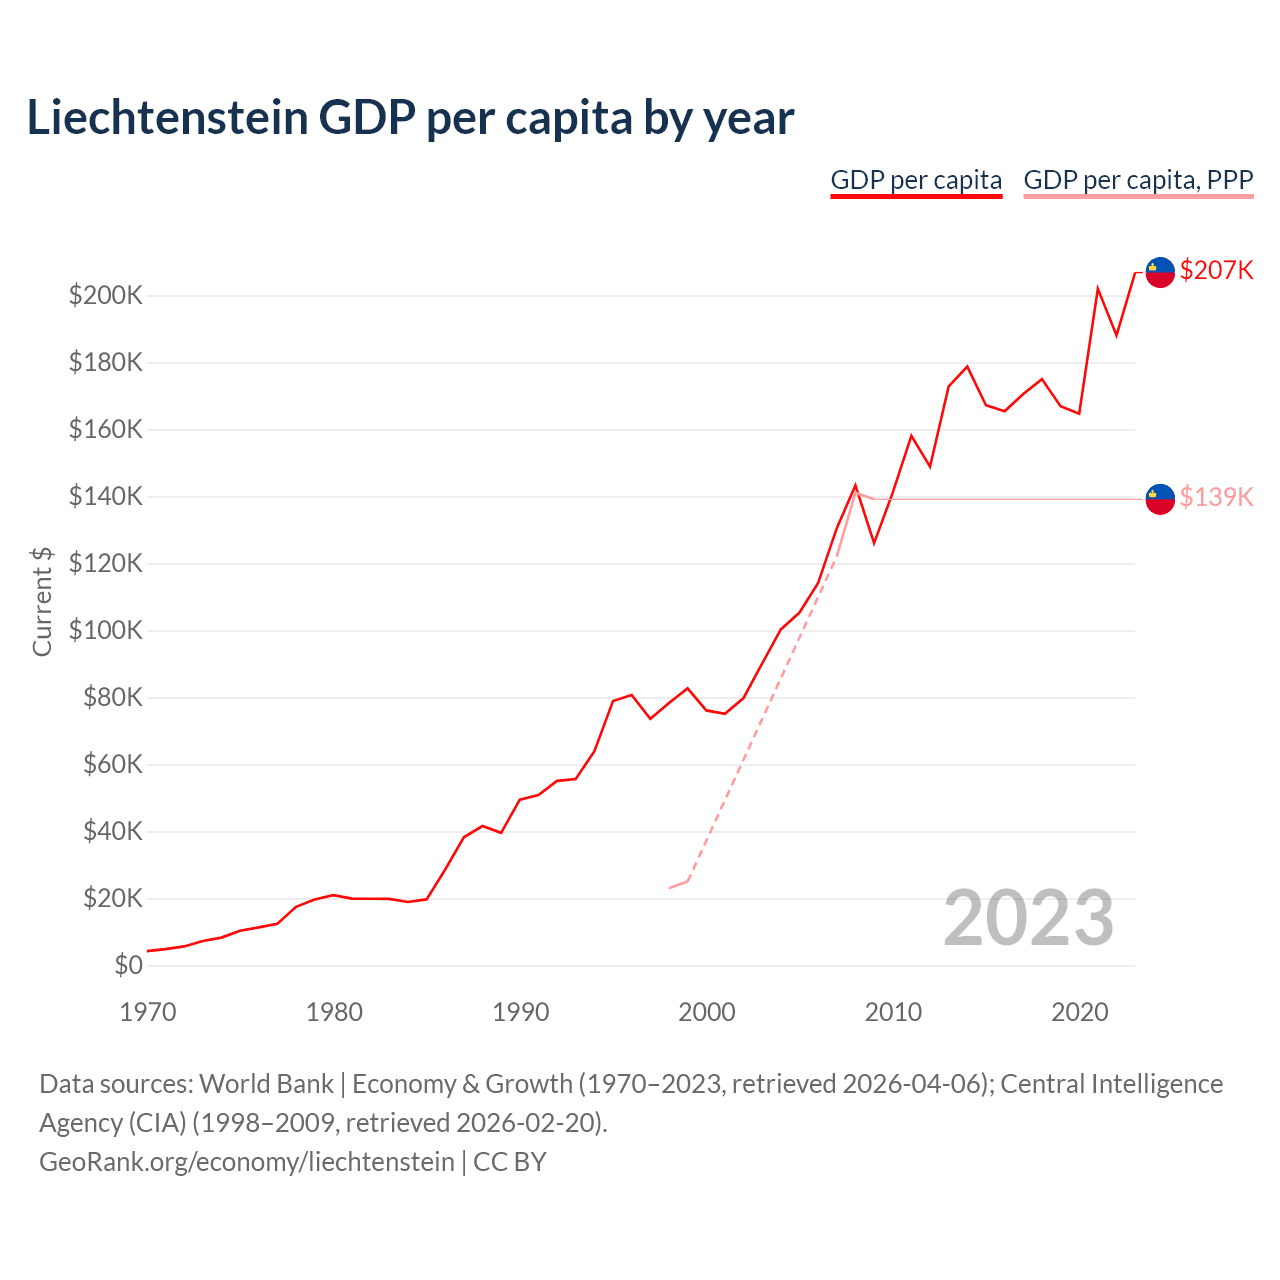
Liechtenstein GDP per capita by year
| Year | Current $ | |
|---|---|---|
| GDP per capita | GDP per capita, PPP | |
| 2024 | $220,167 | - |
| 2023 | $206,781 | - |
| 2022 | $188,055 | - |
| 2021 | $201,945 | - |
| 2020 | $164,671 | - |
| 2019 | $166,908 | - |
| 2018 | $174,989 | - |
| 2017 | $170,547 | - |
| 2016 | $165,375 | - |
| 2015 | $167,187 | - |
| 2014 | $178,735 | - |
| 2013 | $172,824 | - |
| 2012 | $148,842 | - |
| 2011 | $158,066 | - |
| 2010 | $141,090 | - |
| 2009 | $126,025 | $139,100 |
| 2008 | $143,249 | $141,100 |
| 2007 | $130,493 | $122,100 |
| 2006 | $114,168 | - |
| 2005 | $105,295 | - |
| 2004 | $100,281 | - |
| 2003 | $90,108 | - |
| 2002 | $79,795 | - |
| 2001 | $75,068 | - |
| 2000 | $76,088 | - |
| 1999 | $82,682 | $25,000 |
| 1998 | $78,303 | $23,000 |
| 1997 | $73,591 | - |
| 1996 | $80,689 | - |
| 1995 | $78,910 | - |
| 1994 | $63,936 | - |
| 1993 | $55,605 | - |
| 1992 | $55,057 | - |
| 1991 | $50,812 | - |
| 1990 | $49,458 | - |
| 1989 | $39,552 | - |
| 1988 | $41,569 | - |
| 1987 | $38,206 | - |
| 1986 | $28,613 | - |
| 1985 | $19,684 | - |
| 1984 | $18,898 | - |
| 1983 | $19,815 | - |
| 1982 | $19,886 | - |
| 1981 | $19,929 | - |
| 1980 | $20,959 | - |
| 1979 | $19,674 | - |
| 1978 | $17,457 | - |
| 1977 | $12,417 | - |
| 1976 | $11,326 | - |
| 1975 | $10,333 | - |
| 1974 | $8,272 | - |
| 1973 | $7,282 | - |
| 1972 | $5,645 | - |
| 1971 | $4,856 | - |
| 1970 | $4,262 | - |
Data sources: World Bank | Economy & Growth (1970–2024, retrieved 2026-07-08); Central Intelligence Agency (CIA) (1998–2009, retrieved 2026-07-08).
GeoRank.org/economy/liechtenstein | CC BY 
Liechtenstein has a GDP per capita of $220,167, ranking 2/197, a GDP per capita based on purchasing power parity (PPP) of $139,100, ranking 3/197, and a median annual after tax income of $109,813, ranking 1/197.
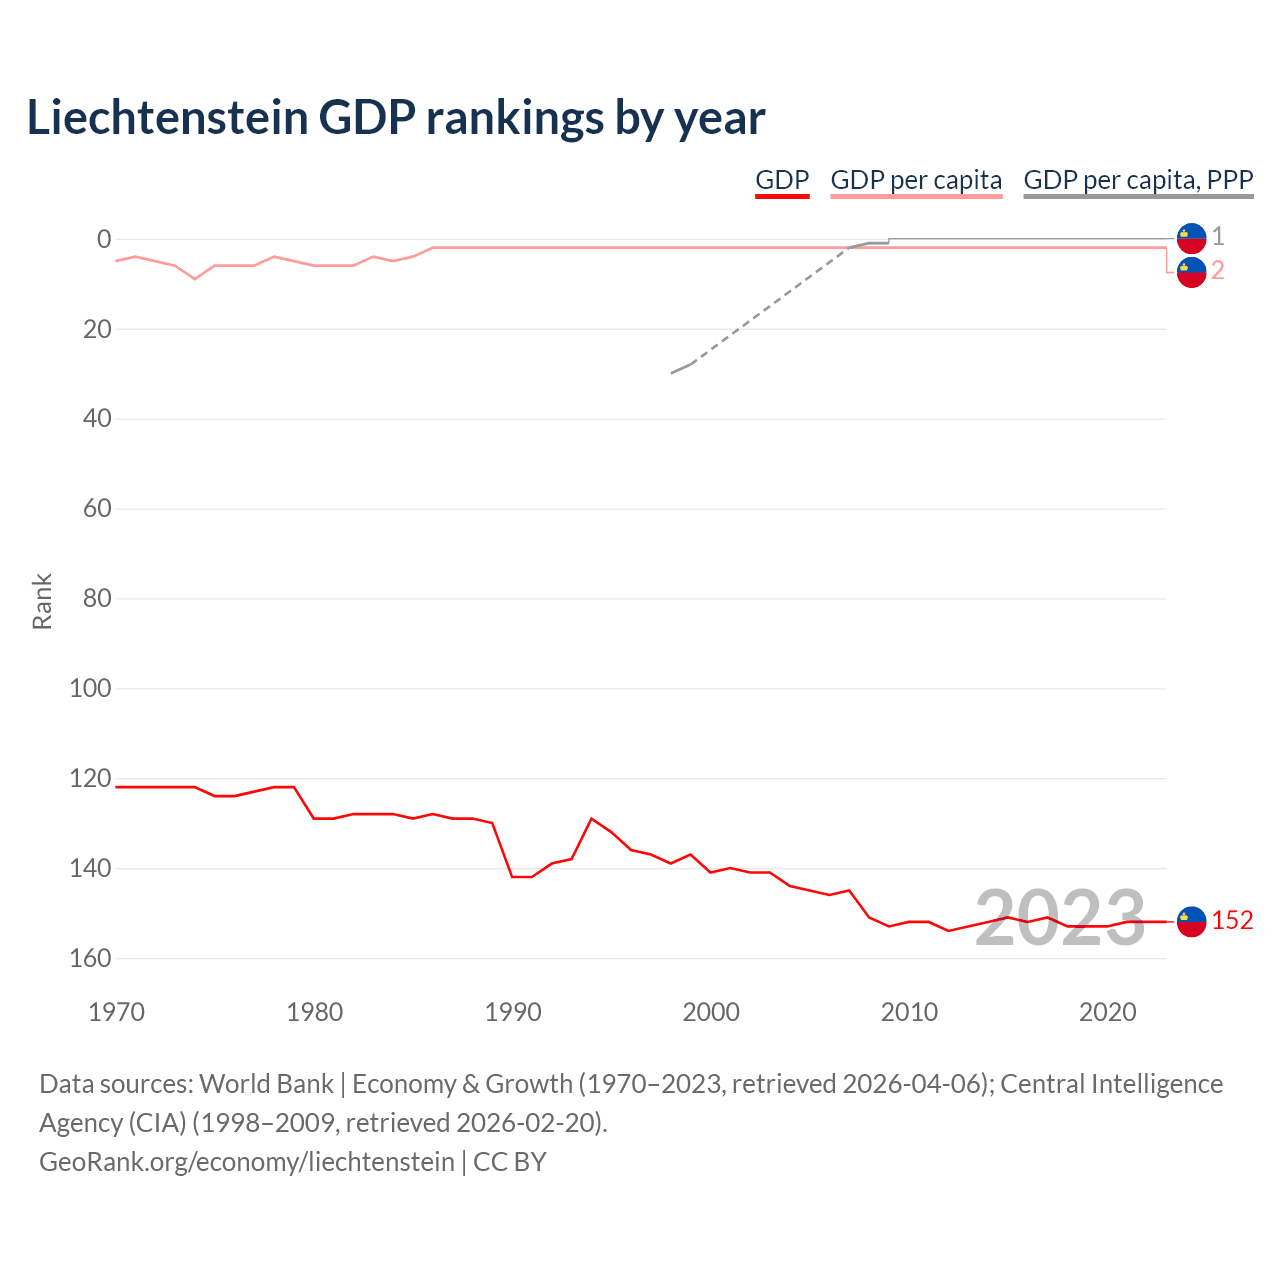
Liechtenstein GDP rankings by year
| Year | Rank | ||
|---|---|---|---|
| GDP | GDP per capita | GDP per capita, PPP | |
| 2024 | 151 | 2 | - |
| 2023 | 152 | 2 | - |
| 2022 | 152 | 2 | - |
| 2021 | 152 | 2 | - |
| 2020 | 153 | 2 | - |
| 2019 | 153 | 2 | - |
| 2018 | 153 | 2 | - |
| 2017 | 151 | 2 | - |
| 2016 | 152 | 2 | - |
| 2015 | 151 | 2 | - |
| 2014 | 152 | 2 | - |
| 2013 | 153 | 2 | - |
| 2012 | 154 | 2 | - |
| 2011 | 152 | 2 | - |
| 2010 | 152 | 2 | - |
| 2009 | 153 | 2 | 1 |
| 2008 | 151 | 2 | 1 |
| 2007 | 145 | 2 | 2 |
| 2006 | 146 | 2 | - |
| 2005 | 145 | 2 | - |
| 2004 | 144 | 2 | - |
| 2003 | 141 | 2 | - |
| 2002 | 141 | 2 | - |
| 2001 | 140 | 2 | - |
| 2000 | 141 | 2 | - |
| 1999 | 137 | 2 | 28 |
| 1998 | 139 | 2 | 30 |
| 1997 | 137 | 2 | - |
| 1996 | 136 | 2 | - |
| 1995 | 132 | 2 | - |
| 1994 | 129 | 2 | - |
| 1993 | 138 | 2 | - |
| 1992 | 139 | 2 | - |
| 1991 | 142 | 2 | - |
| 1990 | 142 | 2 | - |
| 1989 | 130 | 2 | - |
| 1988 | 129 | 2 | - |
| 1987 | 129 | 2 | - |
| 1986 | 128 | 2 | - |
| 1985 | 129 | 4 | - |
| 1984 | 128 | 5 | - |
| 1983 | 128 | 4 | - |
| 1982 | 128 | 6 | - |
| 1981 | 129 | 6 | - |
| 1980 | 129 | 6 | - |
| 1979 | 122 | 5 | - |
| 1978 | 122 | 4 | - |
| 1977 | 123 | 6 | - |
| 1976 | 124 | 6 | - |
| 1975 | 124 | 7 | - |
| 1974 | 122 | 9 | - |
| 1973 | 122 | 6 | - |
| 1972 | 122 | 5 | - |
| 1971 | 122 | 5 | - |
| 1970 | 122 | 5 | - |
Data sources: World Bank | Economy & Growth (1970–2024, retrieved 2026-07-08); Central Intelligence Agency (CIA) (1998–2009, retrieved 2026-07-08).
GeoRank.org/economy/liechtenstein | CC BY
Compared with 2000, in 2024 Liechtenstein is ranked 151st out of 189 by GDP (down from 141st) and 2nd by GDP per capita (unchanged from 2nd).
Economic indicators
 Liechtenstein
|
Rank | |
|---|---|---|
| Gross domestic product |
$8.91B
2024 |
156/197 |
| GDP per capita |
$220,167
2024 |
2/197 |
| GDP per capita, PPP |
$139,100
2009 |
3/197 |
| Average annual personal income after taxes |
$109,813
2026 |
1/197 |
| Number of billionaires |
1
2026 |
69/74 |
| Billionaire frequency |
1 in 33,141
2026 |
2/74 |
| Government expenditure, % of GDP |
22.6%
2026 |
134/195 |
| Consumer prices inflation |
-0.4%
2019-2020 |
188/195 |
| Unemployment rate |
2.31%
2017 |
171/196 |
| Population |
41400
|
190/197 |
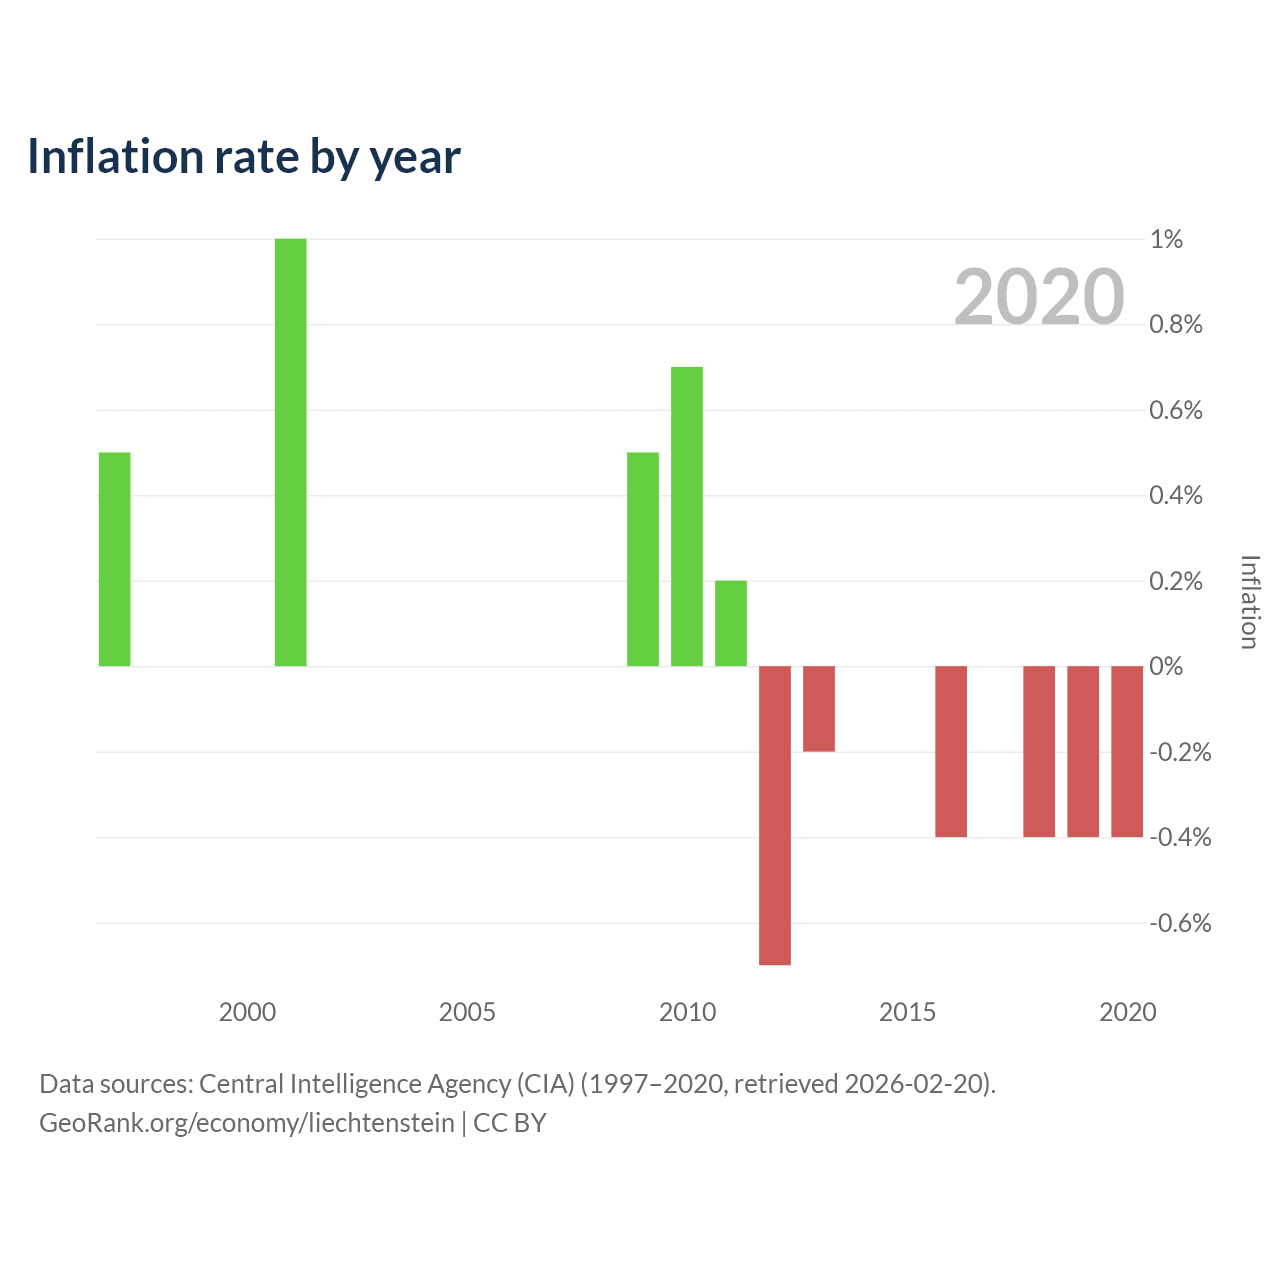
Inflation rate by year
| Year | Inflation |
|---|---|
| 2020 | -0.4% |
| 2019 | -0.4% |
| 2018 | -0.4% |
| 2017 | - |
| 2016 | -0.4% |
| 2015 | - |
| 2014 | - |
| 2013 | -0.2% |
| 2012 | -0.7% |
| 2011 | 0.2% |
| 2010 | 0.7% |
| 2009 | 0.5% |
| 2008 | - |
| 2007 | - |
| 2006 | - |
| 2005 | - |
| 2004 | - |
| 2003 | - |
| 2002 | - |
| 2001 | 1% |
| 2000 | - |
| 1999 | - |
| 1998 | - |
| 1997 | 0.5% |
Data sources: Central Intelligence Agency (CIA) (1997–2020, retrieved 2026-07-08).
GeoRank.org/economy/liechtenstein | CC BY
Over the past 10 years, Liechtenstein has had an average annual inflation rate of -0.01%. In 2020, inflation was -0.4%. The bar chart above shows consumer price inflation by year.
Economic freedom indices
|
Liechtenstein
|
Rank | |
|---|---|---|
| Economic freedom | 74 | 23/197 |
| Property rights | 93.1 | 15/182 |
| Government integrity | 83.7 | 16/182 |
| Judicial effectiveness | 87.3 | 25/182 |
| Tax burden | 93.4 | 21/182 |
| Business freedom | 83.6 | 18/182 |
| Labor freedom | 51.9 | 129/182 |
| Trade freedom | 86.6 | 8/181 |
| Investment freedom | 80 | 16/181 |
| Financial freedom | 80 | 6/181 |
Other economic metrics
|
Liechtenstein
|
Rank | |
|---|---|---|
| Services, % of GDP |
57.4%
2023 |
94/191 |
| Industry, % of GDP |
39.1%
2023 |
18/194 |
| Agriculture, forestry, and fishing, % of GDP |
0.16%
2023 |
191/193 |
|
GNI, Atlas method
|
$4.16B
2009 |
163/194 |
|
Net inflows of foreign direct investment
|
-$87.2B
2018 |
192/193 |
Compare Liechtenstein vs other countries
GDP per capita map
Data sources: World Bank | Economy & Growth (1985–2025, retrieved 2026-07-08); U.S. Census Bureau (1985–2025, retrieved 2026-07-08).
GeoRank.org/economy/liechtenstein | CC BY
Help us show the world through your eyes
Share a photo of your city and help others discover what it looks like to live there. Your contribution makes our data come alive.
Data sources:
- World Bank | Economy & Growth (1970–2026, retrieved 2026-07-08)
- U.S. Census Bureau (1985–2025, retrieved 2026-07-08)
- Central Intelligence Agency (CIA) (1997–2020, retrieved 2026-07-08)
- The Heritage Foundation | Economic Freedom Index (2025–2026, retrieved 2026-07-08)
- United Nations | World Population Prospects (2026, retrieved 2026-07-08)
- LivingCost (2026, retrieved 2026-07-08)
Creative Commons Attribution (CC BY) — you’re free to copy, share, remix, adapt, and use even commercially as long as you give appropriate credit and clearly indicate if you made changes. Other sources may be subject to different license terms.
Gross National Income (GNI) measures a country's total income. It encompasses income earned by residents, businesses, and foreign sources, defined as employee compensation and investment profits. GNI adds product taxes not included elsewhere and subtracts subsidies. It accounts for income from residents working abroad but excludes earnings from foreigners within the country.
Foreign direct investment (FDI, net inflows) shows how much capital foreign investors bring into a country after accounting for any funds that flow back in the opposite direction. It represents the net value of overseas companies establishing, expanding, or financing businesses in the reporting country. A positive number means more capital entered the country than was withdrawn, while a negative number means foreign investors pulled out more than they invested.