The world's aggregated GDP in 2025 was $118T, a growth of 5.98% from $112T in 2024.
The world's average GDP per capita in 2025 was $14,406, a growth of 5.02% from the previous year.
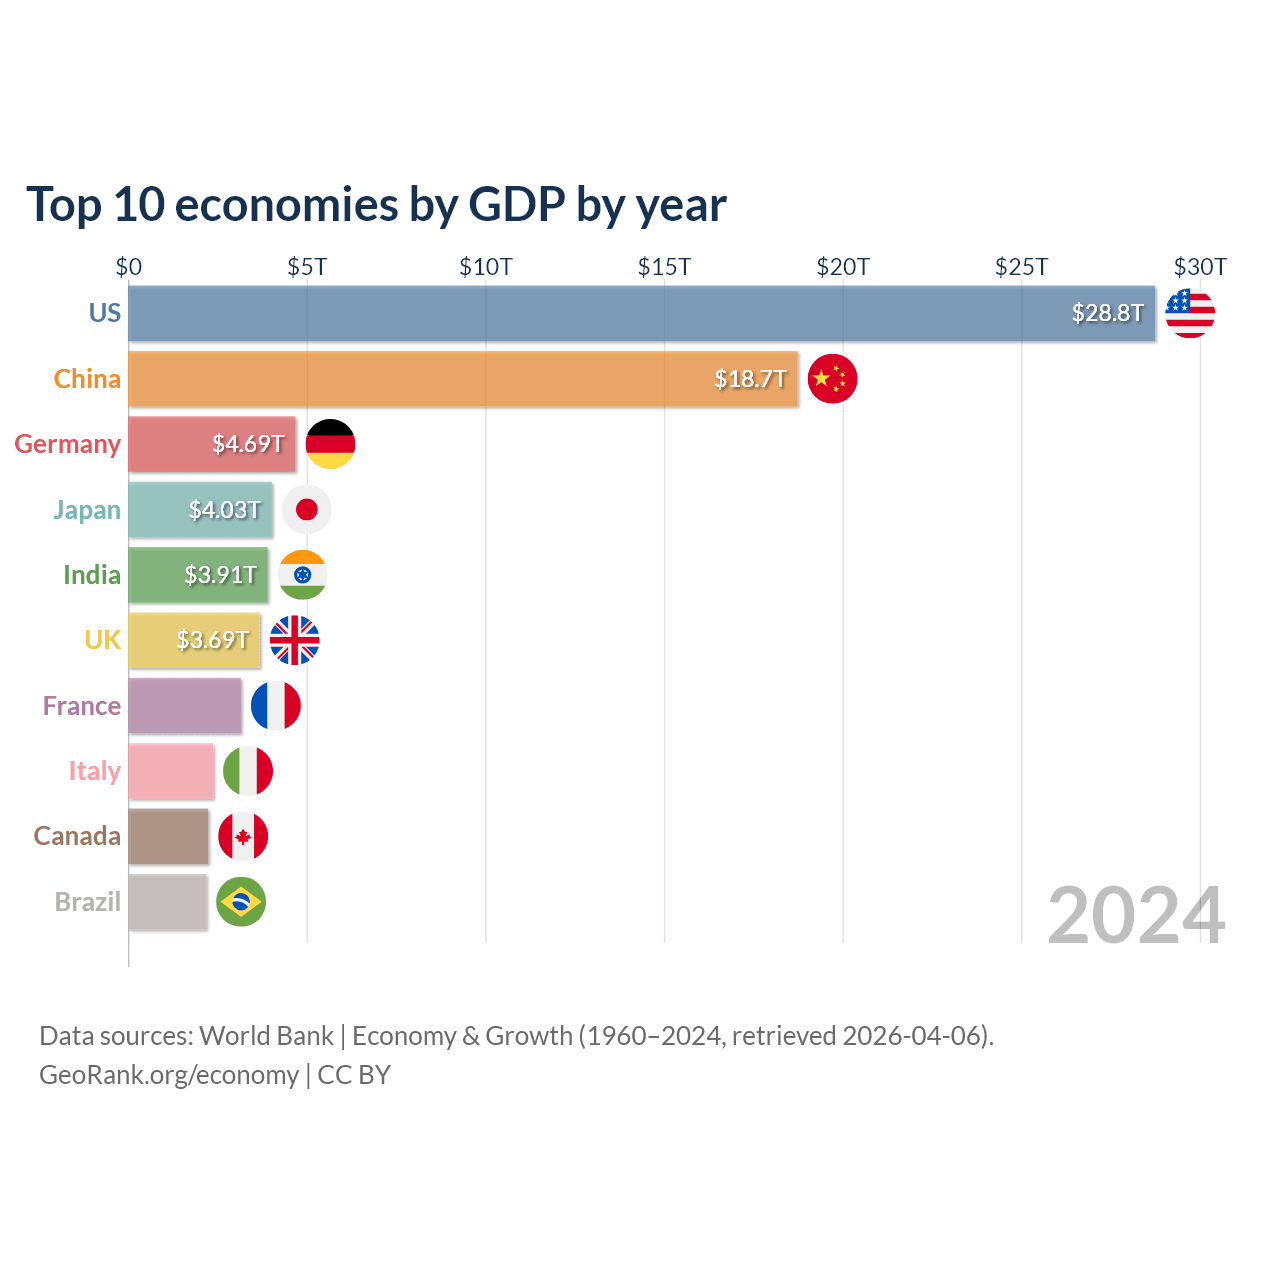
- The largest economy is the United States, with a GDP of $30.8T, accounting for 26% of the world’s GDP (down from 40% at its post-WWII peak).
- The US has a GDP roughly equal to the combined GDP of the 183 lowest-ranking countries.
- China's $19.5T economy accounted for approximately 16.5% of global GDP.
- The European Union’s 27 member states had a combined GDP of $21.2T, comparable to China’s and 31% less than the United States.
- Global debt stands at $111T or 94.5% of global GDP.
Countries ranked by GDP, GDP per capita, debt
This table of 197 countries ranked by GDP can also be sorted by GDP per capita, GDP per capita (PPP), or debt-to-GDP ratio.
| Rank | Country | GDP, $ | GDP growth YoY | GDP per capita, $ | GDP per capita, PPP $ | Debt-to-GDP ratio | Population |
|---|---|---|---|---|---|---|---|
| 1 |
 United States
|
30.8T | +2.16% | 90,027 | 85,810 | 123.9% | 342M |
| 2 |
 China
China
|
19.5T | +4.96% | 13,862 | 27,105 | 99.2% | 1.41B |
| 3 |
 Germany
|
5.05T | +0.24% | 60,496 | 73,552 | 62.9% | 83.5M |
| 4 |
 Japan
Japan
|
4.44T | +1.19% | 35,951 | 52,039 | 206.5% | 123M |
| 5 |
 United Kingdom
|
4T | +1.39% | 57,602 | 62,009 | 102.3% | 69.5M |
| 6 |
 India
India
|
3.96T | +7.57% | 2,702 | 11,160 | 84.1% | 1.46B |
| 7 |
 France
|
3.37T | +0.84% | 48,986 | 62,557 | 116% | 68.7M |
| 8 |
 Russia
|
2.56T | +1% | 17,847 | 47,362 | 17.2% | 144M |
| 9 |
 Italy
Italy
|
2.55T | +0.54% | 43,309 | 62,014 | 137.1% | 58.9M |
| 10 |
 Canada
|
2.32T | +1.74% | 55,698 | 64,610 | 113.5% | 41.7M |
| 11 |
 Brazil
|
2.28T | +2.29% | 10,713 | 22,338 | 93.3% | 213M |
| 12 |
 Spain
Spain
|
1.91T | +2.82% | 38,627 | 57,965 | 100.4% | 49.4M |
| 13 |
 South Korea
|
1.87T | +1.01% | 36,227 | 61,051 | 52.3% | 51.7M |
| 14 |
 Mexico
|
1.83T | +0.56% | 13,889 | 26,185 | 61.8% | 132M |
| 15 |
 Australia
|
1.8T | +1.35% | 65,130 | 72,111 | 51% | 27.6M |
| 16 |
 Turkey
|
1.6T | +3.6% | 18,599 | 45,639 | 23.5% | 85.9M |
| 17 |
 Indonesia
|
1.45T | +5.11% | 5,060 | 16,448 | 41% | 286M |
| 18 |
 Netherlands
|
1.33T | +1.78% | 73,684 | 86,174 | 43.3% | 18.1M |
| 19 |
 Saudi Arabia
|
1.28T | +4.5% | 34,537 | 71,375 | 31.7% | 37M |
| 20 |
 Switzerland
|
1.04T | +1.3% | 114,769 | 96,498 | 39.4% | 9.09M |
| 21 |
 Poland
|
1.04T | +3.57% | 28,420 | 51,263 | 58.8% | 36.4M |
| 22 |
 Taiwan
|
802B | +2.16% | 34,238 | 50,500 | 22.4% | 23.3M |
| 23 |
 Belgium
|
725B | +0.98% | 60,750 | 73,514 | 106.3% | 11.9M |
| 24 |
 Ireland
|
722B | +12.3% | 131,592 | 133,437 | 32.9% | 5.48M |
| 25 |
 Argentina
|
683B | +4.37% | 14,898 | 30,431 | 80.3% | 45.9M |
| 26 |
 Sweden
|
669B | +1.54% | 63,133 | 71,845 | 34.9% | 10.6M |
| 27 |
 Israel
|
611B | +2.93% | 60,337 | 57,236 | 68.5% | 10.1M |
| 28 |
 Singapore
|
604B | +5.03% | 98,814 | 150,689 | 171.3% | 6.11M |
| 29 |
 Austria
|
579B | +0.62% | 62,930 | 73,911 | 80.5% | 9.21M |
| 30 |
 Thailand
|
577B | +2.44% | 8,057 | 24,712 | 64.7% | 71.6M |
| 31 |
 UAE
UAE
|
552B | +3.99% | 50,274 | 79,229 | 34.3% | 11.5M |
| 32 |
 Norway
|
531B | +1.09% | 94,594 | 102,038 | 45% | 5.61M |
| 33 |
 Vietnam
|
515B | +8.02% | 5,066 | 16,386 | 30.3% | 102M |
| 34 |
 Philippines
|
487B | +4.4% | 4,171 | 11,794 | 59.4% | 117M |
| 35 |
 Malaysia
|
472B | +5.17% | 13,125 | 38,779 | 70.7% | 36M |
| 36 |
 Denmark
|
463B | +2.93% | 76,970 | 81,878 | 27.5% | 6.01M |
| 37 |
 Colombia
|
457B | +2.64% | 8,562 | 22,349 | 59.9% | 53.4M |
| 38 |
 Bangladesh
|
456B | +3.49% | 2,597 | 9,647 | 42% | 176M |
| 39 |
 Romania
|
429B | +0.68% | 22,538 | 49,077 | 60.6% | 19M |
| 40 |
 South Africa
|
427B | +1.11% | 6,598 | 15,456 | 78.6% | 64.7M |
| 41 |
 Pakistan
|
407B | +3.7% | 1,596 | 6,252 | 72.8% | 255M |
| 42 |
 Czech Republic
|
391B | +2.58% | 35,917 | 57,285 | 44.6% | 10.9M |
| 43 |
 Egypt
Egypt
|
365B | +4.39% | 3,086 | 19,094 | 86.8% | 118M |
| 44 |
 Iran
Iran
|
363B | -2.83% | 3,924 | 19,874 | 37.3% | 92.4M |
| 45 |
 Chile
Chile
|
357B | +2.46% | 17,995 | 36,181 | 41.8% | 19.9M |
| 46 |
 Portugal
|
347B | +1.86% | 32,082 | 51,680 | 89.9% | 10.8M |
| 47 |
 Peru
Peru
|
335B | +3.43% | 9,684 | 17,802 | 30.2% | 34.6M |
| 48 |
 Finland
|
317B | +0.17% | 56,149 | 65,378 | 89.3% | 5.65M |
| 49 |
 Kazakhstan
|
306B | +6.5% | 14,692 | 40,891 | 24.6% | 20.8M |
| 50 |
 Nigeria
|
291B | +4.01% | 1,224 | 9,087 | 35.5% | 238M |
| 51 |
 Algeria
|
287B | +3.82% | 6,051 | 17,621 | 54.1% | 47.4M |
| 52 |
 Greece
|
281B | +2.07% | 26,948 | 44,327 | 145.7% | 10.4M |
| 53 |
 New Zealand
|
264B | +0.46% | 49,591 | 55,551 | 54.7% | 5.32M |
| 54 |
 Iraq
Iraq
|
254B | -2.16% | 5,410 | 14,464 | 53.9% | 47M |
| 55 |
 Hungary
|
246B | +0.51% | 25,907 | 48,552 | 75.2% | 9.51M |
| 56 |
 Qatar
Qatar
|
216B | +2.9% | 72,525 | 126,046 | 41.4% | 2.97M |
| 57 |
 Ukraine
|
214B | +1.82% | 5,496 | 18,549 | 108.7% | 39M |
| 58 |
 Morocco
|
182B | +4.6% | 4,746 | 10,415 | 67.1% | 38.4M |
| 59 |
 Kuwait
|
157B | +2.73% | 32,312 | 52,444 | 14.6% | 4.87M |
| 60 |
 Slovakia
|
155B | +0.81% | 28,544 | 48,132 | 61.6% | 5.41M |
| 61 |
 Uzbekistan
|
147B | +7.7% | 3,968 | 11,879 | 28.6% | 37.1M |
| 62 |
 Kenya
Kenya
|
136B | +4.63% | 2,363 | 6,644 | 69.3% | 57.5M |
| 63 |
 Bulgaria
|
131B | +3.1% | 20,328 | 41,969 | 27.1% | 6.43M |
| 64 |
 Ecuador
|
130B | +3.73% | 7,125 | 15,840 | 54.4% | 18.3M |
| 65 |
 Dominican Republic
|
127B | +2.12% | 11,059 | 27,542 | 59% | 11.5M |
| 66 |
 Ethiopia
|
126B | +9.77% | 933 | 3,288 | 43.1% | 135M |
| 67 |
 Guatemala
|
123B | +4.28% | 6,598 | 14,369 | 27.2% | 18.7M |
| 68 |
 Angola
|
122B | +3.13% | 3,129 | 10,119 | 51.3% | 39M |
| 69 |
 Ghana
Ghana
|
114B | +5.95% | 3,257 | 8,020 | 48.8% | 35.1M |
| 70 |
 Oman
Oman
|
110B | +2.4% | 19,947 | 41,740 | 35.8% | 5.49M |
| 71 |
 Sri Lanka
|
109B | +4.95% | 5,002 | 15,633 | 100.8% | 21.8M |
| 72 |
 Cuba
Cuba
|
107B | -1.06% | 9,605 | 12,300 | n/a | 10.9M |
| 73 |
 Croatia
|
105B | +3.4% | 27,104 | 49,551 | 55.9% | 3.88M |
| 74 |
 Costa Rica
|
103B | +4.56% | 19,970 | 31,107 | 60.4% | 5.15M |
| 75 |
 Luxembourg
|
101B | +0.64% | 147,252 | 155,941 | 27% | 687K |
| 76 |
 Serbia
|
100B | +2.03% | 15,262 | 32,832 | 42.4% | 6.55M |
| 77 |
 Ivory Coast
|
99.8B | +6.5% | 3,050 | 7,669 | 56.3% | 32.7M |
| 78 |
 Venezuela
|
99.7B | +1.57% | 3,495 | 21,241 | 309% | 28.5M |
| 79 |
 Lithuania
|
95.2B | +2.92% | 32,959 | 55,286 | 39.8% | 2.89M |
| 80 |
 Belarus
|
93.4B | +1.3% | 10,279 | 33,010 | 33.1% | 9.09M |
| 81 |
 DR Congo
|
91B | +5.76% | 807 | 1,821 | 20.2% | 113M |
| 82 |
 Panama
|
90.5B | +4.35% | 19,790 | 41,369 | 56.6% | 4.57M |
| 83 |
 Tanzania
|
90.1B | +5.85% | 1,278 | 4,221 | 49.7% | 70.5M |
| 84 |
 Uruguay
|
85.3B | +1.78% | 25,216 | 36,418 | 65.7% | 3.38M |
| 85 |
 Myanmar
|
81.7B | -2.01% | 1,489 | 5,997 | 51.9% | 54.9M |
| 86 |
 Slovenia
|
79.6B | +1.06% | 37,376 | 57,186 | 65.9% | 2.13M |
| 87 |
 Azerbaijan
|
75.9B | +1.45% | 7,411 | 25,089 | 20.1% | 10.2M |
| 88 |
 Bolivia
|
64.8B | -1.58% | 5,148 | 12,878 | 84.8% | 12.6M |
| 89 |
 Uganda
|
62B | +6.33% | 1,206 | 3,273 | 54.2% | 51.4M |
| 90 |
 Jordan
|
61.6B | +2.83% | 5,348 | 10,821 | 82.8% | 11.5M |
| 91 |
 Sudan
Sudan
|
60.2B | +3.06% | 1,165 | 2,116 | 187.6% | 51.7M |
| 92 |
 Cameroon
|
58.9B | +3.2% | 1,972 | 5,589 | 40.4% | 29.9M |
| 93 |
 Tunisia
|
57.5B | +2.49% | 4,657 | 14,521 | 81.3% | 12.3M |
| 94 |
 Cambodia
|
51.3B | +5.35% | 2,872 | 7,967 | 26.5% | 17.8M |
| 95 |
 Zimbabwe
|
51.2B | +8.11% | 3,021 | 5,928 | 43.8% | 17M |
| 96 |
 Turkmenistan
|
49.8B | +6.3% | 6,540 | 21,213 | 3.76% | 7.62M |
| 97 |
 Paraguay
|
49.3B | +6.64% | 7,027 | 18,524 | 38.1% | 7.01M |
| 98 |
 Bahrain
|
49B | +3.48% | 30,597 | 66,941 | 147.6% | 1.6M |
| 99 |
 Latvia
|
48.6B | +2.14% | 26,312 | 43,394 | 46.9% | 1.85M |
| 100 |
 Libya
Libya
|
48.1B | +13.4% | 6,449 | 14,304 | n/a | 7.46M |
| 101 |
 Estonia
|
47B | +0.58% | 34,418 | 49,969 | 24.2% | 1.37M |
| 102 |
 Nepal
Nepal
|
45.5B | +4.43% | 1,536 | 5,737 | 48.1% | 29.6M |
| 103 |
 Cyprus
|
41.2B | +3.77% | 30,075 | 63,007 | 55.3% | 1.37M |
| 104 |
 Honduras
|
39.6B | +3.75% | 3,598 | 7,486 | 41.2% | 11M |
| 105 |
 Iceland
|
38.6B | +1.28% | 98,323 | 84,257 | 56.1% | 392K |
| 106 |
 Georgia
|
38.1B | +7.46% | 9,692 | 28,285 | 34.3% | 3.94M |
| 107 |
 Senegal
|
37B | +6.68% | 1,955 | 5,071 | 130.2% | 18.9M |
| 108 |
 El Salvador
|
36.7B | +3.91% | 5,767 | 13,264 | 87.2% | 6.37M |
| 109 |
 North Korea
|
34.9B | n/a | 1,319 | 1,700 | n/a | 26.6M |
| 110 |
 Bosnia
|
32.6B | +2.13% | 10,382 | 25,043 | 29.9% | 3.14M |
| 111 |
 Papua New Guinea
|
32.5B | +5.64% | 3,020 | 4,875 | 52.1% | 10.8M |
| 112 |
 Haiti
Haiti
|
32.1B | -2.71% | 2,694 | 3,194 | 12.3% | 11.9M |
| 113 |
 Albania
|
30.5B | +3.79% | 12,998 | 26,702 | 52.6% | 2.35M |
| 114 |
 Mali
Mali
|
30.1B | +5.6% | 1,193 | 3,315 | 41.9% | 25.2M |
| 115 |
 Armenia
|
29.2B | +7.2% | 9,474 | 22,823 | 49% | 3.09M |
| 116 |
 Zambia
|
28.9B | +3.76% | 1,318 | 4,215 | 86% | 21.9M |
| 117 |
 Guinea
|
28.3B | +7.45% | 1,877 | 4,565 | 48.1% | 15.1M |
| 118 |
 Malta
Malta
|
27.8B | +3.96% | 47,907 | 69,864 | 46.8% | 580K |
| 119 |
 Burkina Faso
|
27.6B | +5.29% | 1,148 | 2,896 | 52% | 24.1M |
| 120 |
 Guyana
|
27.1B | +19.3% | 32,414 | 80,155 | 28.6% | 836K |
| 121 |
 Lebanon
|
26B | -7.08% | 4,473 | 12,575 | 139.4% | 5.85M |
| 122 |
 Trinidad
|
25.9B | -0.79% | 18,967 | 36,329 | 84.2% | 1.37M |
| 123 |
 Mongolia
|
25.4B | +6.84% | 7,108 | 19,145 | 45.1% | 3.57M |
| 124 |
 Benin
Benin
|
24.6B | +8.07% | 1,658 | 4,435 | 57.3% | 14.8M |
| 125 |
 Jamaica
|
22.7B | +0.08% | 8,003 | 12,890 | 67.7% | 2.84M |
| 126 |
 Kyrgyzstan
|
22.6B | +11.1% | 3,081 | 8,012 | 36% | 7.34M |
| 127 |
 Mozambique
|
22.3B | -0.52% | 627 | 1,705 | 102.5% | 35.6M |
| 128 |
 Nicaragua
|
22.2B | +4.92% | 3,173 | 8,709 | 34.8% | 7.01M |
| 129 |
 Niger
Niger
|
21.6B | +7.01% | 775 | 2,050 | 45.4% | 27.9M |
| 130 |
 Yemen
Yemen
|
21.6B | +0.75% | 634 | 3,164 | 70.9% | 41.8M |
| 131 |
 Chad
Chad
|
21.5B | +5.59% | 1,022 | 2,743 | 30.4% | 21M |
| 132 |
 Gabon
Gabon
|
21.4B | +2.47% | 8,263 | 21,510 | 78.9% | 2.59M |
| 133 |
 Moldova
|
20.4B | +2.42% | 8,622 | 18,615 | 36.6% | 2.36M |
| 134 |
 Syria
Syria
|
20B | -1.85% | 847 | 4,650 | 30% | 25.6M |
| 135 |
 Botswana
|
19.9B | -0.73% | 7,778 | 20,538 | 38.6% | 2.56M |
| 136 |
 Madagascar
|
19.6B | +3% | 599 | 1,884 | 48.7% | 32.7M |
| 137 |
 North Macedonia
|
19.1B | +3.49% | 10,490 | 26,995 | 52.5% | 1.82M |
| 138 |
 Laos
Laos
|
18.3B | +4.54% | 2,325 | 9,776 | 80.6% | 7.87M |
| 139 |
 Afghanistan
|
17.8B | +1.87% | 417 | 2,202 | 7.98% | 43.8M |
| 140 |
 Tajikistan
|
17.7B | +8.4% | 1,637 | 5,406 | 21.6% | 10.8M |
| 141 |
 Palestine
|
17.2B | +4.34% | 3,171 | 4,371 | n/a | 5.41M |
| 142 |
 Rwanda
|
16.4B | +9.38% | 1,124 | 3,711 | 64.6% | 14.6M |
| 143 |
 Congo
Congo
|
16.3B | +3.08% | 2,515 | 7,026 | 96.8% | 6.48M |
| 144 |
 Mauritius
|
16.2B | +3.15% | 12,991 | 31,840 | 86.5% | 1.24M |
| 145 |
 Bahamas
|
15.8B | +3.38% | 39,455 | 41,198 | 73.8% | 403K |
| 146 |
 Namibia
|
15.1B | +1.73% | 4,876 | 11,687 | 70.2% | 3.09M |
| 147 |
 Brunei
|
15B | +0.67% | 32,235 | 89,879 | 1.54% | 466K |
| 148 |
 Malawi
|
14.9B | +1.89% | 672 | 1,858 | 78.4% | 22.2M |
| 149 |
 Somalia
|
13B | +2.99% | 661 | 1,602 | n/a | 19.7M |
| 150 |
 Equatorial Guinea
|
12.8B | -5.85% | 6,615 | 17,567 | 40.6% | 1.94M |
| 151 |
 South Sudan
|
12B | -10.8% | 1,080 | 1,155 | 62.1% | 12.2M |
| 152 |
 Togo
Togo
|
11.9B | +6.31% | 1,384 | 3,365 | 63% | 8.59M |
| 153 |
 Mauritania
|
11.7B | +4.03% | 2,198 | 7,369 | 40.1% | 5.32M |
| 154 |
 Monaco
|
11.1B | +8.51% | 288,002 | 115,700 | n/a | 38.3K |
| 155 |
 Montenegro
|
9.23B | +2.74% | 14,817 | 34,063 | 67.1% | 623K |
| 156 |
 Liechtenstein
|
8.91B | n/a | 220,167 | 139,100 | n/a | 41K |
| 157 |
 Barbados
|
8.02B | +2.7% | 28,365 | 24,823 | 94.2% | 283K |
| 158 |
 Cayman Islands
|
7.77B | +3.76% | 104,293 | 88,428 | n/a | 75.8K |
| 159 |
 Maldives
|
7.74B | +6.31% | 14,615 | 26,183 | 125.4% | 530K |
| 160 |
 Sierra Leone
|
7.46B | +4.61% | 846 | 3,522 | 45.2% | 8.82M |
| 161 |
 Fiji
Fiji
|
6.2B | +3.2% | 6,642 | 15,450 | 78.7% | 933K |
| 162 |
 Liberia
|
5.25B | +5.02% | 915 | 1,871 | 54.9% | 5.73M |
| 163 |
 Eswatini
|
5.16B | +4.19% | 4,108 | 11,799 | 44.9% | 1.26M |
| 164 |
 Djibouti
|
4.62B | +6.5% | 3,906 | 7,810 | 32.1% | 1.18M |
| 165 |
 Suriname
|
4.52B | +1.79% | 7,070 | 21,801 | 105.8% | 640K |
| 166 |
 Andorra
|
4.5B | +3.87% | 54,292 | 74,939 | n/a | 82.9K |
| 167 |
 Bhutan
|
3.58B | +8.01% | 4,493 | 16,215 | 103.6% | 797K |
| 168 |
 Curacao
|
3.56B | +5.03% | 22,833 | 32,693 | n/a | 156K |
| 169 |
 Burundi
|
3.36B | +4.24% | 233.8 | 1,195 | 41.2% | 14.4M |
| 170 |
 Belize
|
3.33B | +2.75% | 7,865 | 14,347 | 67.9% | 423K |
| 171 |
 CAR
CAR
|
3.07B | +4.5% | 556 | 1,263 | 61.8% | 5.51M |
| 172 |
 Cape Verde
|
3.06B | +6.3% | 5,796 | 11,195 | 101% | 527K |
| 173 |
 Saint Lucia
|
2.66B | -0.57% | 14,746 | 27,567 | 77.1% | 180K |
| 174 |
 Gambia
|
2.59B | +5.89% | 919 | 3,476 | 73.9% | 2.82M |
| 175 |
 Lesotho
|
2.57B | +1.98% | 1,089 | 3,001 | 49.1% | 2.36M |
| 176 |
 Guinea-Bissau
|
2.53B | +5.82% | 1,124 | 3,119 | 75.3% | 2.25M |
| 177 |
 Seychelles
|
2.39B | +5.8% | 19,449 | 33,239 | 51.5% | 123K |
| 178 |
 Antigua
|
2.34B | +5% | 24,819 | 33,386 | 69.7% | 94.2K |
| 179 |
 Eritrea
|
2.07B | +8.68% | 689 | 1,742 | 260.4% | 3.61M |
| 180 |
 San Marino
|
2.03B | +0.4% | 59,871 | 78,745 | 60.6% | 34.1K |
| 181 |
 East Timor
|
1.9B | +6.98% | 1,341 | 4,423 | 14.3% | 1.42M |
| 182 |
 Comoros
|
1.81B | +3.75% | 2,056 | 3,959 | 29.5% | 883K |
| 183 |
 Solomon Islands
|
1.75B | +3.62% | 2,086 | 2,675 | 28.7% | 839K |
| 184 |
 Grenada
|
1.42B | +4.41% | 12,107 | 20,178 | 71.6% | 117K |
| 185 |
 Vanuatu
|
1.35B | +3.05% | 4,039 | 3,606 | 40.9% | 335K |
| 186 |
 Samoa
Samoa
|
1.29B | +4.2% | 5,873 | 8,737 | 21.2% | 219K |
| 187 |
 Saint Vincent
|
1.26B | +3.39% | 12,562 | 21,272 | 113.4% | 99.9K |
| 188 |
 Saint Kitts
|
1.18B | +2.69% | 25,223 | 34,847 | 58.4% | 46.9K |
| 189 |
 Sao Tome
|
981M | +1.03% | 4,084 | 6,242 | 55.7% | 240K |
| 190 |
 Dominica
|
724M | +3.05% | 10,989 | 21,301 | 102.6% | 65.9K |
| 191 |
 Tonga
Tonga
|
679M | +2.8% | 6,547 | 7,803 | 27.4% | 104K |
| 192 |
 Kiribati
|
349M | +4.22% | 2,559 | 3,702 | 7.95% | 136K |
| 193 |
 Palau
Palau
|
345M | +6.29% | 19,532 | 18,230 | n/a | 17.7K |
| 194 |
 Marshall Islands
|
308M | +2.28% | 8,489 | 8,195 | 11.8% | 36.3K |
| 195 |
 Nauru
Nauru
|
176M | +2.14% | 14,640 | 14,173 | 14.6% | 12K |
| 196 |
 Tuvalu
|
62.3M | +3.85% | 6,345 | 6,151 | 3.6% | 9.49K |
| 197 |
 Vatican
|
19.8M | n/a | 19,800 | 39,191 | n/a | 1K |
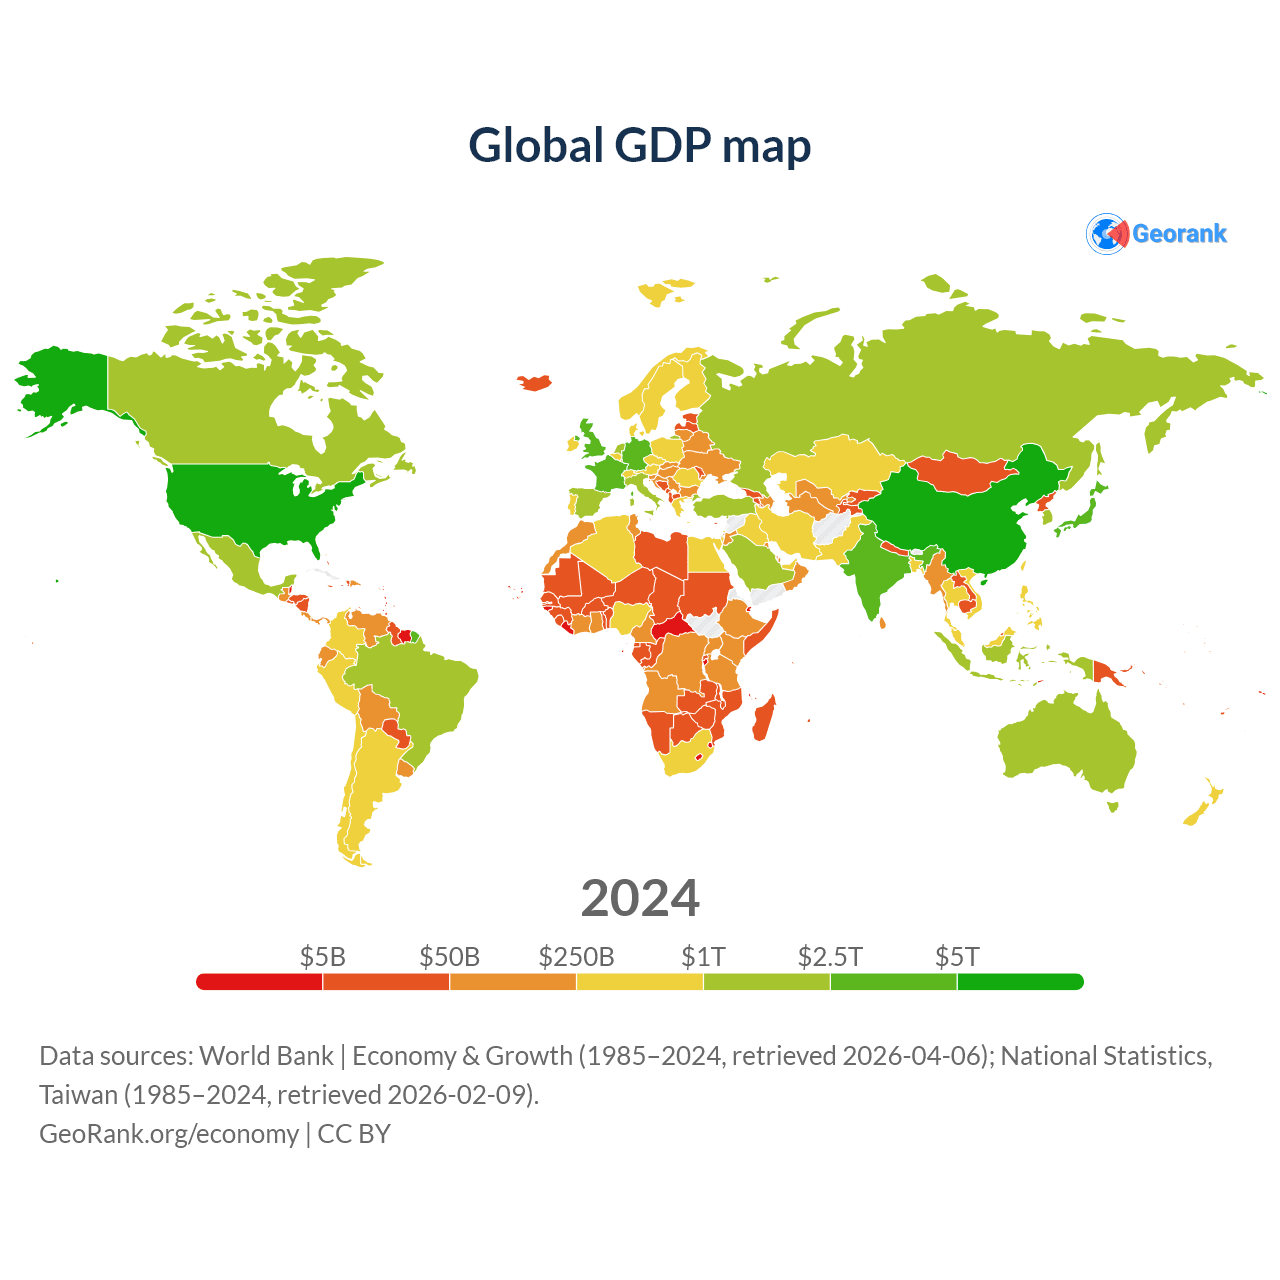
Global GDP map
Data sources: World Bank | Economy & Growth (1985–2025, retrieved 2026-07-08); National Statistics, Taiwan (1985–2024, retrieved 2026-07-08).
GeoRank.org/economy | CC BY 
This interactive world map shows GDP by country, color-coded by economic output. Compare the largest and smallest economies to see how GDP is distributed across continents and regions by year.
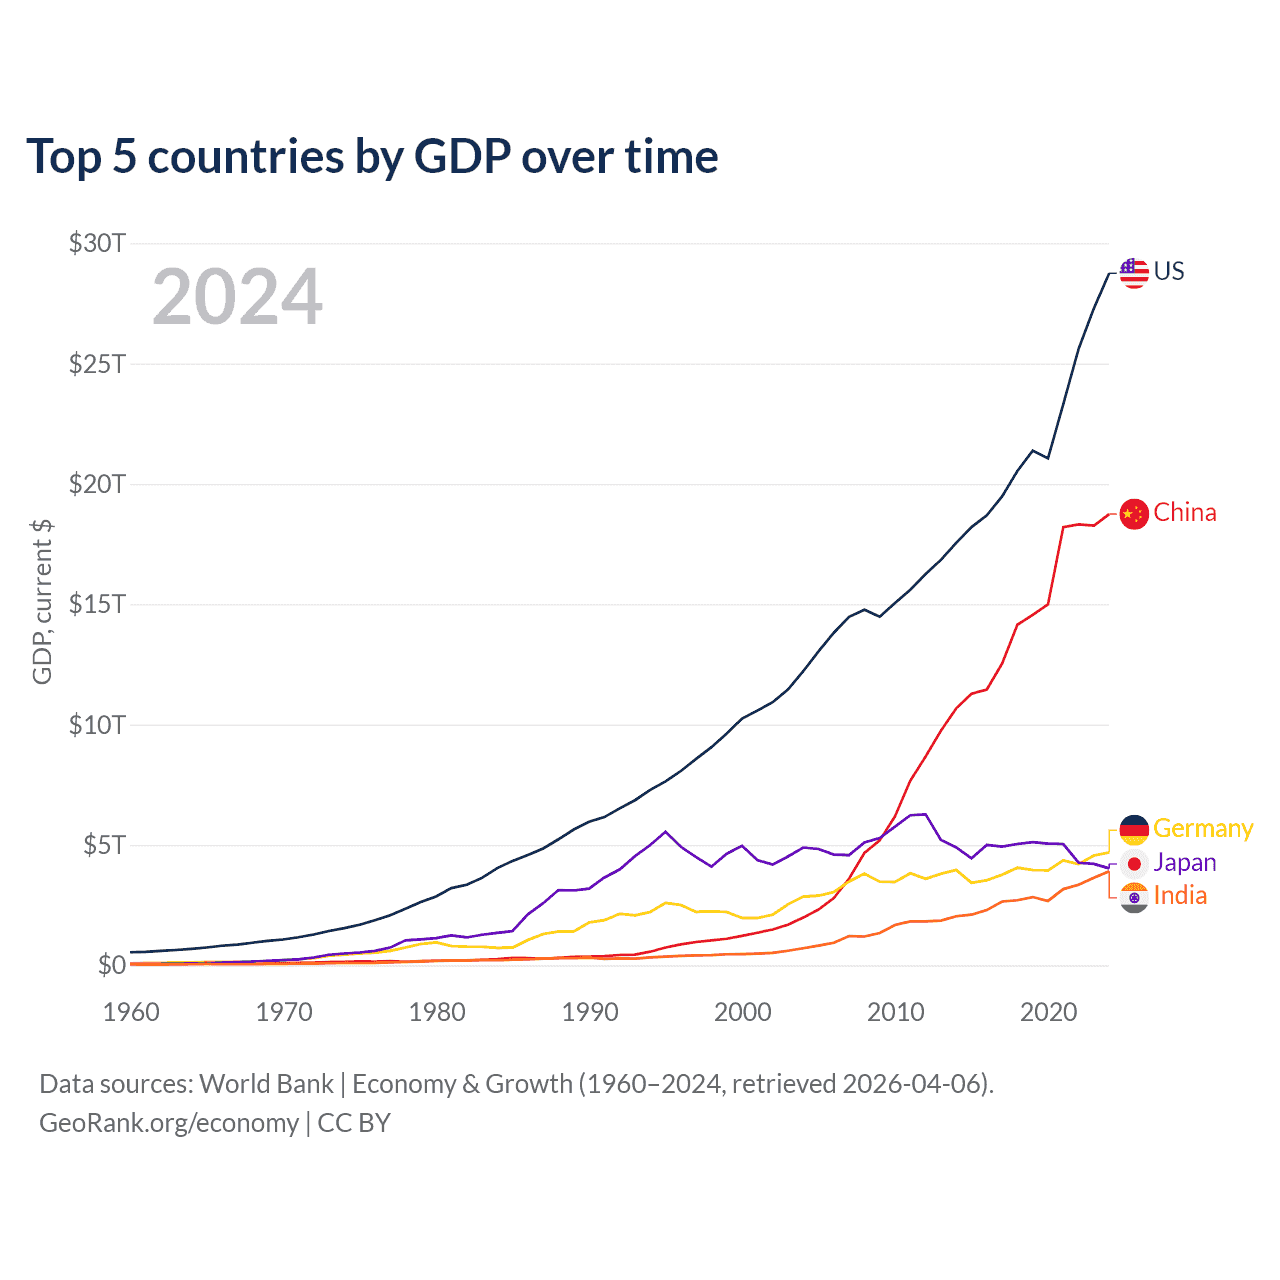
Top 5 countries by GDP over time
| Year | GDP, current $ | ||||
|---|---|---|---|---|---|
| United States | China | Germany | Japan | United Kingdom | |
| 2025 | $30,769,700,000,000 | $19,498,039,388,043 | $5,050,922,925,047 | $4,435,162,999,977 | $4,002,587,541,846 |
| 2024 | $29,298,013,000,000 | $18,729,668,435,848 | $4,685,592,577,805 | $4,190,008,188,359 | $3,695,539,513,534 |
| 2023 | $27,811,517,000,000 | $18,270,356,654,533 | $4,562,207,532,490 | $4,384,854,269,962 | $3,420,796,653,789 |
| 2022 | $26,054,614,000,000 | $18,316,765,021,690 | $4,201,021,706,479 | $4,447,976,207,315 | $3,181,244,350,465 |
| 2021 | $23,725,645,000,000 | $18,201,698,719,564 | $4,355,251,953,411 | $5,225,933,520,753 | $3,194,559,188,926 |
| 2020 | $21,375,281,000,000 | $14,996,414,166,715 | $3,941,398,957,074 | $5,189,197,543,645 | $2,724,001,478,305 |
| 2019 | $21,539,982,000,000 | $14,560,167,101,283 | $3,959,894,794,039 | $5,245,755,000,479 | $2,875,710,080,015 |
| 2018 | $20,656,516,000,000 | $14,147,765,772,964 | $4,055,433,215,302 | $5,154,293,721,630 | $2,897,028,009,916 |
| 2017 | $19,612,102,000,000 | $12,537,559,062,283 | $3,765,351,626,106 | $5,038,231,631,661 | $2,699,118,387,873 |
| 2016 | $18,804,913,000,000 | $11,456,024,084,962 | $3,536,787,895,179 | $5,110,357,383,254 | $2,706,807,606,539 |
| 2015 | $18,295,019,000,000 | $11,280,814,787,469 | $3,425,099,578,746 | $4,534,438,580,495 | $2,945,579,890,258 |
| 2014 | $17,608,138,000,000 | $10,674,533,168,257 | $3,964,870,735,761 | $4,985,763,289,561 | $3,085,362,169,410 |
| 2013 | $16,880,683,000,000 | $9,743,124,247,267 | $3,807,023,797,051 | $5,272,297,037,397 | $2,796,908,333,283 |
| 2012 | $16,253,970,000,000 | $8,673,664,713,189 | $3,596,483,233,406 | $6,333,803,928,788 | $2,719,715,961,540 |
| 2011 | $15,599,732,000,000 | $7,671,757,207,851 | $3,823,575,803,794 | $6,279,422,550,219 | $2,675,590,034,129 |
| 2010 | $15,048,971,000,000 | $6,192,564,874,453 | $3,467,093,769,667 | $5,811,578,109,447 | $2,496,740,681,057 |
| 2009 | $14,478,067,000,000 | $5,189,577,094,998 | $3,478,545,516,684 | $5,336,765,697,589 | $2,429,358,155,476 |
| 2008 | $14,769,862,000,000 | $4,667,346,414,522 | $3,808,197,720,125 | $5,160,197,175,876 | $2,945,251,838,235 |
| 2007 | $14,474,228,000,000 | $3,604,055,822,572 | $3,484,056,680,855 | $4,624,670,179,655 | $3,104,699,879,952 |
| 2006 | $13,815,583,000,000 | $2,791,498,472,804 | $3,046,308,753,671 | $4,648,058,930,707 | $2,719,558,417,663 |
| 2005 | $13,039,197,000,000 | $2,317,551,298,052 | $2,893,393,187,362 | $4,875,648,486,366 | $2,551,361,818,182 |
| 2004 | $12,217,196,000,000 | $1,984,196,551,300 | $2,852,317,768,062 | $4,941,485,123,807 | $2,429,774,807,763 |
| 2003 | $11,456,450,000,000 | $1,683,903,309,844 | $2,534,715,518,349 | $4,573,413,206,709 | $2,061,227,755,102 |
| 2002 | $10,929,108,000,000 | $1,489,821,682,051 | $2,102,350,798,306 | $4,245,946,980,572 | $1,790,536,570,743 |
| 2001 | $10,581,929,000,000 | $1,355,036,590,252 | $1,966,381,496,642 | $4,438,792,748,062 | $1,656,171,009,069 |
| 2000 | $10,250,952,000,000 | $1,223,754,919,971 | $1,966,980,701,145 | $5,042,381,838,343 | $1,671,597,821,153 |
| 1999 | $9,631,172,000,000 | $1,103,843,203,576 | $2,213,873,468,587 | $4,688,983,449,627 | $1,693,458,987,219 |
| 1998 | $9,062,817,000,000 | $1,037,134,141,760 | $2,247,760,364,566 | $4,150,359,076,370 | $1,660,821,464,061 |
| 1997 | $8,577,552,000,000 | $967,753,570,435 | $2,218,790,886,533 | $4,579,780,793,432 | $1,569,317,288,802 |
| 1996 | $8,073,122,000,000 | $868,523,936,530 | $2,506,576,553,158 | $5,021,441,618,840 | $1,425,287,051,482 |
| 1995 | $7,639,749,000,000 | $738,190,896,228 | $2,593,053,091,306 | $5,639,649,753,986 | $1,349,094,208,616 |
| 1994 | $7,287,236,000,000 | $566,929,539,493 | $2,215,282,632,277 | $5,104,063,486,348 | $1,140,489,745,944 |
| 1993 | $6,858,559,000,000 | $446,557,291,212 | $2,078,954,217,438 | $4,632,480,515,091 | $1,061,388,722,256 |
| 1992 | $6,520,327,000,000 | $428,502,354,788 | $2,141,377,582,968 | $4,064,529,567,505 | $1,179,659,529,660 |
| 1991 | $6,158,129,000,000 | $384,510,452,962 | $1,875,792,575,133 | $3,724,887,648,862 | $1,142,797,178,131 |
| 1990 | $5,963,144,000,000 | $361,560,229,446 | $1,778,162,195,860 | $3,252,994,239,867 | $1,093,169,389,205 |
| 1989 | $5,641,580,000,000 | $348,380,566,802 | $1,404,092,925,205 | $3,174,934,735,896 | $926,884,816,754 |
| 1988 | $5,236,438,000,000 | $312,888,888,889 | $1,406,367,016,372 | $3,191,546,727,316 | $910,122,732,124 |
| 1987 | $4,855,215,000,000 | $273,455,156,951 | $1,302,932,318,825 | $2,635,094,473,494 | $745,162,608,269 |
| 1986 | $4,579,631,000,000 | $301,310,144,928 | $1,050,092,624,516 | $2,164,729,071,349 | $601,452,653,181 |
| 1985 | $4,338,979,000,000 | $310,064,625,850 | $735,218,723,093 | $1,457,070,301,468 | $489,285,164,271 |
| 1984 | $4,037,613,000,000 | $260,442,857,143 | $727,767,760,979 | $1,374,165,212,365 | $461,487,097,632 |
| 1983 | $3,634,038,000,000 | $231,130,268,199 | $773,507,930,295 | $1,297,622,008,229 | $489,618,008,186 |
| 1982 | $3,343,789,000,000 | $205,480,916,031 | $779,421,633,755 | $1,183,132,285,328 | $515,048,916,841 |
| 1981 | $3,207,041,000,000 | $196,218,253,968 | $803,404,797,058 | $1,271,443,597,067 | $540,765,675,241 |
| 1980 | $2,857,307,000,000 | $191,487,500,000 | $953,772,499,462 | $1,153,159,955,513 | $564,947,710,899 |
| 1979 | $2,627,333,000,000 | $178,573,913,043 | $884,574,218,333 | $1,100,608,979,757 | $438,994,070,309 |
| 1978 | $2,351,599,000,000 | $149,788,617,886 | $743,182,891,918 | $1,057,419,758,047 | $335,883,029,722 |
| 1977 | $2,081,826,000,000 | $175,226,595,860 | $602,698,323,086 | $752,590,681,822 | $263,066,457,352 |
| 1976 | $1,873,412,000,000 | $154,196,810,059 | $521,658,712,133 | $611,495,350,304 | $232,614,555,256 |
| 1975 | $1,684,904,000,000 | $163,687,619,736 | $492,434,094,920 | $544,082,569,364 | $241,756,637,168 |
| 1974 | $1,545,243,000,000 | $144,418,433,058 | $446,934,971,657 | $500,355,087,138 | $206,131,369,799 |
| 1973 | $1,425,376,000,000 | $138,764,340,892 | $399,833,571,167 | $450,756,970,744 | $192,537,971,583 |
| 1972 | $1,279,110,000,000 | $113,871,930,714 | $300,899,944,795 | $331,776,379,992 | $169,965,034,965 |
| 1971 | $1,164,850,000,000 | $99,959,013,880 | $250,900,942,397 | $250,530,994,765 | $148,113,896,325 |
| 1970 | $1,073,303,000,000 | $92,752,930,873 | $216,629,229,947 | $221,798,003,144 | $130,671,946,244 |
| 1969 | $1,017,438,172,414 | $79,847,786,729 | $177,733,486,326 | $188,179,852,753 | $116,464,702,803 |
| 1968 | $940,225,000,000 | $70,980,323,819 | $156,527,292,653 | $160,201,483,788 | $107,759,910,068 |
| 1967 | $859,620,034,483 | $73,011,350,596 | $145,100,667,773 | $135,265,319,098 | $113,116,888,211 |
| 1966 | $813,032,758,621 | $76,854,053,259 | $143,304,275,684 | $115,427,351,851 | $108,572,752,102 |
| 1965 | $741,904,862,069 | $70,565,994,356 | $134,774,688,191 | $99,387,878,008 | $101,824,755,079 |
| 1964 | $684,144,620,690 | $59,821,862,703 | $123,330,404,665 | $89,332,989,729 | $94,407,558,351 |
| 1963 | $637,058,551,724 | $50,812,227,919 | $112,232,503,744 | $75,945,582,324 | $86,561,961,812 |
| 1962 | $603,639,413,793 | $47,310,737,754 | $105,895,435,234 | $66,356,388,224 | $81,247,564,157 |
| 1961 | $561,940,310,345 | $50,162,299,350 | $96,558,204,043 | $58,472,696,006 | $77,741,965,703 |
| 1960 | $541,988,586,207 | $59,846,235,025 | $84,619,845,881 | $48,417,804,545 | $73,233,967,692 |
Data sources: World Bank | Economy & Growth (1960–2025, retrieved 2026-07-08).
GeoRank.org/economy | CC BY
In 2025, the 5 largest economies were the United States ($30.8T), China ($19.5T), Germany ($5.05T), Japan ($4.44T), and the United Kingdom ($4T). Together, these countries account for 53.9% of global GDP.
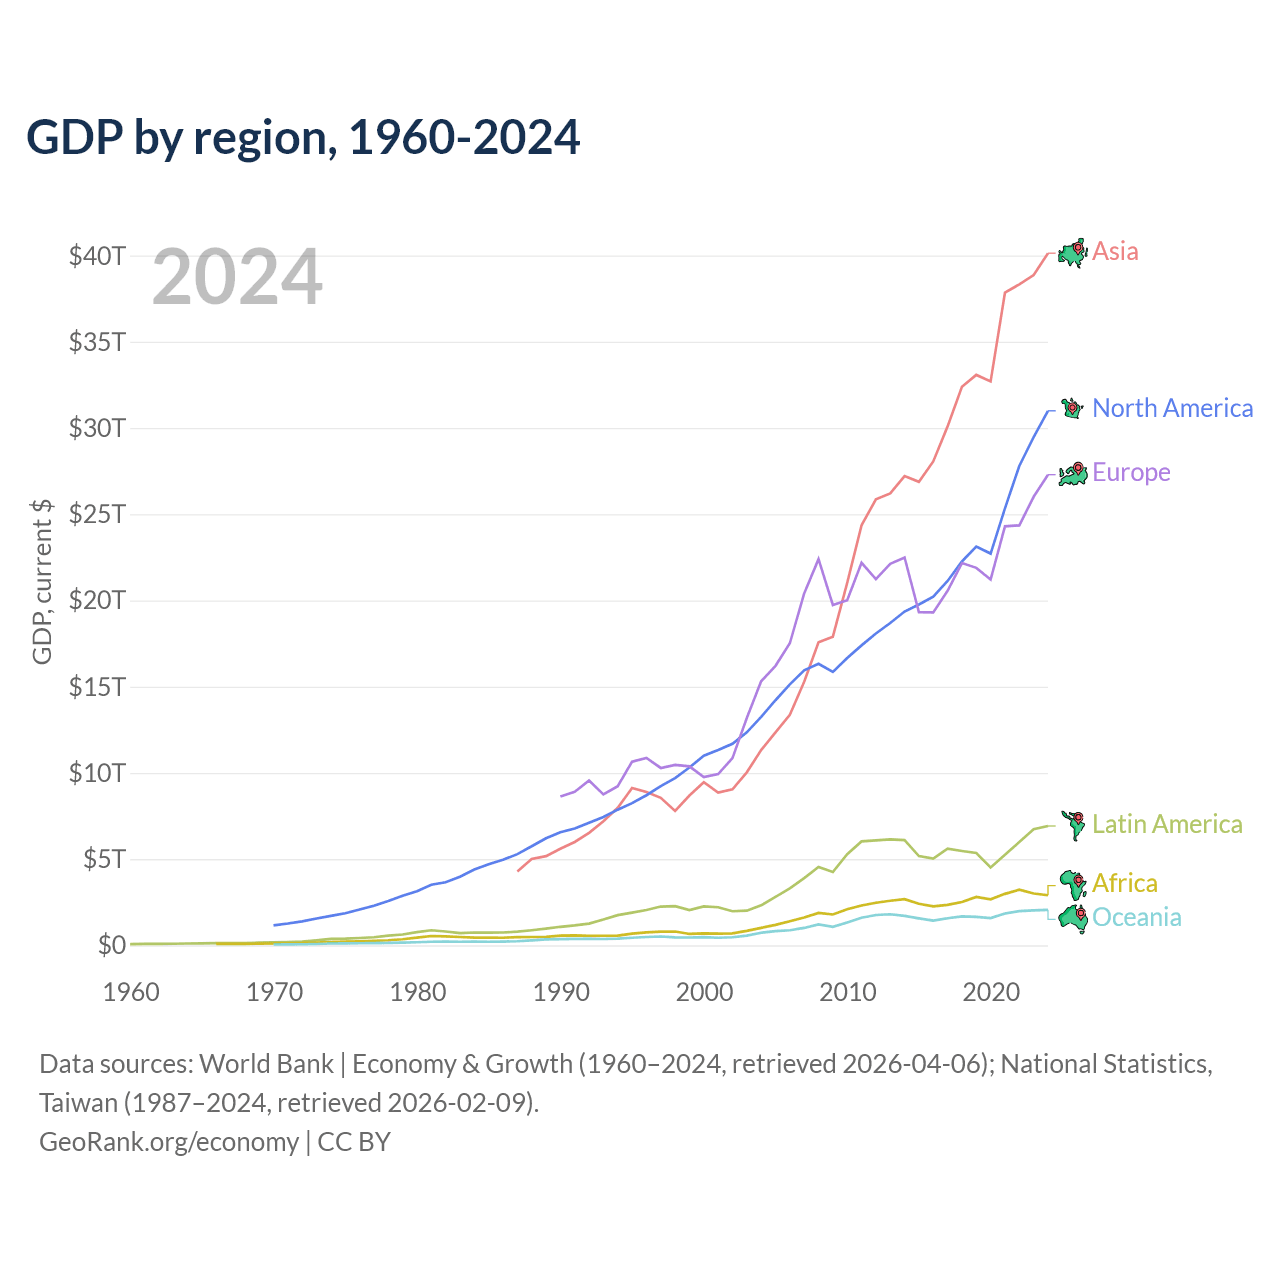
GDP by region, 1960-2025
| Year | GDP, current $ | |||||
|---|---|---|---|---|---|---|
| Asia | North America | Europe | Latin America | Africa | Oceania | |
| 2025 | $41,998,501,051,656 | $33,089,907,772,426 | $29,966,440,583,824 | $7,193,085,672,233 | $3,160,575,673,610 | $2,107,278,065,897 |
| 2024 | $40,188,277,545,660 | $31,568,374,189,683 | $27,372,930,998,809 | $6,896,259,127,800 | $2,916,062,589,916 | $2,060,892,731,747 |
| 2023 | $38,905,923,386,717 | $30,008,374,836,347 | $26,039,089,245,358 | $6,728,485,134,162 | $3,007,302,721,668 | $2,032,238,381,435 |
| 2022 | $38,425,071,852,878 | $28,255,435,508,546 | $24,404,620,753,445 | $5,987,962,822,266 | $3,221,519,830,803 | $1,986,804,684,289 |
| 2021 | $38,031,410,741,201 | $25,748,284,196,397 | $24,340,075,337,778 | $5,249,338,958,204 | $2,984,876,919,227 | $1,849,384,291,341 |
| 2020 | $32,830,119,629,456 | $23,031,209,766,882 | $21,237,048,494,018 | $4,514,305,089,245 | $2,671,596,305,144 | $1,579,316,089,988 |
| 2019 | $33,199,592,159,989 | $23,283,943,852,157 | $21,920,161,282,414 | $5,356,585,909,983 | $2,808,202,657,973 | $1,646,310,979,044 |
| 2018 | $32,495,002,404,193 | $22,382,066,736,238 | $22,196,489,669,796 | $5,468,615,138,369 | $2,514,848,529,373 | $1,679,285,300,578 |
| 2017 | $30,201,745,813,616 | $21,261,585,196,515 | $20,579,459,850,718 | $5,600,435,293,960 | $2,350,295,574,730 | $1,570,029,459,646 |
| 2016 | $28,180,144,075,444 | $20,333,111,050,641 | $19,327,214,963,373 | $5,033,313,064,805 | $2,262,166,589,184 | $1,430,459,500,711 |
| 2015 | $26,978,797,674,067 | $19,851,713,080,200 | $19,345,159,610,565 | $5,175,150,028,684 | $2,410,968,746,588 | $1,565,380,618,699 |
| 2014 | $27,311,874,111,537 | $19,414,075,688,809 | $22,520,556,611,130 | $6,104,890,316,523 | $2,675,988,465,728 | $1,708,216,458,942 |
| 2013 | $26,277,421,074,010 | $18,727,453,231,414 | $22,153,028,536,136 | $6,139,262,587,154 | $2,584,556,845,180 | $1,804,092,013,835 |
| 2012 | $25,934,219,918,800 | $18,082,510,177,072 | $21,259,169,627,106 | $6,089,399,342,566 | $2,471,024,434,894 | $1,758,243,300,396 |
| 2011 | $24,411,127,289,357 | $17,393,240,027,901 | $22,206,376,208,921 | $6,028,299,934,068 | $2,312,807,624,532 | $1,596,650,952,579 |
| 2010 | $21,086,081,182,434 | $16,666,481,292,091 | $20,035,028,572,038 | $5,289,138,979,685 | $2,089,893,536,354 | $1,319,890,896,761 |
| 2009 | $17,948,731,496,732 | $15,852,845,966,600 | $19,753,454,485,586 | $4,251,403,961,482 | $1,787,820,305,917 | $1,070,650,291,303 |
| 2008 | $17,631,038,907,994 | $16,323,002,039,550 | $22,405,644,649,869 | $4,540,061,949,525 | $1,878,565,226,000 | $1,209,847,859,067 |
| 2007 | $15,327,215,942,885 | $15,943,198,907,783 | $20,411,913,666,895 | $3,898,901,426,895 | $1,614,610,339,055 | $1,009,184,923,262 |
| 2006 | $13,415,049,244,497 | $15,135,017,455,289 | $17,511,123,949,194 | $3,300,588,482,383 | $1,393,984,365,430 | $874,883,583,055 |
| 2005 | $12,393,923,603,961 | $14,212,453,501,403 | $16,200,658,382,489 | $2,810,853,230,607 | $1,188,105,835,616 | $821,416,919,623 |
| 2004 | $11,372,400,020,765 | $13,244,019,906,918 | $15,301,521,824,709 | $2,318,220,946,262 | $1,011,378,274,914 | $727,978,754,682 |
| 2003 | $10,084,646,117,895 | $12,352,123,202,585 | $13,169,765,630,794 | $2,011,164,238,151 | $840,360,711,053 | $564,167,688,699 |
| 2002 | $9,108,058,103,935 | $11,689,890,568,552 | $10,847,882,510,373 | $1,975,452,560,875 | $697,070,721,652 | $469,246,307,973 |
| 2001 | $8,921,437,701,936 | $11,321,033,198,455 | $9,922,362,370,469 | $2,206,825,936,932 | $677,675,839,934 | $440,341,947,375 |
| 2000 | $9,536,887,939,992 | $10,995,840,254,432 | $9,748,502,887,543 | $2,258,368,609,928 | $696,601,691,550 | $476,146,832,224 |
| 1999 | $8,741,384,504,787 | $10,309,699,567,621 | $10,374,467,580,084 | $2,043,841,918,968 | $659,877,913,557 | $455,997,854,618 |
| 1998 | $7,840,517,093,090 | $9,696,928,396,018 | $10,462,136,311,191 | $2,270,742,892,345 | $804,245,309,773 | $463,479,595,378 |
| 1997 | $8,643,152,606,604 | $9,232,649,606,786 | $10,282,288,181,526 | $2,248,371,342,751 | $791,369,854,223 | $510,998,807,202 |
| 1996 | $8,988,501,180,004 | $8,703,840,852,133 | $10,862,882,788,266 | $2,049,333,531,459 | $751,926,518,520 | $480,901,074,272 |
| 1995 | $9,219,683,767,614 | $8,245,830,320,061 | $10,653,062,493,010 | $1,893,958,164,056 | $675,444,957,163 | $440,644,209,758 |
| 1994 | $8,078,520,582,540 | $7,867,288,417,807 | $9,224,366,265,403 | $1,750,843,432,846 | $563,469,849,712 | $387,191,043,732 |
| 1993 | $7,285,012,573,520 | $7,437,712,022,739 | $8,753,418,520,887 | $1,496,052,691,363 | $554,384,958,942 | $366,937,348,040 |
| 1992 | $6,609,678,607,568 | $7,114,805,421,319 | $9,554,966,608,208 | $1,261,265,784,038 | $549,999,562,254 | $374,518,611,963 |
| 1991 | $6,071,722,062,578 | $6,770,739,219,316 | $8,899,945,259,166 | $1,154,207,228,946 | $577,712,169,457 | $375,230,152,984 |
| 1990 | $5,666,407,873,034 | $6,559,298,067,361 | $8,631,185,366,532 | $1,068,475,374,422 | $566,714,119,715 | $362,714,981,332 |
| 1989 | $5,237,438,005,018 | $6,208,864,791,243 | - | $964,147,002,521 | $492,428,165,949 | $349,655,430,607 |
| 1988 | $5,078,000,867,289 | $5,745,888,715,627 | - | $872,271,317,410 | $483,434,603,537 | $287,145,167,682 |
| 1987 | $4,332,629,364,720 | $5,288,412,221,311 | - | $795,330,339,545 | $478,267,697,925 | $235,053,698,094 |
| 1986 | - | $4,958,693,825,992 | - | $741,491,511,549 | $438,195,591,572 | $217,821,861,329 |
| 1985 | - | $4,705,208,891,450 | - | $733,509,912,109 | $449,587,458,596 | $209,680,993,516 |
| 1984 | - | $4,394,376,544,124 | - | $742,992,198,173 | $450,851,958,808 | $219,777,126,606 |
| 1983 | - | $3,975,946,026,183 | - | $707,012,466,861 | $483,173,353,856 | $206,113,026,587 |
| 1982 | - | $3,658,471,725,409 | - | $803,791,353,882 | $515,614,632,815 | $222,666,915,243 |
| 1981 | - | $3,514,318,662,756 | - | $875,723,013,889 | $540,060,147,632 | $205,915,836,110 |
| 1980 | - | $3,132,110,276,681 | - | $766,277,230,577 | $443,879,775,949 | $177,790,615,508 |
| 1979 | - | $2,871,249,669,642 | - | $629,395,261,936 | $351,983,835,816 | $159,685,840,300 |
| 1978 | - | $2,570,990,751,756 | - | $561,139,586,988 | $293,235,378,757 | $140,428,440,818 |
| 1977 | - | $2,294,171,386,374 | - | $468,307,535,273 | $262,866,278,470 | $128,700,849,150 |
| 1976 | - | $2,080,701,766,223 | - | $426,400,956,781 | $236,786,090,236 | $121,355,501,730 |
| 1975 | - | $1,859,340,448,478 | - | $388,795,225,147 | $215,216,624,232 | $112,663,825,446 |
| 1974 | - | $1,706,207,405,671 | - | $370,989,601,126 | $195,294,221,919 | $105,387,893,816 |
| 1973 | - | $1,557,151,950,932 | - | $285,473,354,632 | $154,789,710,599 | $78,683,393,305 |
| 1972 | - | $1,392,583,822,526 | - | $213,737,808,030 | $125,684,645,924 | $63,039,165,690 |
| 1971 | - | $1,264,465,571,554 | - | $190,032,237,501 | $111,845,308,647 | $54,331,049,491 |
| 1970 | - | $1,161,503,666,118 | - | $170,448,988,066 | $107,809,283,210 | $48,904,078,877 |
| 1969 | - | - | - | $155,178,612,432 | $97,879,904,421 | - |
| 1968 | - | - | - | $137,728,405,833 | $88,917,287,602 | - |
| 1967 | - | - | - | $126,920,836,263 | $82,999,462,976 | - |
| 1966 | - | - | - | $124,161,475,249 | $81,257,279,931 | - |
| 1965 | - | - | - | $112,783,439,357 | - | - |
| 1964 | - | - | - | $104,574,963,569 | - | - |
| 1963 | - | - | - | $93,856,997,175 | - | - |
| 1962 | - | - | - | $86,363,367,196 | - | - |
| 1961 | - | - | - | $82,293,690,972 | - | - |
| 1960 | - | - | - | $74,332,458,257 | - | - |
Data sources: World Bank | Economy & Growth (1960–2025, retrieved 2026-07-08); National Statistics, Taiwan (1987–2025, retrieved 2026-07-08).
GeoRank.org/economy | CC BY
In 2025, the largest economic regions by aggregated GDP were Asia at $42T (+340% since 2000), North America at $$33.1T (+200.9%), Europe at $30T (+207.4%), Latin America at $7.19T (+218.5%), Africa at $3.16T (+354%), and Oceania at $2.11T (+343%).
GDP per capita world map
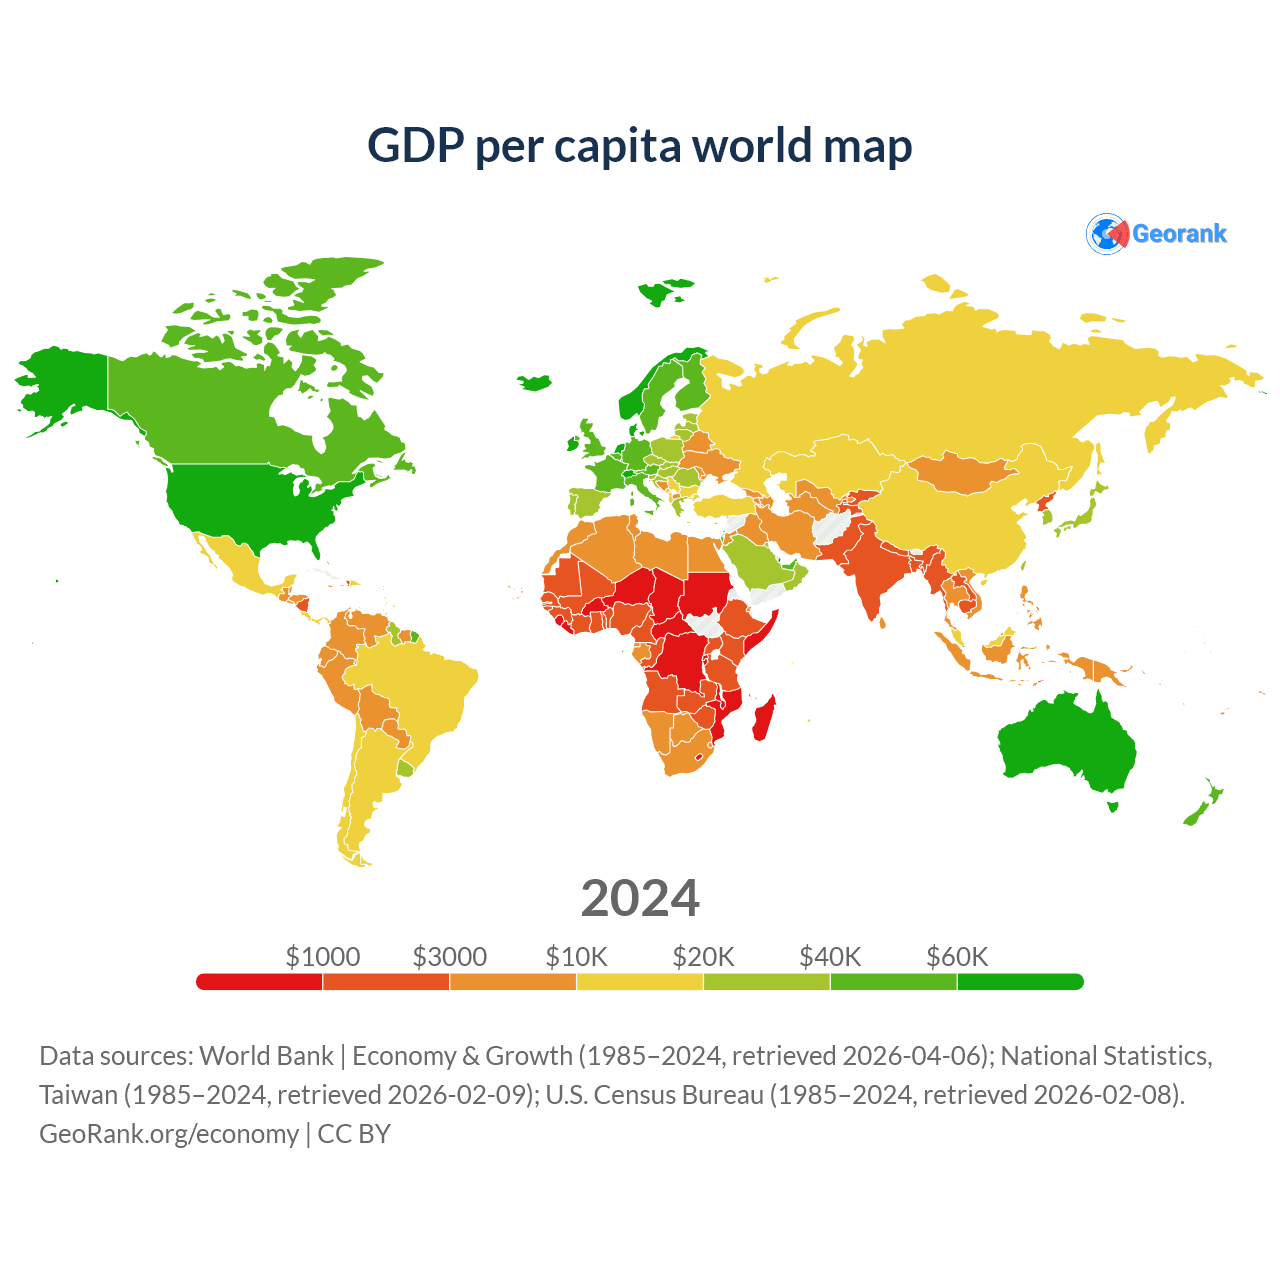
Data sources: World Bank | Economy & Growth (1985–2025, retrieved 2026-07-08); National Statistics, Taiwan (1985–2024, retrieved 2026-07-08); U.S. Census Bureau (1985–2025, retrieved 2026-07-08).
GeoRank.org/economy | CC BY
This interactive world map shows GDP per capita by country and by year, color-coded by economic output per person.
Global GDP per capita (PPP) map
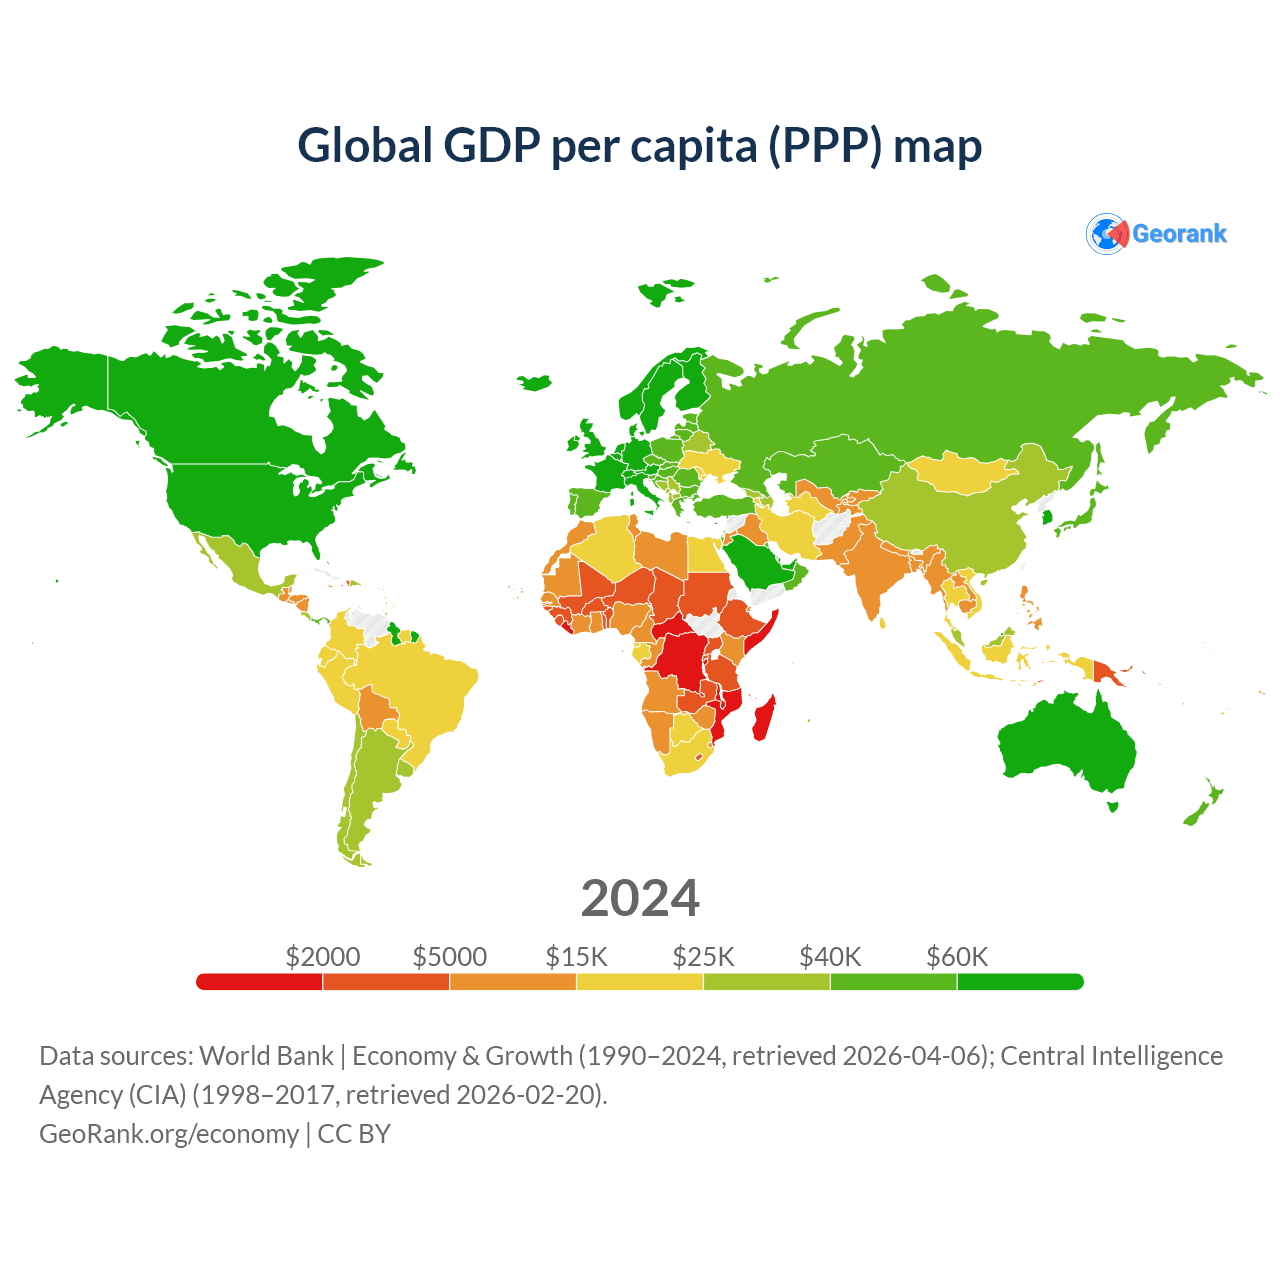
Data sources: World Bank | Economy & Growth (1990–2024, retrieved 2026-07-08); Central Intelligence Agency (CIA) (1998–2017, retrieved 2026-07-08).
GeoRank.org/economy | CC BY
This interactive world map shows GDP per capita adjusted for purchasing power parity (PPP) by country and by year. Unlike nominal GDP per capita, PPP accounts for differences in the cost of living between countries, providing a more accurate comparison of living standards.
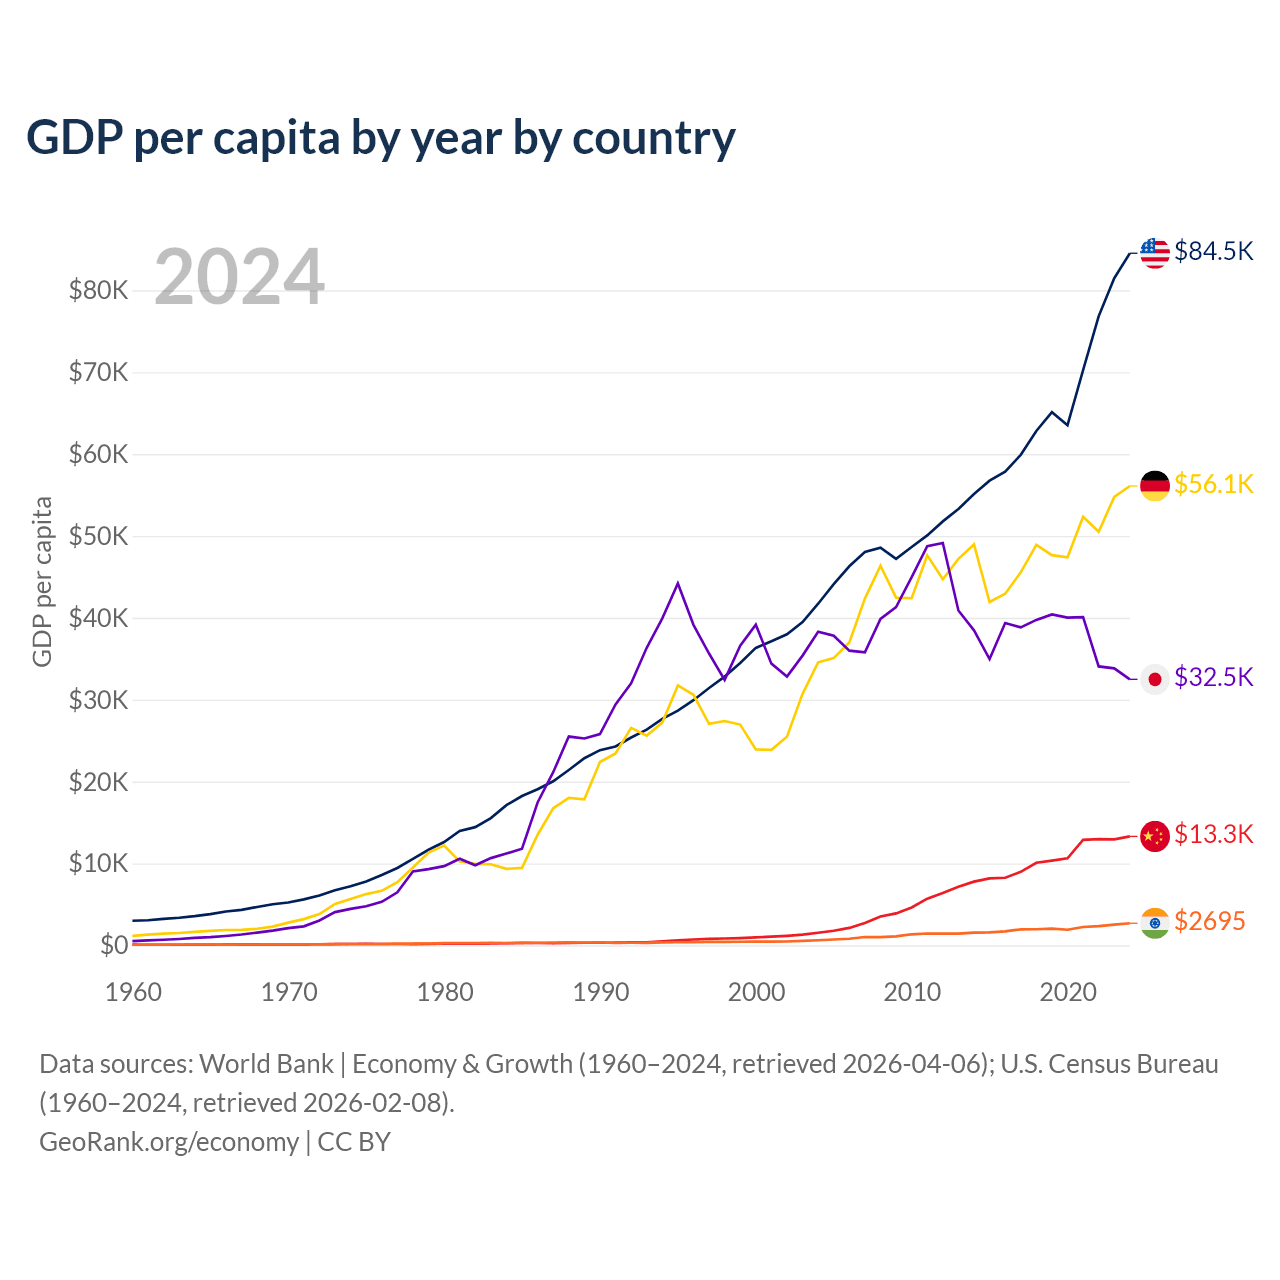
GDP per capita by year by country
| Year | GDP per capita | ||||
|---|---|---|---|---|---|
| United States | China | Germany | Japan | United Kingdom | |
| 2025 | $90,027 | $13,862 | $60,496 | $35,951 | $57,602 |
| 2024 | $86,143 | $13,293 | $56,104 | $33,797 | $53,341 |
| 2023 | $83,041 | $12,951 | $54,777 | $35,215 | $49,920 |
| 2022 | $78,178 | $12,971 | $50,507 | $35,548 | $47,035 |
| 2021 | $71,486 | $12,887 | $52,349 | $41,581 | $47,696 |
| 2020 | $64,475 | $10,627 | $47,395 | $41,099 | $40,815 |
| 2019 | $65,605 | $10,343 | $47,656 | $41,425 | $43,161 |
| 2018 | $63,201 | $10,086 | $48,916 | $40,645 | $43,704 |
| 2017 | $60,322 | $8,980 | $45,554 | $39,680 | $40,918 |
| 2016 | $58,207 | $8,255 | $42,949 | $40,215 | $41,259 |
| 2015 | $57,040 | $8,175 | $41,930 | $35,665 | $45,256 |
| 2014 | $55,304 | $7,781 | $48,960 | $39,173 | $47,747 |
| 2013 | $53,410 | $7,147 | $47,207 | $41,369 | $43,608 |
| 2012 | $51,784 | $6,405 | $44,718 | $49,627 | $42,688 |
| 2011 | $50,066 | $5,704 | $47,631 | $49,122 | $42,296 |
| 2010 | $48,651 | $4,629 | $42,397 | $45,378 | $39,778 |
| 2009 | $47,195 | $3,898 | $42,472 | $41,678 | $39,009 |
| 2008 | $48,570 | $3,523 | $46,379 | $40,294 | $47,652 |
| 2007 | $48,050 | $2,735 | $42,351 | $36,130 | $50,629 |
| 2006 | $46,302 | $2,129 | $36,980 | $36,354 | $44,695 |
| 2005 | $44,123 | $1,778 | $35,084 | $38,159 | $42,240 |
| 2004 | $41,725 | $1,531 | $34,567 | $38,678 | $40,504 |
| 2003 | $39,490 | $1,307 | $30,711 | $35,809 | $34,557 |
| 2002 | $37,998 | $1,164 | $25,487 | $33,316 | $30,159 |
| 2001 | $37,134 | $1,065 | $23,878 | $34,910 | $28,014 |
| 2000 | $36,330 | $969 | $23,926 | $39,753 | $28,384 |
| 1999 | $34,484 | $881 | $26,965 | $37,029 | $28,858 |
| 1998 | $32,823 | $835 | $27,396 | $32,835 | $28,396 |
| 1997 | $31,430 | $787 | $27,047 | $36,331 | $26,910 |
| 1996 | $29,937 | $713 | $30,600 | $39,930 | $24,503 |
| 1995 | $28,661 | $613 | $31,747 | $44,947 | $23,253 |
| 1994 | $27,662 | $476 | $27,202 | $40,774 | $19,709 |
| 1993 | $26,353 | $379 | $25,617 | $37,111 | $18,389 |
| 1992 | $25,381 | $368 | $26,560 | $32,667 | $20,487 |
| 1991 | $24,293 | $334 | $23,443 | $30,048 | $19,901 |
| 1990 | $23,840 | $319 | $22,386 | $26,345 | $19,095 |
| 1989 | $22,857 | $311 | $17,829 | $25,798 | $16,239 |
| 1988 | $21,417 | $284 | $17,997 | $26,037 | $15,987 |
| 1987 | $20,039 | $252.3 | $16,739 | $21,587 | $13,119 |
| 1986 | $19,071 | $282.4 | $13,511 | $17,819 | $10,611 |
| 1985 | $18,237 | $295 | $9,464 | $12,058 | $8,652 |
| 1984 | $17,121 | $251.2 | $9,347 | $11,443 | $8,179 |
| 1983 | $15,544 | $225.9 | $9,900 | $10,876 | $8,692 |
| 1982 | $14,434 | $203.7 | $9,950 | $9,986 | $9,146 |
| 1981 | $13,976 | $197.4 | $10,246 | $10,806 | $9,599 |
| 1980 | $12,613 | $195.1 | $12,183 | $9,872 | $10,032 |
| 1979 | $11,674 | $184.3 | $11,322 | $9,497 | $7,805 |
| 1978 | $10,565 | $156.7 | $9,517 | $9,202 | $5,977 |
| 1977 | $9,453 | $185.7 | $7,711 | $6,609 | $4,681 |
| 1976 | $8,592 | $165.7 | $6,659 | $5,422 | $4,138 |
| 1975 | $7,801 | $178.6 | $6,259 | $4,876 | $4,300 |
| 1974 | $7,226 | $160.4 | $5,660 | $4,542 | $3,666 |
| 1973 | $6,726 | $157.3 | $5,065 | $4,147 | $3,426 |
| 1972 | $6,094 | $132.1 | $3,824 | $3,095 | $3,030 |
| 1971 | $5,609 | $118.8 | $3,204 | $2,370 | $2,650 |
| 1970 | $5,234 | $113.3 | $2,771 | $2,145 | $2,348 |
| 1969 | $5,020 | $100.3 | $2,281 | $1,841 | $2,101 |
| 1968 | $4,685 | $91.6 | $2,025 | $1,586 | $1,952 |
| 1967 | $4,326 | $96.8 | $1,886 | $1,354 | $2,059 |
| 1966 | $4,136 | $104.5 | $1,871 | $1,168 | $1,987 |
| 1965 | $3,818 | $98.7 | $1,774 | $1,015 | $1,874 |
| 1964 | $3,565 | $85.7 | $1,637 | $922 | $1,748 |
| 1963 | $3,366 | $74.5 | $1,502 | $792 | $1,613 |
| 1962 | $3,236 | $71.1 | $1,431 | $699 | $1,526 |
| 1961 | $3,059 | $76 | $1,316 | $622 | $1,472 |
| 1960 | $3,000 | $89.7 | $1,162 | $519 | $1,398 |
Data sources: World Bank | Economy & Growth (1960–2025, retrieved 2026-07-08); U.S. Census Bureau (1960–2025, retrieved 2026-07-08).
GeoRank.org/economy | CC BY
This chart shows GDP per capita by year for the top 5 largest economies: the United States ($90,027), China ($13,862), Germany ($60,496), Japan ($35,951), and the United Kingdom ($57,602). Unlike total GDP, the per capita version highlights productivity changes, separating them from population growth.
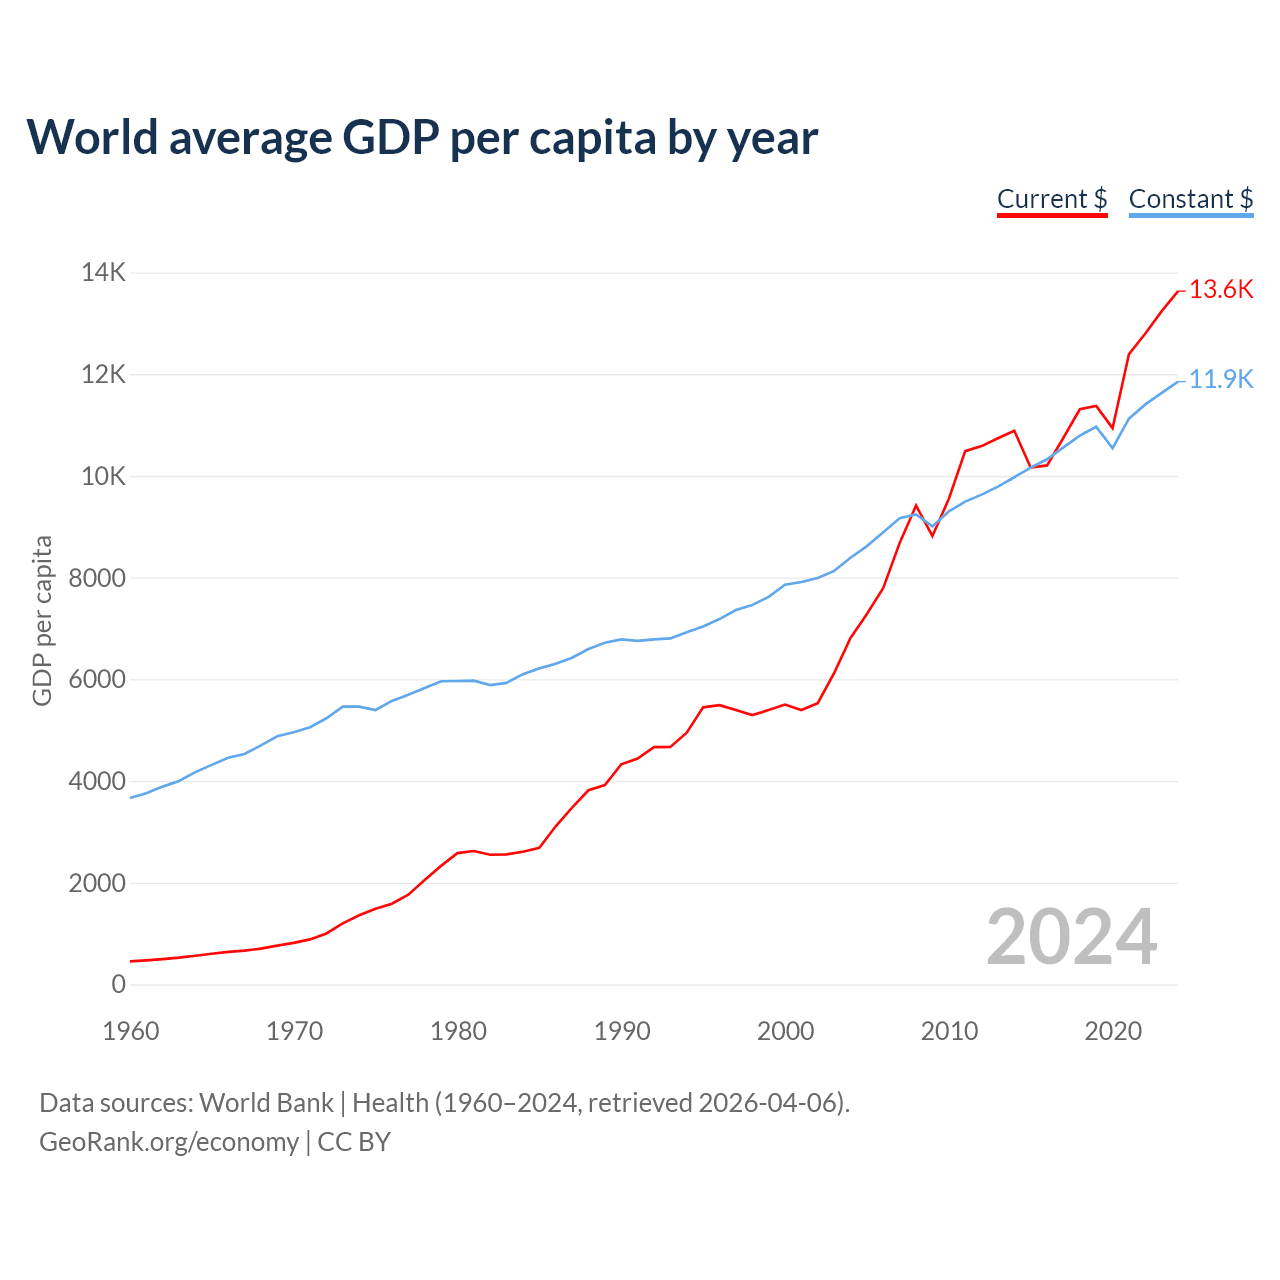
World average GDP per capita by year
| Year | GDP per capita | |
|---|---|---|
| Current $ | Constant $ | |
| 2025 | 14,406 | 12,131 |
| 2024 | 13,717 | 11,894 |
| 2023 | 13,314 | 11,671 |
| 2022 | 12,876 | 11,452 |
| 2021 | 12,473 | 11,168 |
| 2020 | 10,999 | 10,575 |
| 2019 | 11,418 | 10,997 |
| 2018 | 11,345 | 10,823 |
| 2017 | 10,784 | 10,592 |
| 2016 | 10,239 | 10,355 |
| 2015 | 10,192 | 10,192 |
| 2014 | 10,912 | 10,001 |
| 2013 | 10,759 | 9,811 |
| 2012 | 10,598 | 9,654 |
| 2011 | 10,497 | 9,515 |
| 2010 | 9,555 | 9,322 |
| 2009 | 8,827 | 9,028 |
| 2008 | 9,426 | 9,266 |
| 2007 | 8,685 | 9,191 |
| 2006 | 7,803 | 8,913 |
| 2005 | 7,291 | 8,639 |
| 2004 | 6,818 | 8,409 |
| 2003 | 6,130 | 8,151 |
| 2002 | 5,539 | 8,011 |
| 2001 | 5,404 | 7,932 |
| 2000 | 5,513 | 7,880 |
| 1999 | 5,401 | 7,639 |
| 1998 | 5,302 | 7,479 |
| 1997 | 5,409 | 7,382 |
| 1996 | 5,507 | 7,203 |
| 1995 | 5,463 | 7,058 |
| 1994 | 4,967 | 6,944 |
| 1993 | 4,685 | 6,819 |
| 1992 | 4,680 | 6,801 |
| 1991 | 4,454 | 6,773 |
| 1990 | 4,339 | 6,804 |
| 1989 | 3,931 | 6,741 |
| 1988 | 3,830 | 6,620 |
| 1987 | 3,488 | 6,446 |
| 1986 | 3,119 | 6,326 |
| 1985 | 2,691 | 6,233 |
| 1984 | 2,614 | 6,120 |
| 1983 | 2,561 | 5,947 |
| 1982 | 2,554 | 5,903 |
| 1981 | 2,629 | 5,986 |
| 1980 | 2,587 | 5,980 |
| 1979 | 2,335 | 5,978 |
| 1978 | 2,055 | 5,843 |
| 1977 | 1,766 | 5,710 |
| 1976 | 1,590 | 5,591 |
| 1975 | 1,489 | 5,410 |
| 1974 | 1,362 | 5,467 |
| 1973 | 1,202 | 5,465 |
| 1972 | 1,002 | 5,236 |
| 1971 | 885 | 5,061 |
| 1970 | 818 | 4,964 |
| 1969 | 761 | 4,885 |
| 1968 | 703 | 4,707 |
| 1967 | 664 | 4,535 |
| 1966 | 639 | 4,461 |
| 1965 | 602 | 4,321 |
| 1964 | 564 | 4,176 |
| 1963 | 525 | 3,999 |
| 1962 | 496 | 3,889 |
| 1961 | 472 | 3,759 |
| 1960 | 453 | 3,667 |
Data sources: World Bank | Health (1960–2025, retrieved 2026-07-08).
GeoRank.org/economy | CC BY
This chart shows global GDP per capita over time in both nominal and inflation-adjusted (constant) USD to account for price level changes and reveal real productivity growth.
Global GDP per capita has increased sixfold since the 1970s, but much of that rise is due to inflation. When adjusted for inflation, GDP per capita has only doubled over the past 50 years. This modest real growth is partly due to slower population growth and declining birth rates in developed countries. While these economies have significantly outperformed the rest of the world, they account for only a small share of the global population.
Global debt-to-GDP ratio map
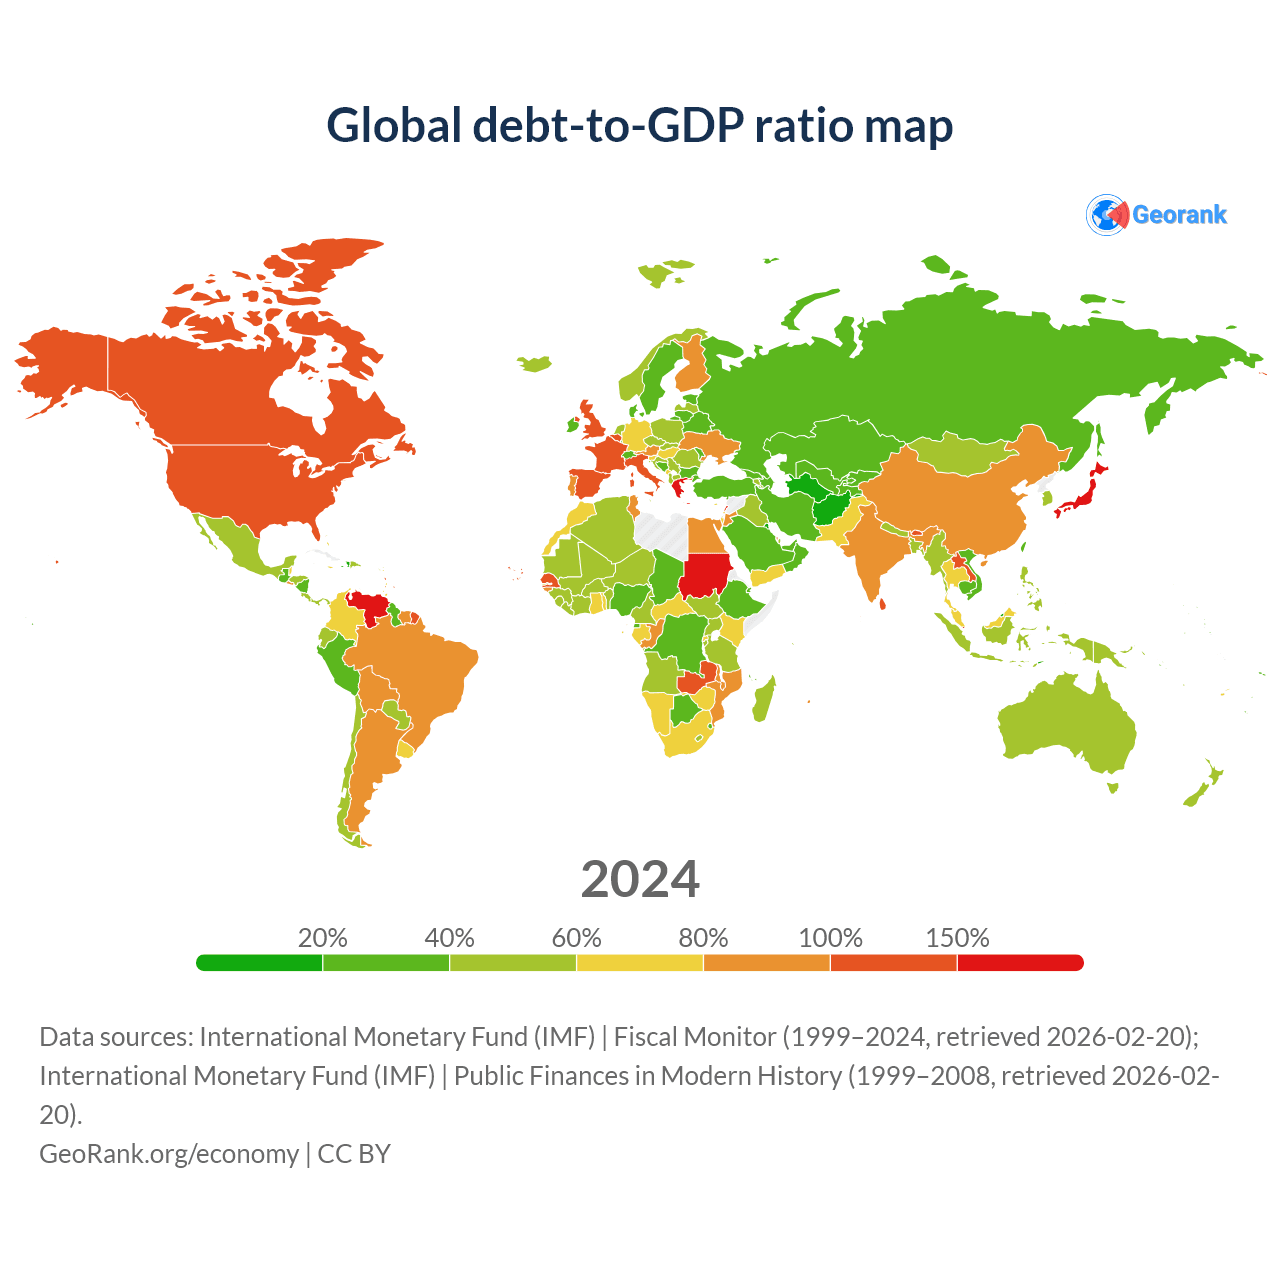
Data sources: International Monetary Fund (IMF) | Fiscal Monitor (1999–2025, retrieved 2026-07-08); International Monetary Fund (IMF) | Public Finances in Modern History (1999–2024, retrieved 2026-07-08).
GeoRank.org/economy | CC BY
This map color-codes the debt-to-GDP ratio by year for countries around the world to show national debt compares to economic output across different economies.
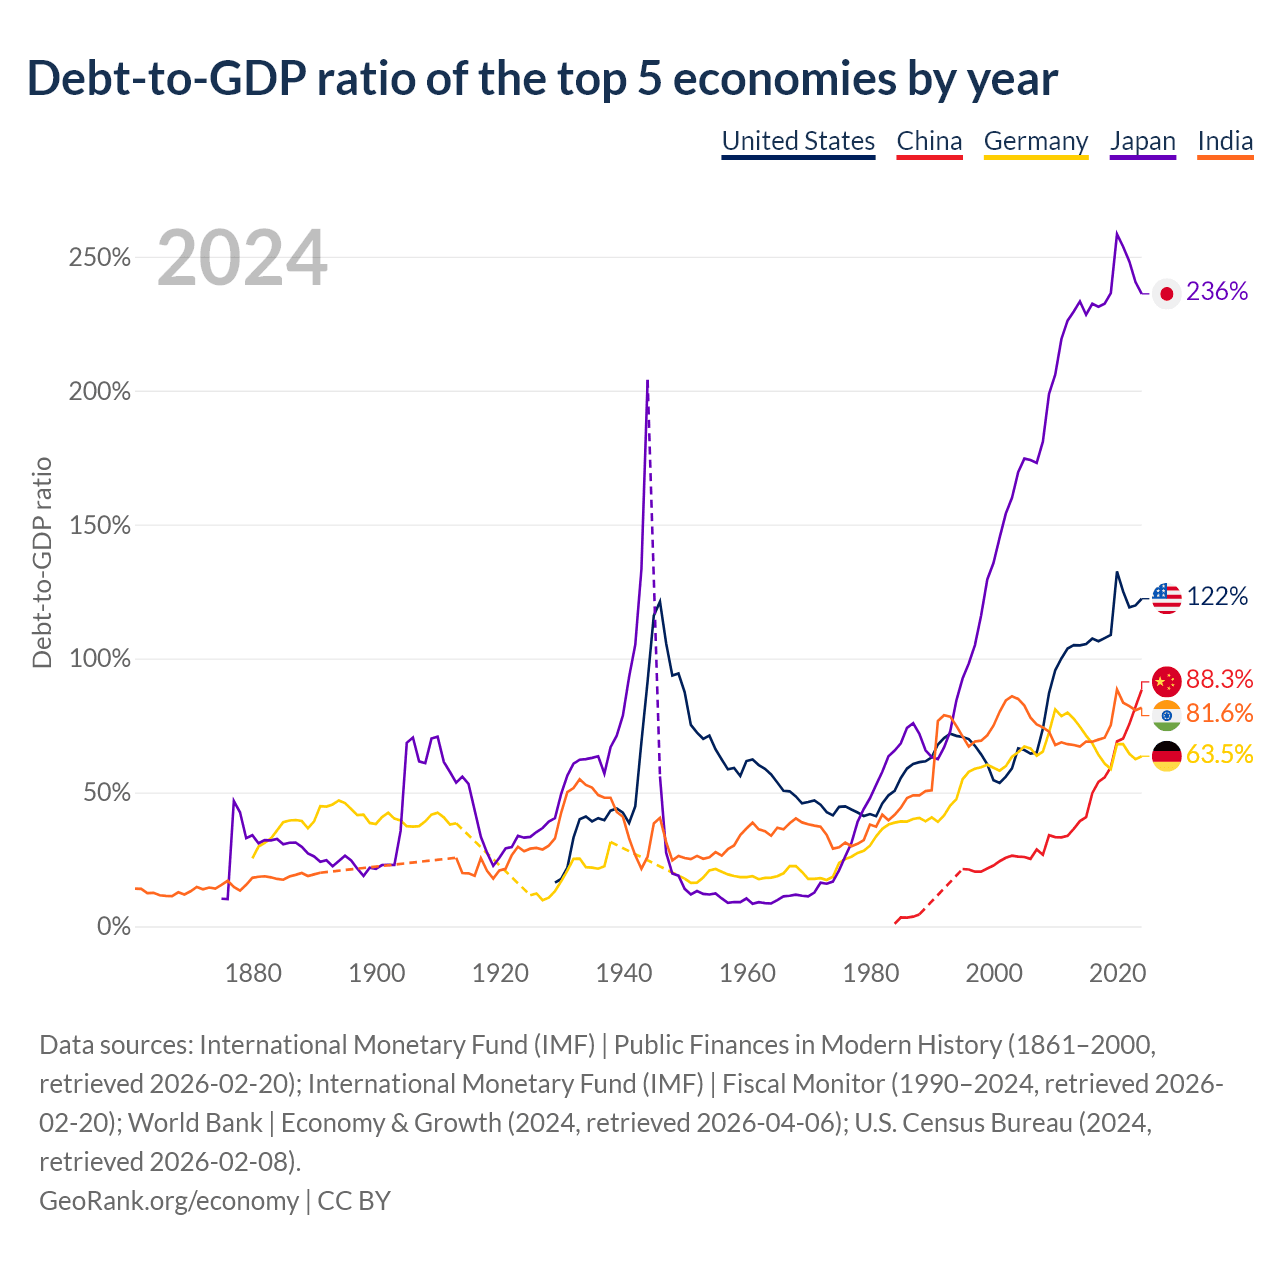
Debt-to-GDP ratio of the top 5 economies by year
| Year | Debt-to-GDP ratio | ||||
|---|---|---|---|---|---|
| United States | China | Germany | Japan | United Kingdom | |
| 2025 | 123.9% | 99.2% | 62.9% | 206.5% | 102.3% |
| 2024 | 122.3% | 90.4% | 62.2% | 214.5% | 99.9% |
| 2023 | 120% | 84.1% | 62.3% | 220.3% | 98.9% |
| 2022 | 119.1% | 77.3% | 64.4% | 227.8% | 97.5% |
| 2021 | 125% | 72.1% | 67.9% | 222.7% | 103.4% |
| 2020 | 132.6% | 70.1% | 68% | 228.8% | 104.8% |
| 2019 | 108.8% | 59.8% | 58.7% | 206.3% | 84.9% |
| 2018 | 107.7% | 55.9% | 60.8% | 203.7% | 85.6% |
| 2017 | 106.4% | 53.9% | 64% | 203.1% | 86.1% |
| 2016 | 107.4% | 50% | 68.3% | 202.1% | 87.3% |
| 2015 | 105.4% | 40.8% | 71.2% | 200.1% | 87.3% |
| 2014 | 104.9% | 39.3% | 74.5% | 203.6% | 86.5% |
| 2013 | 105% | 36.4% | 77.5% | 201.2% | 84.9% |
| 2012 | 103.7% | 33.8% | 79.8% | 197.1% | 84.1% |
| 2011 | 100% | 33.2% | 78.5% | 190.6% | 81.1% |
| 2010 | 95.7% | 33.3% | 81% | 178.6% | 75.5% |
| 2009 | 87.1% | 34% | 72.4% | 172.9% | 64.5% |
| 2008 | 73.8% | 26.7% | 65.2% | 153.6% | 50.6% |
| 2007 | 64.9% | 28.7% | 63.7% | 150.4% | 43% |
| 2006 | 64.5% | 25.2% | 66.4% | 152.1% | 41.9% |
| 2005 | 65.8% | 25.9% | 67.1% | 153.4% | 40.9% |
| 2004 | 66.4% | 26% | 65% | 148.8% | 39.7% |
| 2003 | 59% | 26.4% | 63.3% | 140.2% | 36.6% |
| 2002 | 55.9% | 25.6% | 59.8% | 134.6% | 35.3% |
| 2001 | 53.5% | 24.3% | 58.1% | 126.8% | 34.8% |
| 2000 | 54.5% | 22.7% | 59.2% | 118.5% | 37.5% |
| 1999 | 60.5% | 21.6% | 60.3% | 113.5% | 40.3% |
| 1998 | 64.2% | 20.4% | 59.4% | 101.6% | 41.8% |
| 1997 | 67.4% | 20.4% | 58.8% | 91.3% | 43.9% |
| 1996 | 69.9% | 21.2% | 57.7% | 85.3% | 43.5% |
| 1995 | 70.7% | 21.4% | 54.9% | 80.7% | 43.5% |
| 1994 | 71.1% | - | 47.5% | 73.3% | 40.6% |
| 1993 | 71.9% | - | 45.1% | 63.2% | 37.8% |
| 1992 | 70.3% | - | 41.4% | 57.9% | 33.1% |
| 1991 | 67.9% | - | 39% | 54.1% | 28.4% |
| 1990 | 63.1% | - | 40.7% | 54.8% | 28.4% |
| 1989 | 61.6% | - | 39.2% | 65.7% | 31.4% |
| 1988 | 61.3% | 4.46% | 40.5% | 71.9% | 36.6% |
| 1987 | 60.6% | 3.6% | 40.1% | 75.8% | 41.8% |
| 1986 | 58.9% | 3.24% | 39.1% | 74.1% | 42.9% |
| 1985 | 55.4% | 3.31% | 39.2% | 68.3% | 42.9% |
| 1984 | 50.6% | 0.97% | 38.7% | 65.6% | 44.1% |
| 1983 | 48.9% | - | 38% | 63.5% | 44.2% |
| 1982 | 45.9% | - | 36.4% | 57.7% | 44.7% |
| 1981 | 41.1% | - | 33.6% | 52.8% | 41.1% |
| 1980 | 41.9% | - | 30.1% | 47.8% | 43.7% |
| 1979 | 41.2% | - | 28.2% | 43.8% | 44.5% |
| 1978 | 42.5% | - | 27.4% | 39% | 47.3% |
| 1977 | 43.6% | - | 26% | 31.1% | 53.7% |
| 1976 | 44.8% | - | 25.1% | 26.1% | 47.7% |
| 1975 | 44.6% | - | 23.7% | 20.9% | 49.6% |
| 1974 | 41.4% | - | 18.5% | 16.7% | 56.2% |
| 1973 | 42.6% | - | 17.3% | 15.9% | 58.5% |
| 1972 | 45.4% | - | 18% | 16.3% | 65% |
| 1971 | 47% | - | 17.7% | 12.6% | 67.9% |
| 1970 | 46.4% | - | 17.7% | 11.2% | 73.4% |
| 1969 | 45.9% | - | 20.3% | 11.4% | 82.8% |
| 1968 | 48.5% | - | 22.5% | 11.8% | 88.5% |
| 1967 | 50.4% | - | 22.5% | 11.4% | 89.1% |
| 1966 | 50.6% | - | 19.8% | 11.2% | 91.9% |
| 1965 | 53.7% | - | 18.7% | 9.78% | 94.6% |
| 1964 | 56.7% | - | 18.2% | 8.53% | 101.1% |
| 1963 | 58.8% | - | 18.1% | 8.66% | 108.6% |
| 1962 | 60.2% | - | 17.6% | 9.01% | 110.5% |
| 1961 | 62.3% | - | 18.7% | 8.44% | 113.8% |
| 1960 | 61.7% | - | 18.4% | 10.4% | 117.9% |
| 1959 | 56.1% | - | 18.4% | 9.02% | 124.9% |
| 1958 | 59.1% | - | 18.8% | 9.08% | 131.1% |
| 1957 | 58.6% | - | 19.4% | 8.77% | 135.7% |
| 1956 | 62.3% | - | 20.4% | 10.4% | 143.8% |
| 1955 | 66.1% | - | 21.4% | 12.3% | 154.2% |
| 1954 | 71.2% | - | 20.9% | 11.9% | 163.2% |
| 1953 | 70% | - | 18.2% | 12.1% | 169.8% |
| 1952 | 72.3% | - | 16.3% | 13.2% | 180.9% |
| 1951 | 75.2% | - | 16.2% | 11.9% | 196.8% |
| 1950 | 87.4% | - | 17.8% | 14% | 216.9% |
| 1949 | 94.4% | - | - | 18.9% | 220.3% |
| 1948 | 93.6% | - | - | 19.7% | 239.6% |
| 1947 | 105.7% | - | - | 27.5% | 264.1% |
| 1946 | 121.2% | - | - | 56% | 269.8% |
| 1945 | 116% | - | - | - | 234.7% |
| 1944 | 91.5% | - | - | 204% | 200.6% |
| 1943 | 68.9% | - | - | 133.4% | 174% |
| 1942 | 44.8% | - | - | 105.1% | 153.2% |
| 1941 | 38.6% | - | - | 93.1% | 133.7% |
| 1940 | 42.4% | - | - | 78.7% | 121.1% |
| 1939 | 44% | - | - | 71.2% | 149.7% |
| 1938 | 43.2% | - | 31.5% | 66.9% | 155.1% |
| 1937 | 39.6% | - | 22.4% | 57% | 158.7% |
| 1936 | 40.4% | - | 21.5% | 63.5% | 170.2% |
| 1935 | 39.2% | - | 21.9% | 62.9% | 178.1% |
| 1934 | 41% | - | 22.1% | 62.4% | 186.6% |
| 1933 | 40% | - | 25.3% | 62.2% | 194% |
| 1932 | 33.1% | - | 25.2% | 60.7% | 190.1% |
| 1931 | 21.9% | - | 20.8% | 56.3% | 184.8% |
| 1930 | 17.7% | - | 16.8% | 49.4% | 171% |
| 1929 | 16.3% | - | 13.1% | 40.4% | 170.5% |
| 1928 | - | - | 10.7% | 39.1% | 175.8% |
| 1927 | - | - | 9.73% | 36.7% | 177.5% |
| 1926 | - | - | 12.3% | 35.2% | 187.1% |
| 1925 | - | - | 11.6% | 33.4% | 177% |
| 1924 | - | - | - | 33.1% | 188.8% |
| 1923 | - | - | - | 33.8% | 195.5% |
| 1922 | - | - | - | 29.6% | 183.5% |
| 1921 | - | - | - | 29.1% | 158.4% |
| 1920 | - | - | - | 25.6% | 137.8% |
| 1919 | - | - | - | 22.6% | 142.8% |
| 1918 | - | - | - | 27.5% | 119.1% |
| 1917 | - | - | - | 33.4% | 97.8% |
| 1916 | - | - | - | 43.3% | 65.6% |
| 1915 | - | - | - | 53.2% | 39.3% |
| 1914 | - | - | - | 55.9% | 27.3% |
| 1913 | - | - | 38.5% | 53.6% | 27.9% |
| 1912 | - | - | 38% | 57.6% | 29.8% |
| 1911 | - | - | 40.7% | 61.4% | 31.6% |
| 1910 | - | - | 42.4% | 70.8% | 34.5% |
| 1909 | - | - | 41.7% | 70.1% | 34.9% |
| 1908 | - | - | 39.2% | 60.9% | 35.7% |
| 1907 | - | - | 37.4% | 61.6% | 35.3% |
| 1906 | - | - | 37.2% | 70.5% | 37.4% |
| 1905 | - | - | 37.4% | 68.5% | 39% |
| 1904 | - | - | 39.5% | 35.6% | 40.7% |
| 1903 | - | - | 40.2% | 22.9% | 41.2% |
| 1902 | - | - | 42.4% | 23% | 39% |
| 1901 | - | - | 40.8% | 22.9% | 35.8% |
| 1900 | - | - | 38.2% | 21.5% | 32.4% |
| 1899 | - | - | 38.6% | 21.9% | 35.1% |
| 1898 | - | - | 41.7% | 18.8% | 37.8% |
| 1897 | - | - | 41.5% | 21.5% | 40.4% |
| 1896 | - | - | 43.8% | 24.6% | 41.1% |
| 1895 | - | - | 46% | 26.4% | 43.1% |
| 1894 | - | - | 47% | 24.4% | 44.1% |
| 1893 | - | - | 45.5% | 22.4% | 47.4% |
| 1892 | - | - | 44.7% | 24.7% | 47.5% |
| 1891 | - | - | 44.9% | 24.1% | 46.4% |
| 1890 | - | - | 39.2% | 26.1% | 45.9% |
| 1889 | - | - | 36.6% | 27.2% | 47.1% |
| 1888 | - | - | 39.3% | 29.7% | 51.3% |
| 1887 | - | - | 39.7% | 31.3% | 55.4% |
| 1886 | - | - | 39.5% | 31.2% | 57.5% |
| 1885 | - | - | 38.9% | 30.6% | 57.8% |
| 1884 | - | - | 35.8% | 32.6% | 56.1% |
| 1883 | - | - | 32.8% | 32.1% | 61.5% |
| 1882 | - | - | 31.2% | 32.2% | 61.5% |
| 1881 | - | - | 29.8% | 31% | 64.4% |
| 1880 | - | - | 25.4% | 34% | 65.4% |
| 1879 | - | - | - | 32.9% | 64.8% |
| 1878 | - | - | - | 42.6% | 61.7% |
| 1877 | - | - | - | 46.8% | 60% |
| 1876 | - | - | - | 10.2% | 59.4% |
| 1875 | - | - | - | 10.3% | 57.8% |
| 1874 | - | - | - | - | 57.4% |
| 1873 | - | - | - | - | 57% |
| 1872 | - | - | - | - | 60.7% |
| 1871 | - | - | - | - | 64.3% |
| 1870 | - | - | - | - | 70.5% |
| 1869 | - | - | - | - | 74.6% |
| 1868 | - | - | - | - | 74.9% |
| 1867 | - | - | - | - | 77.8% |
| 1866 | - | - | - | - | 76.5% |
| 1865 | - | - | - | - | 81% |
| 1864 | - | - | - | - | 83.6% |
| 1863 | - | - | - | - | 89.3% |
| 1862 | - | - | - | - | 93% |
| 1861 | - | - | - | - | 95.6% |
| 1860 | - | - | - | - | 99.8% |
| 1859 | - | - | - | - | 102% |
| 1858 | - | - | - | - | 107.7% |
| 1857 | - | - | - | - | 104% |
| 1856 | - | - | - | - | 105.3% |
| 1855 | - | - | - | - | 105.5% |
| 1854 | - | - | - | - | 107.2% |
| 1853 | - | - | - | - | 115% |
| 1852 | - | - | - | - | 130.1% |
| 1851 | - | - | - | - | 131.4% |
| 1850 | - | - | - | - | 138.1% |
| 1849 | - | - | - | - | 126.4% |
| 1848 | - | - | - | - | 128.7% |
| 1847 | - | - | - | - | 123.8% |
| 1846 | - | - | - | - | 128.7% |
| 1845 | - | - | - | - | 137.4% |
| 1844 | - | - | - | - | 145.5% |
| 1843 | - | - | - | - | 158.6% |
| 1842 | - | - | - | - | 158% |
| 1841 | - | - | - | - | 151.9% |
| 1840 | - | - | - | - | 144.7% |
| 1839 | - | - | - | - | 135.7% |
| 1838 | - | - | - | - | 142.9% |
| 1837 | - | - | - | - | 151.6% |
| 1836 | - | - | - | - | 145.8% |
| 1835 | - | - | - | - | 151.6% |
| 1834 | - | - | - | - | 162.2% |
| 1833 | - | - | - | - | 172.2% |
| 1832 | - | - | - | - | 169.9% |
| 1831 | - | - | - | - | 164.6% |
| 1830 | - | - | - | - | 165.6% |
| 1829 | - | - | - | - | 173.3% |
| 1828 | - | - | - | - | 183.5% |
| 1827 | - | - | - | - | 192% |
| 1826 | - | - | - | - | 200.8% |
| 1825 | - | - | - | - | 212.7% |
| 1824 | - | - | - | - | 225.2% |
| 1823 | - | - | - | - | 238.4% |
| 1822 | - | - | - | - | 246.4% |
| 1821 | - | - | - | - | 260.9% |
| 1820 | - | - | - | - | 259.9% |
| 1819 | - | - | - | - | 259% |
| 1818 | - | - | - | - | 258% |
| 1817 | - | - | - | - | 232.6% |
| 1816 | - | - | - | - | 237.8% |
| 1815 | - | - | - | - | 224.8% |
| 1814 | - | - | - | - | 221% |
| 1813 | - | - | - | - | 196% |
| 1812 | - | - | - | - | 189.3% |
| 1811 | - | - | - | - | 182.6% |
| 1810 | - | - | - | - | 187.5% |
| 1809 | - | - | - | - | 189.3% |
| 1808 | - | - | - | - | 191.1% |
| 1807 | - | - | - | - | 192.8% |
| 1806 | - | - | - | - | 191.1% |
| 1805 | - | - | - | - | 189.2% |
| 1804 | - | - | - | - | 187% |
| 1803 | - | - | - | - | 192% |
| 1802 | - | - | - | - | 189.5% |
| 1801 | - | - | - | - | 179% |
| 1800 | - | - | - | - | 176.3% |
Data sources: International Monetary Fund (IMF) | Public Finances in Modern History (1800–2000, retrieved 2026-07-08); International Monetary Fund (IMF) | Fiscal Monitor (1990–2025, retrieved 2026-07-08); World Bank | Economy & Growth (2025, retrieved 2026-07-08); U.S. Census Bureau (2025, retrieved 2026-07-08).
GeoRank.org/economy | CC BY
This chart shows the national debt-to-GDP ratio by country. Japan holds the highest ratio at 206.5%. The United States has seen its debt-to-GDP ratio rise steadily, especially after the 2008 financial crisis and the COVID-19 pandemic, reaching 123.9% by 2025. China’s debt is also increasing, currently at 99.2% of GDP.
The United States has the highest government debt per person at $111,531, followed by Japan at $74,248 and the United Kingdom at $58,936.
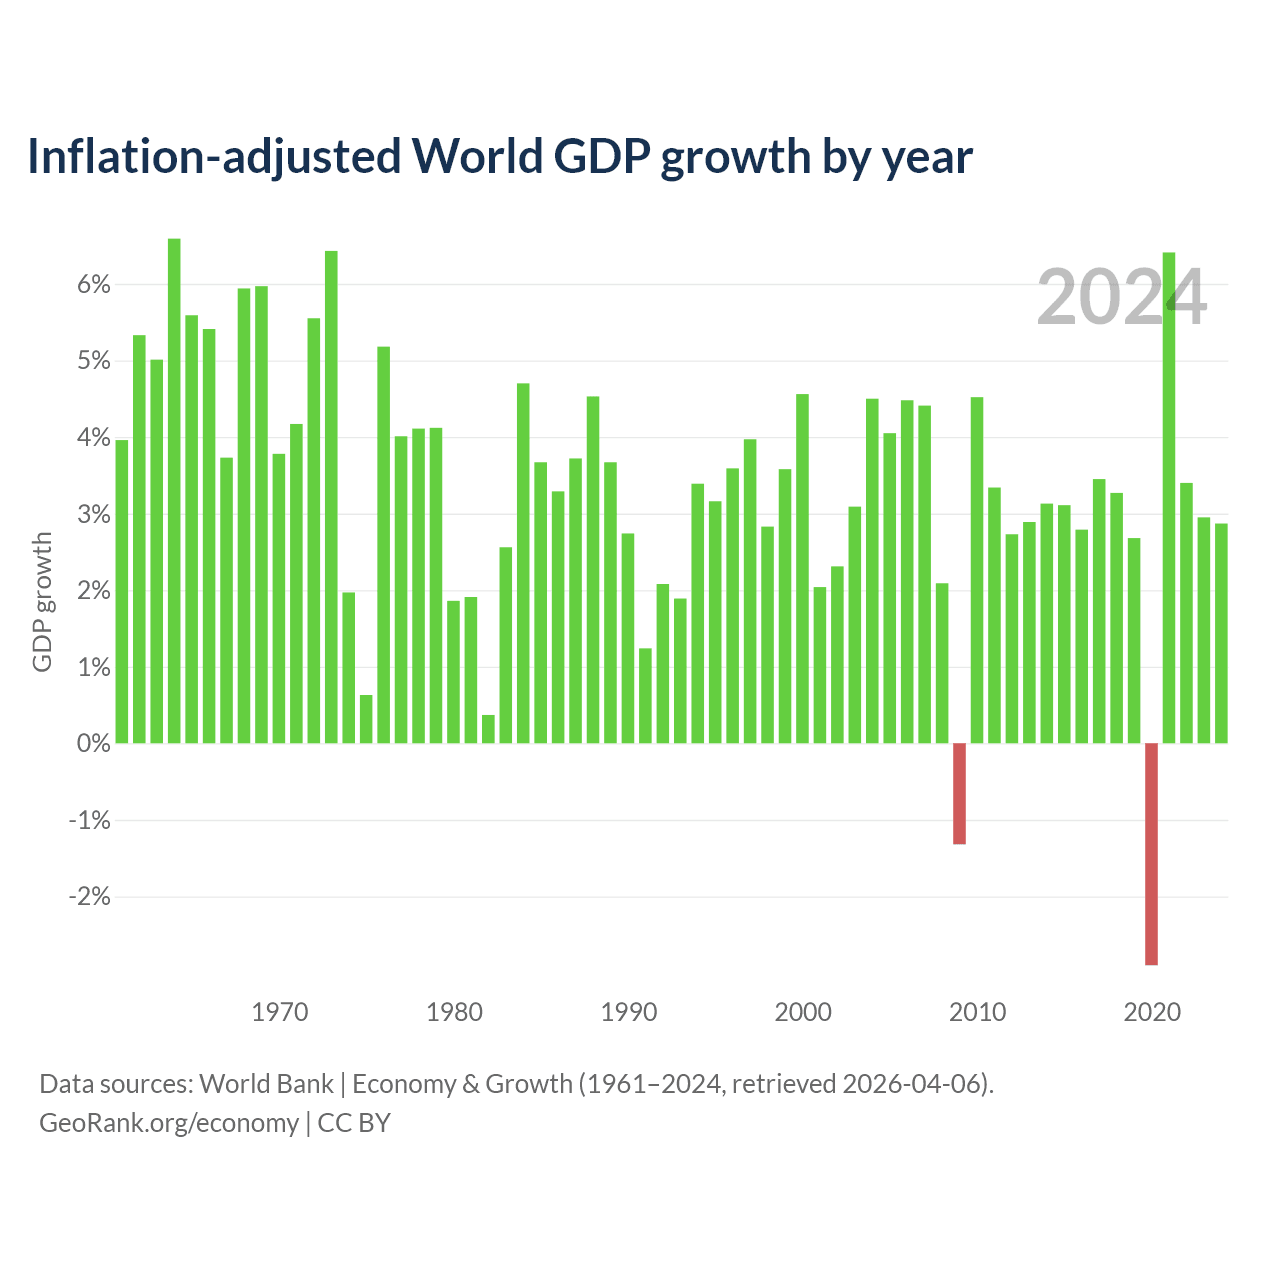
Inflation-adjusted World GDP growth by year
| Year | GDP growth |
|---|---|
| 2025 | 2.92% |
| 2024 | 2.9% |
| 2023 | 2.86% |
| 2022 | 3.44% |
| 2021 | 6.49% |
| 2020 | -2.89% |
| 2019 | 2.68% |
| 2018 | 3.29% |
| 2017 | 3.45% |
| 2016 | 2.79% |
| 2015 | 3.13% |
| 2014 | 3.17% |
| 2013 | 2.89% |
| 2012 | 2.75% |
| 2011 | 3.31% |
| 2010 | 4.52% |
| 2009 | -1.33% |
| 2008 | 2.09% |
| 2007 | 4.43% |
| 2006 | 4.49% |
| 2005 | 4.06% |
| 2004 | 4.5% |
| 2003 | 3.07% |
| 2002 | 2.32% |
| 2001 | 2.03% |
| 2000 | 4.57% |
| 1999 | 3.58% |
| 1998 | 2.78% |
| 1997 | 4% |
| 1996 | 3.59% |
| 1995 | 3.18% |
| 1994 | 3.42% |
| 1993 | 1.86% |
| 1992 | 2.06% |
| 1991 | 1.23% |
| 1990 | 2.71% |
| 1989 | 3.64% |
| 1988 | 4.53% |
| 1987 | 3.75% |
| 1986 | 3.31% |
| 1985 | 3.66% |
| 1984 | 4.73% |
| 1983 | 2.58% |
| 1982 | 0.41% |
| 1981 | 1.89% |
| 1980 | 1.82% |
| 1979 | 4.14% |
| 1978 | 4.14% |
| 1977 | 3.94% |
| 1976 | 5.22% |
| 1975 | 0.81% |
| 1974 | 1.99% |
| 1973 | 6.46% |
| 1972 | 5.54% |
| 1971 | 4.11% |
| 1970 | 3.77% |
| 1969 | 5.96% |
| 1968 | 5.95% |
| 1967 | 3.74% |
| 1966 | 5.42% |
| 1965 | 5.63% |
| 1964 | 6.63% |
| 1963 | 5.02% |
| 1962 | 5.32% |
| 1961 | 3.91% |
Data sources: World Bank | Economy & Growth (1961–2025, retrieved 2026-07-08).
GeoRank.org/economy | CC BY
By adjusting for inflation, this bar chart shows real global GDP growth by year. Over the last 30 years, average annual inflation-adjusted GDP growth was 3.07%.
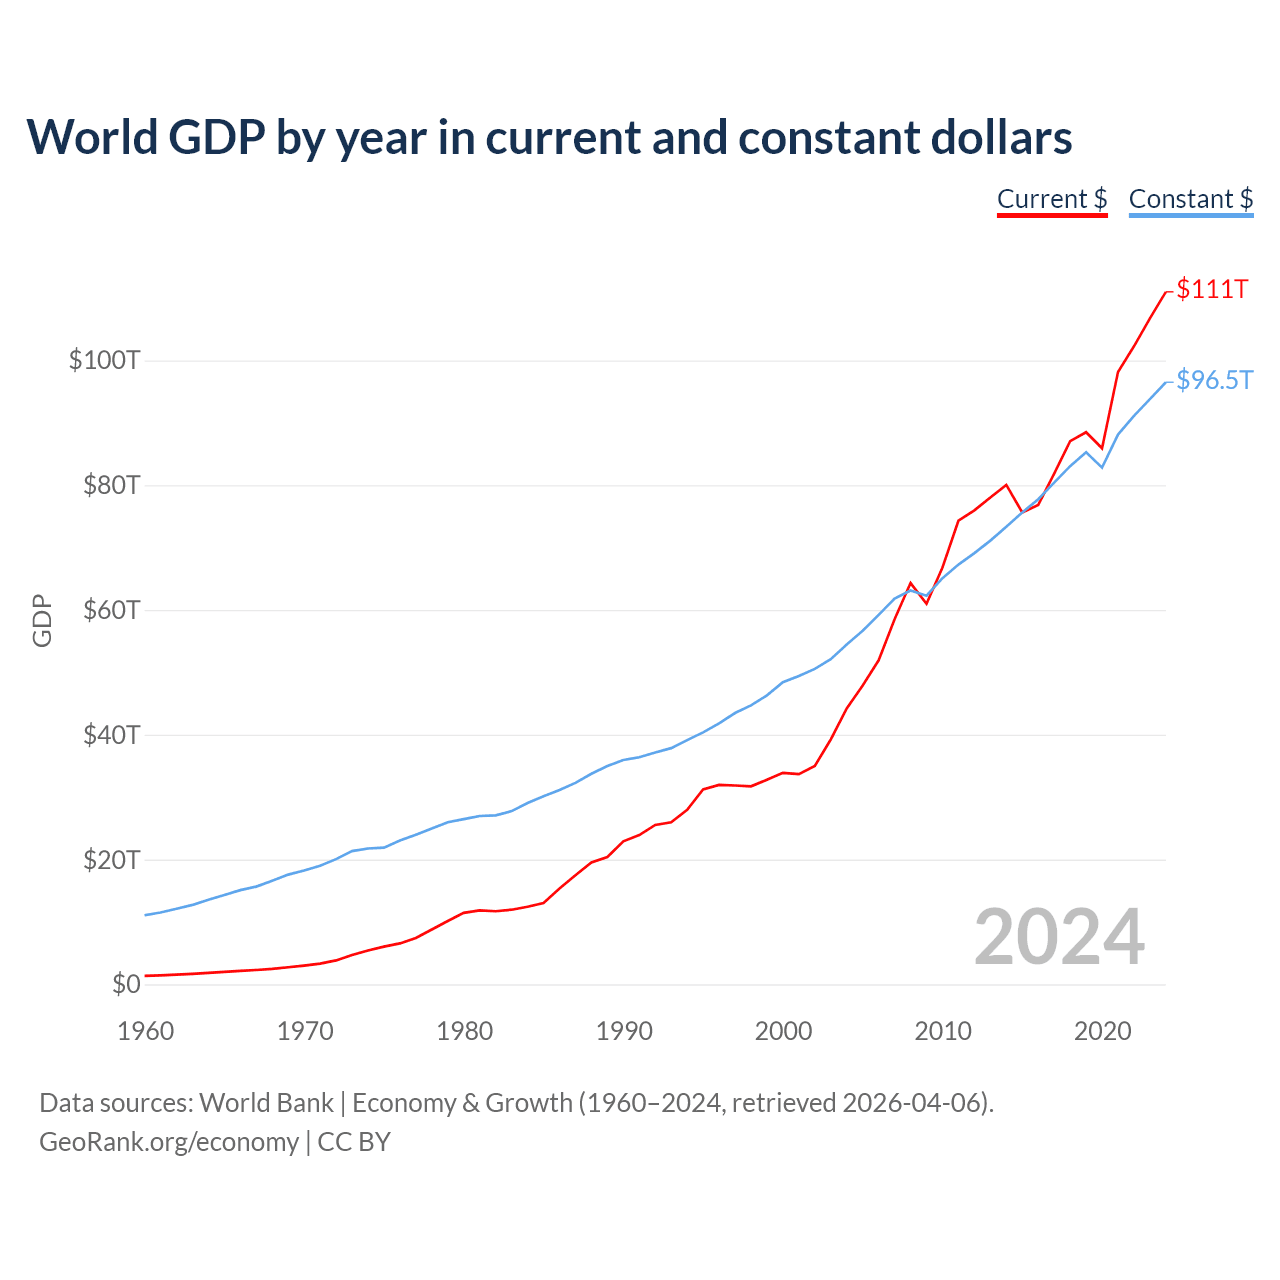
World GDP by year in current and constant dollars
| Year | GDP | |
|---|---|---|
| Current $ | Constant $ | |
| 2025 | $118,350,166,039,396 | $99,658,553,419,775 |
| 2024 | $111,669,432,109,121 | $96,829,887,869,985 |
| 2023 | $107,348,614,073,350 | $94,100,947,773,550 |
| 2022 | $102,862,471,365,575 | $91,485,038,370,117 |
| 2021 | $98,780,038,374,127 | $88,442,603,118,343 |
| 2020 | $86,388,502,867,289 | $83,056,326,526,017 |
| 2019 | $88,796,498,078,978 | $85,524,752,058,522 |
| 2018 | $87,310,840,056,718 | $83,292,262,266,946 |
| 2017 | $82,110,104,984,460 | $80,641,861,942,532 |
| 2016 | $77,084,966,373,474 | $77,955,073,125,300 |
| 2015 | $75,839,351,828,606 | $75,839,351,828,606 |
| 2014 | $80,243,543,597,079 | $73,539,611,353,223 |
| 2013 | $78,171,001,460,419 | $71,281,076,205,615 |
| 2012 | $76,055,253,368,045 | $69,279,085,457,391 |
| 2011 | $74,388,644,404,623 | $67,426,584,814,615 |
| 2010 | $66,893,676,131,663 | $65,263,543,198,397 |
| 2009 | $61,049,315,651,690 | $62,440,691,845,650 |
| 2008 | $64,378,551,514,749 | $63,284,295,644,439 |
| 2007 | $58,574,302,755,951 | $61,987,756,942,770 |
| 2006 | $51,965,655,998,564 | $59,357,487,895,116 |
| 2005 | $47,938,461,749,089 | $56,807,330,097,272 |
| 2004 | $44,264,898,214,305 | $54,591,383,204,956 |
| 2003 | $39,288,473,726,075 | $52,242,868,476,708 |
| 2002 | $35,048,255,697,763 | $50,684,736,953,403 |
| 2001 | $33,747,838,963,540 | $49,536,038,159,389 |
| 2000 | $33,965,806,441,912 | $48,550,490,166,231 |
| 1999 | $32,829,035,976,968 | $46,429,941,035,573 |
| 1998 | $31,780,795,899,557 | $44,825,818,551,443 |
| 1997 | $31,954,804,098,165 | $43,612,835,337,831 |
| 1996 | $32,064,860,700,885 | $41,936,713,327,029 |
| 1995 | $31,338,014,339,198 | $40,484,832,492,068 |
| 1994 | $28,066,274,308,784 | $39,237,825,663,962 |
| 1993 | $26,071,136,171,461 | $37,941,652,466,090 |
| 1992 | $25,631,432,757,014 | $37,249,545,850,070 |
| 1991 | $23,998,499,386,380 | $36,496,540,148,779 |
| 1990 | $22,991,895,905,266 | $36,054,803,450,838 |
| 1989 | $20,467,635,430,295 | $35,104,060,312,854 |
| 1988 | $19,597,682,774,628 | $33,871,724,575,563 |
| 1987 | $17,532,755,119,891 | $32,404,086,739,528 |
| 1986 | $15,397,826,688,510 | $31,232,431,070,055 |
| 1985 | $13,050,699,141,667 | $30,233,209,211,757 |
| 1984 | $12,459,409,786,104 | $29,165,763,942,449 |
| 1983 | $11,993,276,558,850 | $27,849,028,595,890 |
| 1982 | $11,747,181,261,107 | $27,149,421,809,913 |
| 1981 | $11,872,917,775,515 | $27,038,267,577,082 |
| 1980 | $11,479,787,747,421 | $26,537,198,843,810 |
| 1979 | $10,181,253,373,888 | $26,064,050,746,546 |
| 1978 | $8,804,316,947,866 | $25,027,685,013,913 |
| 1977 | $7,433,986,513,280 | $24,033,395,371,554 |
| 1976 | $6,574,572,862,295 | $23,122,051,557,707 |
| 1975 | $6,048,005,016,166 | $21,974,707,391,345 |
| 1974 | $5,431,302,723,228 | $21,797,173,060,901 |
| 1973 | $4,699,146,820,052 | $21,371,473,168,823 |
| 1972 | $3,842,019,736,073 | $20,075,079,346,232 |
| 1971 | $3,325,831,293,865 | $19,021,702,761,108 |
| 1970 | $3,009,478,988,899 | $18,270,953,231,134 |
| 1969 | $2,743,573,825,630 | $17,607,949,788,446 |
| 1968 | $2,483,627,131,303 | $16,617,338,011,297 |
| 1967 | $2,298,119,095,631 | $15,684,543,249,429 |
| 1966 | $2,165,498,646,895 | $15,119,371,174,428 |
| 1965 | $1,997,655,804,366 | $14,342,184,589,594 |
| 1964 | $1,833,219,012,877 | $13,577,635,041,682 |
| 1963 | $1,672,226,662,379 | $12,733,441,858,140 |
| 1962 | $1,546,545,764,840 | $12,124,837,374,808 |
| 1961 | $1,445,418,078,271 | $11,512,248,576,347 |
| 1960 | $1,367,697,816,706 | $11,078,650,356,187 |
Data sources: World Bank | Economy & Growth (1960–2025, retrieved 2026-07-08).
GeoRank.org/economy | CC BY
This chart shows world GDP from 1960 to 2025, in both current and constant (inflation-adjusted) dollars. In nominal terms, global GDP rose sharply from $1.37T in 1960 to $34T in 2000, and to $118T in 2025, reflecting not only economic expansion but also inflation.
When adjusted for inflation, the chart reveals a more moderate rise in real economic output, with periods of rapid growth in the 2000s and slowdowns during global recessions in the early 1980s, 2008–2009 (global financial crisis), and 2020 (pandemic).
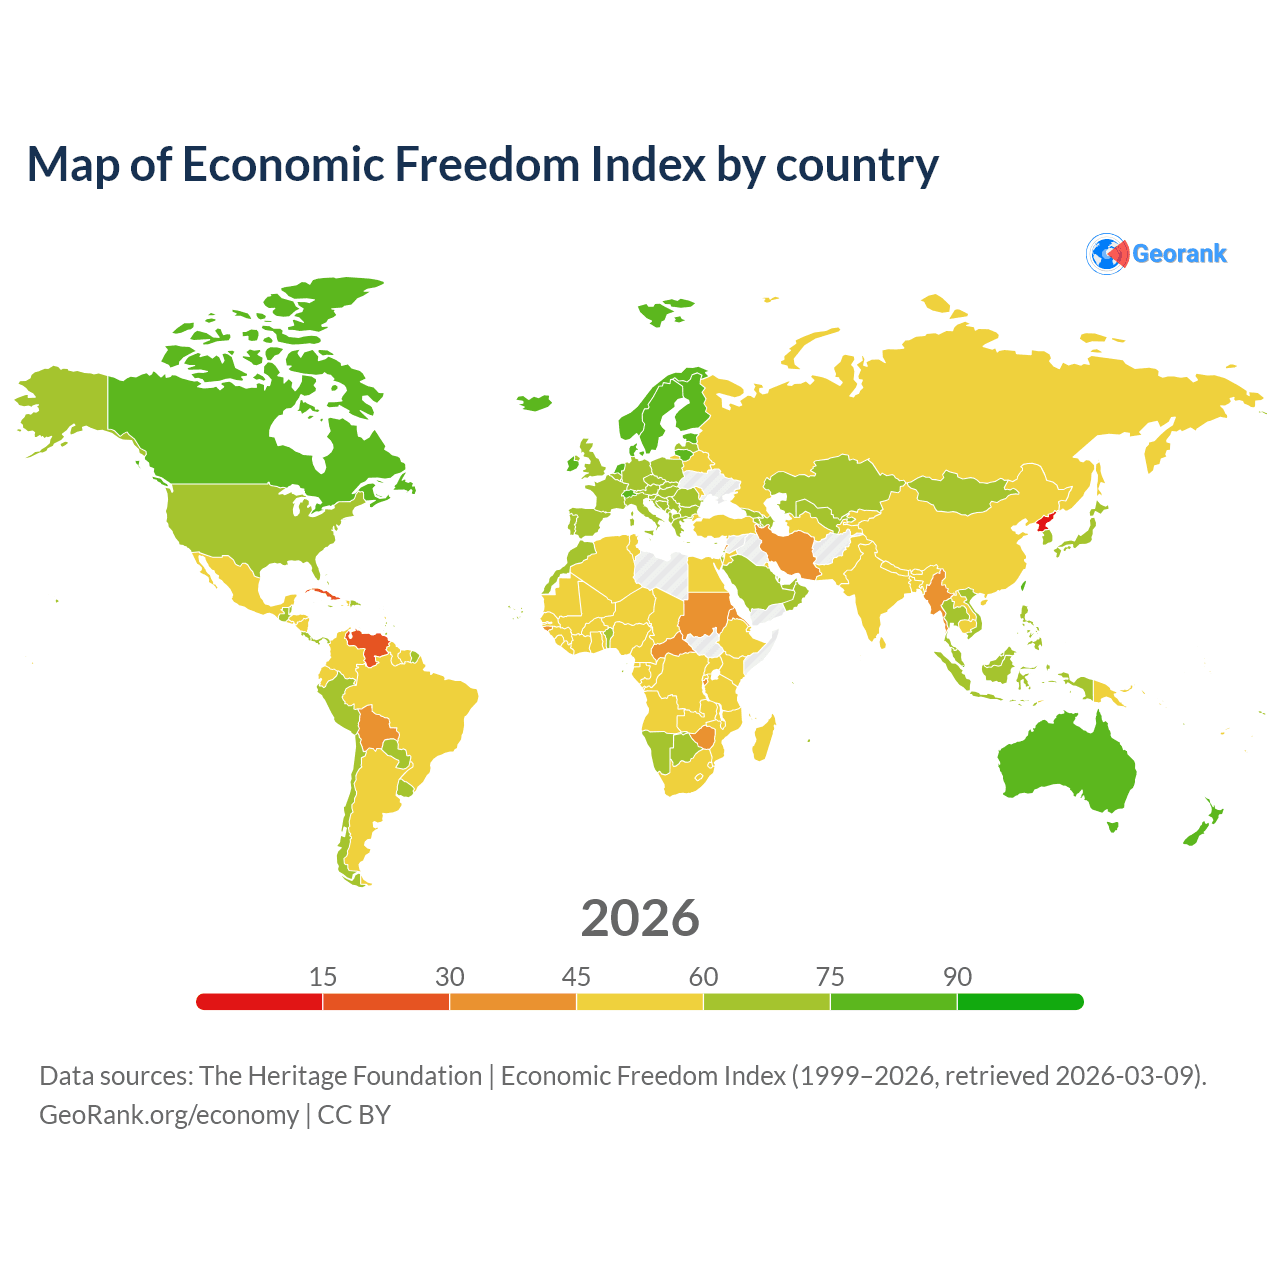
Map of Economic Freedom Index by country
Data sources: The Heritage Foundation | Economic Freedom Index (1999–2026, retrieved 2026-07-08).
GeoRank.org/economy | CC BY
The map plots each country’s Economic Freedom Index, as measured by the Heritage Foundation. Higher scores indicate greater economic freedom, characterized by stronger property rights, less government intervention, freer trade, lower tax burdens, and more open markets.
Compare the economies of any 2 countries
Help us show the world through your eyes
Share a photo of your city and help others discover what it looks like to live there. Your contribution makes our data come alive.
Data sources:
- World Bank | Economy & Growth (1960–2025, retrieved 2026-07-08)
- International Monetary Fund (IMF) | Fiscal Monitor (1990–2025, retrieved 2026-07-08)
- The Heritage Foundation | Economic Freedom Index (1999–2026, retrieved 2026-07-08)
- International Monetary Fund (IMF) | Public Finances in Modern History (1800–2025, retrieved 2026-07-08)
- National Statistics, Taiwan (1985–2025, retrieved 2026-07-08)
- U.S. Census Bureau (1960–2025, retrieved 2026-07-08)
- Central Intelligence Agency (CIA) (1998–2026, retrieved 2026-07-08)
Creative Commons Attribution (CC BY) — you’re free to copy, share, remix, adapt, and use even commercially as long as you give appropriate credit and clearly indicate if you made changes. Other sources may be subject to different license terms.