North Korea ranked 109/197 by economy size with a GDP of $34.9B and 169/197 by GDP per capita at $1,319.
In 2024, North Korea made up 0.03% of the world's economy, compared to 0.04% in 2009.
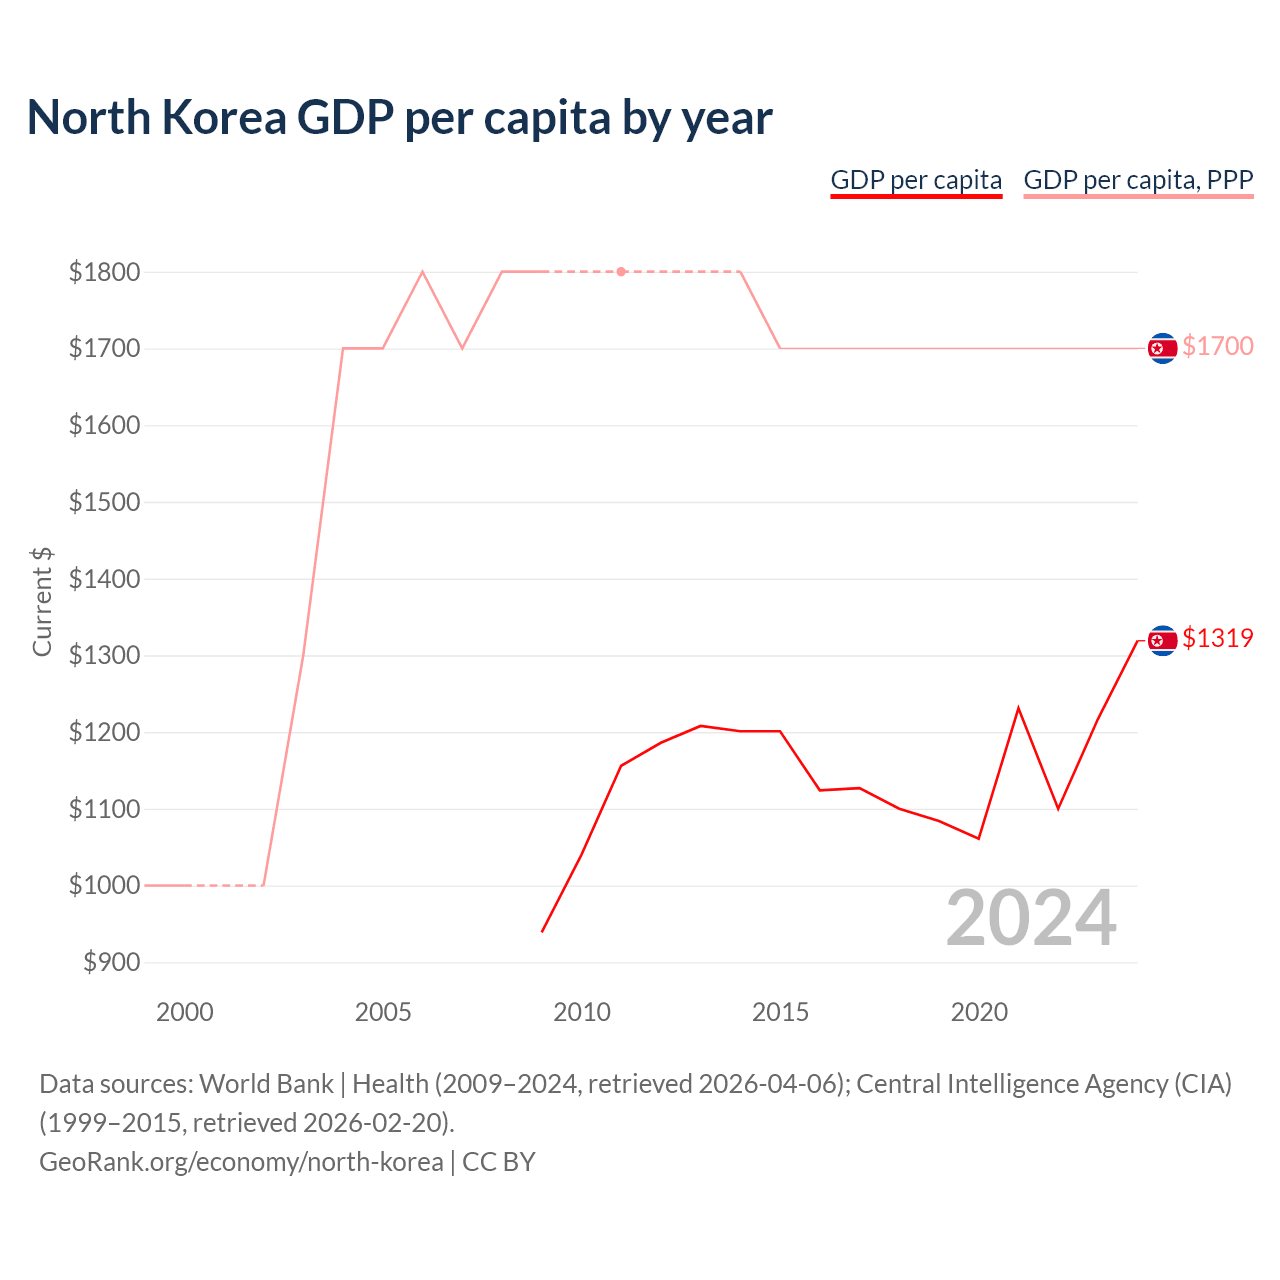
North Korea GDP per capita by year
| Year | Current $ | |
|---|---|---|
| GDP per capita | GDP per capita, PPP | |
| 2024 | $1,319 | - |
| 2023 | $1,217 | - |
| 2022 | $1,100 | - |
| 2021 | $1,231 | - |
| 2020 | $1,061 | - |
| 2019 | $1,084 | - |
| 2018 | $1,100 | - |
| 2017 | $1,127 | - |
| 2016 | $1,124 | - |
| 2015 | $1,201 | $1,700 |
| 2014 | $1,201 | $1,800 |
| 2013 | $1,208 | - |
| 2012 | $1,186 | - |
| 2011 | $1,156 | $1,800 |
| 2010 | $1,040 | - |
| 2009 | $939 | $1,800 |
| 2008 | - | $1,800 |
| 2007 | - | $1,700 |
| 2006 | - | $1,800 |
| 2005 | - | $1,700 |
| 2004 | - | $1,700 |
| 2003 | - | $1,300 |
| 2002 | - | $1,000 |
| 2001 | - | - |
| 2000 | - | $1,000 |
| 1999 | - | $1,000 |
Data sources: World Bank | Health (2009–2024, retrieved 2026-07-08); Central Intelligence Agency (CIA) (1999–2015, retrieved 2026-07-08).
GeoRank.org/economy/north-korea | CC BY 
North Korea has a GDP per capita of $1,319, ranking 169/197, a GDP per capita based on purchasing power parity (PPP) of $1,700, ranking 193/197, and a median annual after tax income of $1,707, ranking 169/197.
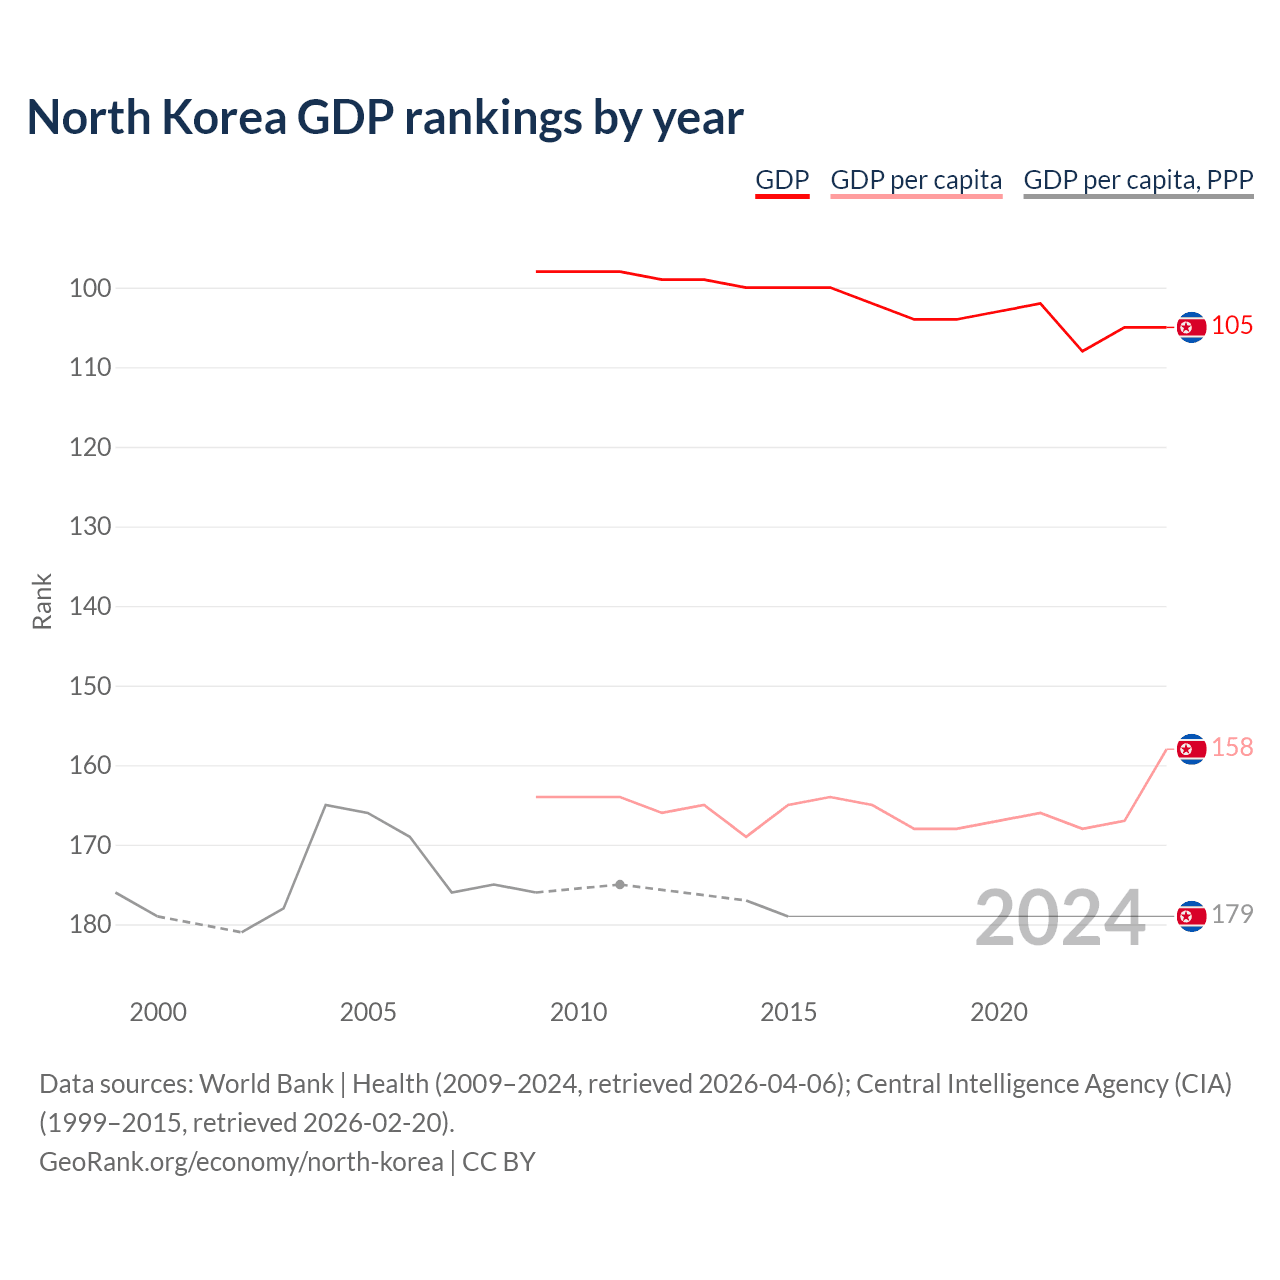
North Korea GDP rankings by year
| Year | Rank | ||
|---|---|---|---|
| GDP | GDP per capita | GDP per capita, PPP | |
| 2024 | 104 | 164 | - |
| 2023 | 105 | 167 | - |
| 2022 | 108 | 168 | - |
| 2021 | 101 | 166 | - |
| 2020 | 102 | 167 | - |
| 2019 | 104 | 168 | - |
| 2018 | 103 | 168 | - |
| 2017 | 102 | 165 | - |
| 2016 | 100 | 164 | - |
| 2015 | 100 | 165 | 179 |
| 2014 | 100 | 169 | 177 |
| 2013 | 99 | 165 | - |
| 2012 | 99 | 166 | - |
| 2011 | 98 | 164 | 175 |
| 2010 | 98 | 164 | - |
| 2009 | 98 | 164 | 176 |
| 2008 | - | - | 175 |
| 2007 | - | - | 176 |
| 2006 | - | - | 169 |
| 2005 | - | - | 166 |
| 2004 | - | - | 165 |
| 2003 | - | - | 178 |
| 2002 | - | - | 181 |
| 2001 | - | - | - |
| 2000 | - | - | 179 |
| 1999 | - | - | 176 |
Data sources: World Bank | Health (2009–2024, retrieved 2026-07-08); Central Intelligence Agency (CIA) (1999–2015, retrieved 2026-07-08).
GeoRank.org/economy/north-korea | CC BY
Compared with 2009, in 2024 North Korea is ranked 104th out of 189 by GDP (down from 98th), 164th by GDP per capita (unchanged from 164th), and 179th by GDP per capita PPP (down from 176th).
Economic indicators
 North Korea
|
Rank | |
|---|---|---|
| Gross domestic product |
$34.9B
2024 |
109/197 |
| GDP per capita |
$1,319
2024 |
169/197 |
| GDP per capita, PPP |
$1,700
2015 |
193/197 |
| Average annual personal income after taxes |
$1,707
2026 |
169/197 |
| Unemployment rate |
25.6%
2013 |
7/196 |
| Population |
26668308
|
56/197 |
North Korea top 10 trading partners
North Korea's biggest trading partner accounting for 72.3% of all exports and imports is China, with a trade balance between the two of -$1.86B: N. Korea exports $441M worth of goods and services to China and imports $2.3B.
Below is the list of the top 10 trade partners of North Korea.
| Rank | Country | Trade value | Share of total trade | Export to | Import from | Top export to | Top import from |
|---|---|---|---|---|---|---|---|
| 1 |
 China
China
|
$2.74B | 72.3% | $441M | $2.3B | Textiles & consumer goods | Textiles & consumer goods |
| 2 |
 Papua New Guinea
|
$800M | 21.1% | $154M | $647M | Raw materials & minerals | Raw materials & minerals |
| 3 |
 Burkina Faso
|
$41M | 1.08% | $41M | $0 | Animal & marine products | Animal & marine products |
| 4 |
 Trinidad
|
$36M | 0.95% | $2.46M | $33.5M | Metals | Chemicals & pharma |
| 5 |
 Venezuela
|
$29M | 0.76% | $29M | $0 | Machinery & equipment | Animal & marine products |
| 6 |
 Gabon
Gabon
|
$19M | 0.5% | $1.28M | $17.8M | Machinery & equipment | Raw materials & minerals |
| 7 |
 Cameroon
|
$16.8M | 0.44% | $16.8M | $0 | Raw materials & minerals | Animal & marine products |
| 8 |
 Togo
Togo
|
$12.8M | 0.34% | $6.65M | $6.15M | Machinery & equipment | Raw materials & minerals |
| 9 |
 Ivory Coast
|
$5.73M | 0.15% | $563K | $5.17M | Textiles & consumer goods | Raw materials & minerals |
| 10 |
 Syria
Syria
|
$5.56M | 0.15% | $165K | $5.39M | Machinery & equipment | Raw agricultural goods |
Top 10 exports
|
North Korea
|
Rank | |
|---|---|---|
| Textiles & consumer goods | $238M | 104/193 |
| Raw materials & minerals | $85.6M | 153/193 |
| Animal & marine products | $41.3M | 129/192 |
| Metals | $36.4M | 138/192 |
| Chemicals & pharma | $30.6M | 133/193 |
| Precious metals & jewellery | $25M | 125/190 |
| Machinery & equipment | $22.2M | 157/193 |
| Miscellaneous | $20.5M | 89/192 |
| Processed food, beverages & tobacco | $8.46M | 167/192 |
| Wood & paper products | $4.46M | 151/192 |
Top 10 imports
|
North Korea
|
Rank | |
|---|---|---|
| Textiles & consumer goods | $1.01B | 99/193 |
| Chemicals & pharma | $443M | 138/193 |
| Processed food, beverages & tobacco | $316M | 142/193 |
| Raw materials & minerals | $173M | 169/193 |
| Wood & paper products | $106M | 138/193 |
| Raw agricultural goods | $93M | 163/193 |
| Animal & marine products | $83.4M | 148/193 |
| Precious metals & jewellery | $53.6M | 100/193 |
| Miscellaneous | $34.5M | 121/193 |
| Machinery & equipment | $31.4M | 190/193 |
Economic freedom indices
|
North Korea
|
Rank | |
|---|---|---|
| Economic freedom | 3.1 | 197/197 |
| Property rights | 16.3 | 168/182 |
| Government integrity | 4.3 | 181/182 |
| Judicial effectiveness | 6.3 | 172/182 |
| Tax burden | 0 | 182/182 |
| Government spending | 0 | 178/180 |
| Fiscal health | 0 | 178/181 |
| Business freedom | 5 | 182/182 |
| Labor freedom | 5 | 182/182 |
| Monetary freedom | 0 | 178/180 |
| Trade freedom | 0 | 181/181 |
| Investment freedom | 0 | 179/181 |
| Financial freedom | 0 | 181/181 |
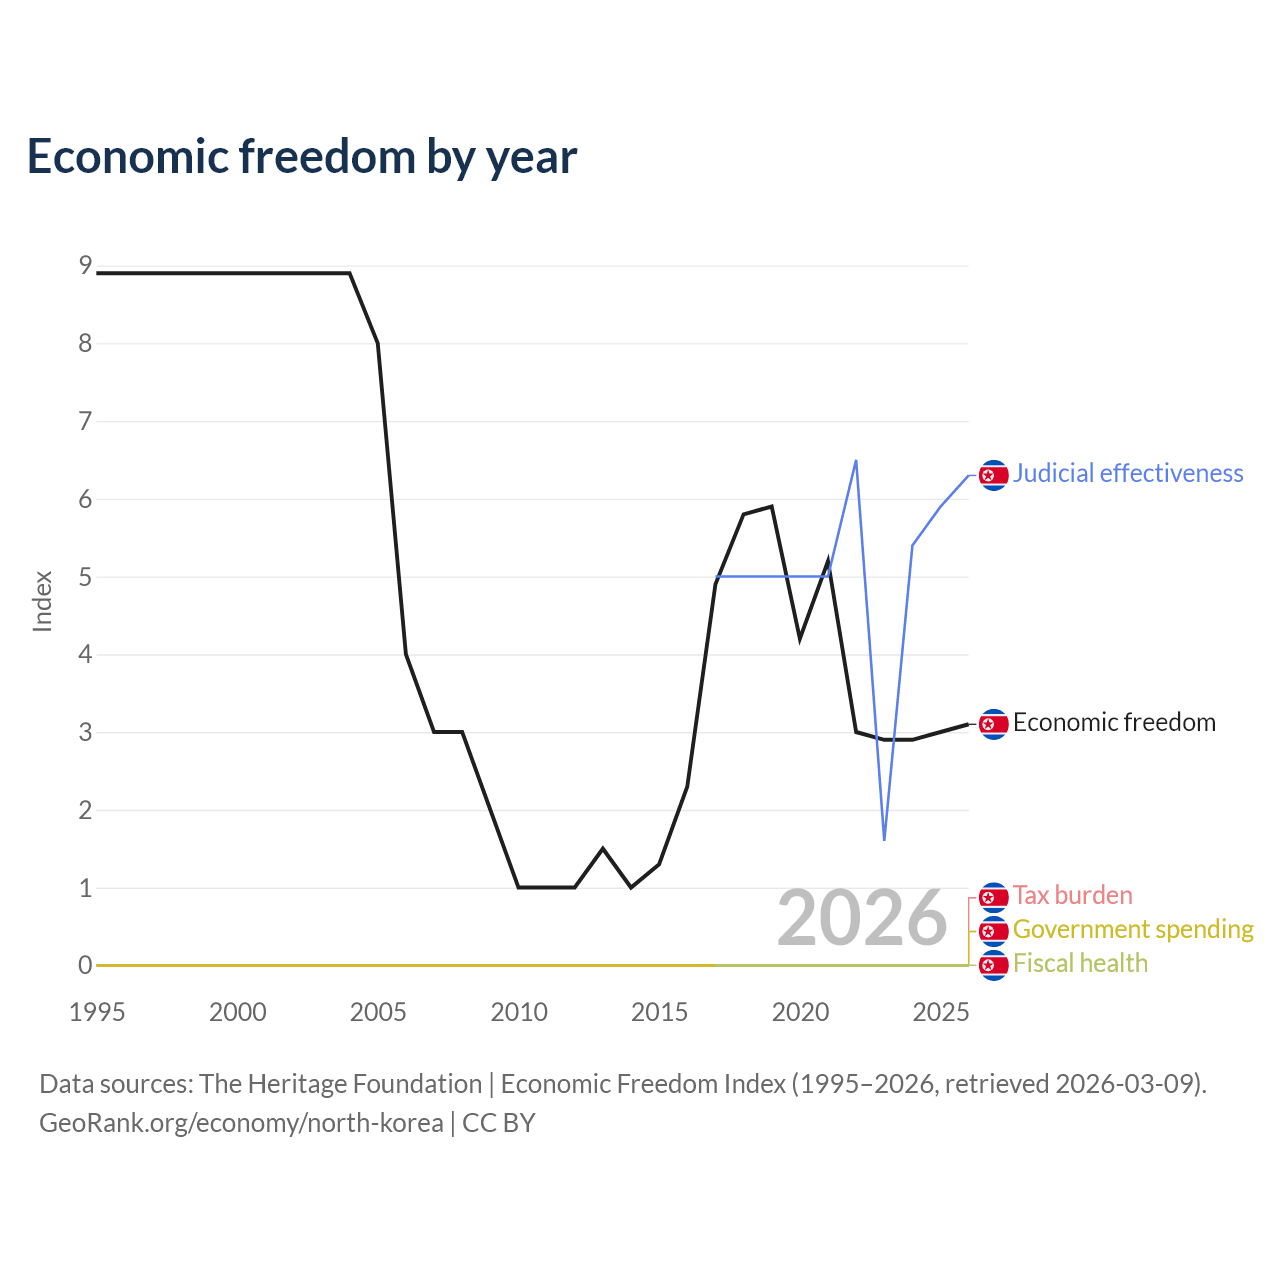
Economic freedom by year
| Year | Index | ||||
|---|---|---|---|---|---|
| Economic freedom | Judicial effectiveness | Tax burden | Government spending | Fiscal health | |
| 2026 | 3.1 | 6.3 | 0 | 0 | 0 |
| 2025 | 3 | 5.9 | 0 | 0 | 0 |
| 2024 | 2.9 | 5.4 | 0 | 0 | 0 |
| 2023 | 2.9 | 1.6 | 0 | 0 | 0 |
| 2022 | 3 | 6.5 | 0 | 0 | 0 |
| 2021 | 5.2 | 5 | 0 | 0 | 0 |
| 2020 | 4.2 | 5 | 0 | 0 | 0 |
| 2019 | 5.9 | 5 | 0 | 0 | 0 |
| 2018 | 5.8 | 5 | 0 | 0 | 0 |
| 2017 | 4.9 | 5 | 0 | 0 | 0 |
| 2016 | 2.3 | - | 0 | 0 | - |
| 2015 | 1.3 | - | 0 | 0 | - |
| 2014 | 1 | - | 0 | 0 | - |
| 2013 | 1.5 | - | 0 | 0 | - |
| 2012 | 1 | - | 0 | 0 | - |
| 2011 | 1 | - | 0 | 0 | - |
| 2010 | 1 | - | 0 | 0 | - |
| 2009 | 2 | - | 0 | 0 | - |
| 2008 | 3 | - | 0 | 0 | - |
| 2007 | 3 | - | 0 | 0 | - |
| 2006 | 4 | - | 0 | 0 | - |
| 2005 | 8 | - | 0 | 0 | - |
| 2004 | 8.9 | - | 0 | 0 | - |
| 2003 | 8.9 | - | 0 | 0 | - |
| 2002 | 8.9 | - | 0 | 0 | - |
| 2001 | 8.9 | - | 0 | 0 | - |
| 2000 | 8.9 | - | 0 | 0 | - |
| 1999 | 8.9 | - | 0 | 0 | - |
| 1998 | 8.9 | - | 0 | 0 | - |
| 1997 | 8.9 | - | 0 | 0 | - |
| 1996 | 8.9 | - | 0 | 0 | - |
| 1995 | 8.9 | - | 0 | 0 | - |
Data sources: The Heritage Foundation | Economic Freedom Index (1995–2026, retrieved 2026-07-08).
GeoRank.org/economy/north-korea | CC BY
North Korea is ranked 174/174 for economic freedom with a score of 3.1, compared to 162/162 and a score of 4 in 2006.
Other economic metrics
|
North Korea
|
Rank | |
|---|---|---|
|
Net inflows of foreign direct investment
|
$203K
1989 |
168/193 |
|
Net outflows of foreign direct investment
|
$0
2024 |
154/193 |
Compare North Korea vs other countries
GDP per capita map
Data sources: World Bank | Economy & Growth (1985–2025, retrieved 2026-07-08); U.S. Census Bureau (1985–2025, retrieved 2026-07-08).
GeoRank.org/economy/north-korea | CC BY
Help us show the world through your eyes
Share a photo of your city and help others discover what it looks like to live there. Your contribution makes our data come alive.
Data sources:
- World Bank | Economy & Growth (1985–2025, retrieved 2026-07-08)
- The Heritage Foundation | Economic Freedom Index (1995–2026, retrieved 2026-07-08)
- U.S. Census Bureau (1985–2025, retrieved 2026-07-08)
- TradeMap (2025, retrieved 2026-07-08)
- Central Intelligence Agency (CIA) (1999–2015, retrieved 2026-07-08)
- United Nations | World Population Prospects (2026, retrieved 2026-07-08)
- LivingCost (2026, retrieved 2026-07-08)
Creative Commons Attribution (CC BY) — you’re free to copy, share, remix, adapt, and use even commercially as long as you give appropriate credit and clearly indicate if you made changes. Other sources may be subject to different license terms.
Foreign direct investment (FDI, net inflows) shows how much capital foreign investors bring into a country after accounting for any funds that flow back in the opposite direction. It represents the net value of overseas companies establishing, expanding, or financing businesses in the reporting country. A positive number means more capital entered the country than was withdrawn, while a negative number means foreign investors pulled out more than they invested.
Foreign direct investment (FDI, net outflows) shows how much capital residents of a country invest abroad after accounting for any funds that flow back in the opposite direction. It represents the net value of domestic companies establishing, expanding, or financing businesses in other countries. A positive number means more capital was invested abroad than withdrawn, while a negative number means residents pulled back more than they invested.