Liechtenstein is a high-income country with a population of 41K people. The capital is Vaduz, while the largest city is Schaan, with 6K residents. Liechtenstein shares land borders with Switzerland and Austria.
Liechtenstein ranks 156/197 by GDP ($8.91B) and 2/197 by GDP per capita ($220,167).
Main facts and rankings
 Liechtenstein
|
Rank | |
|---|---|---|
| Population |
41400
|
190/197 |
| GDP |
$8.91B
2024 |
156/197 |
| GDP per capita |
$220,167
2024 |
2/197 |
| GDP per capita, PPP |
$139,100
2009 |
3/197 |
| Average annual personal income after taxes |
$109,813
2026 |
1/197 |
| Land area | 61.8 sq mi | 192/197 |
| Population density | 668 ppl/mi² | 45/197 |
| Fertility rate | 1.37 | 166/196 |
| Median age | 45.5 years | 15/196 |
| Life expectancy | 84.1 years | 11/197 |
Liechtenstein trends dashboard: time-series charts
Liechtenstein's economy ranked
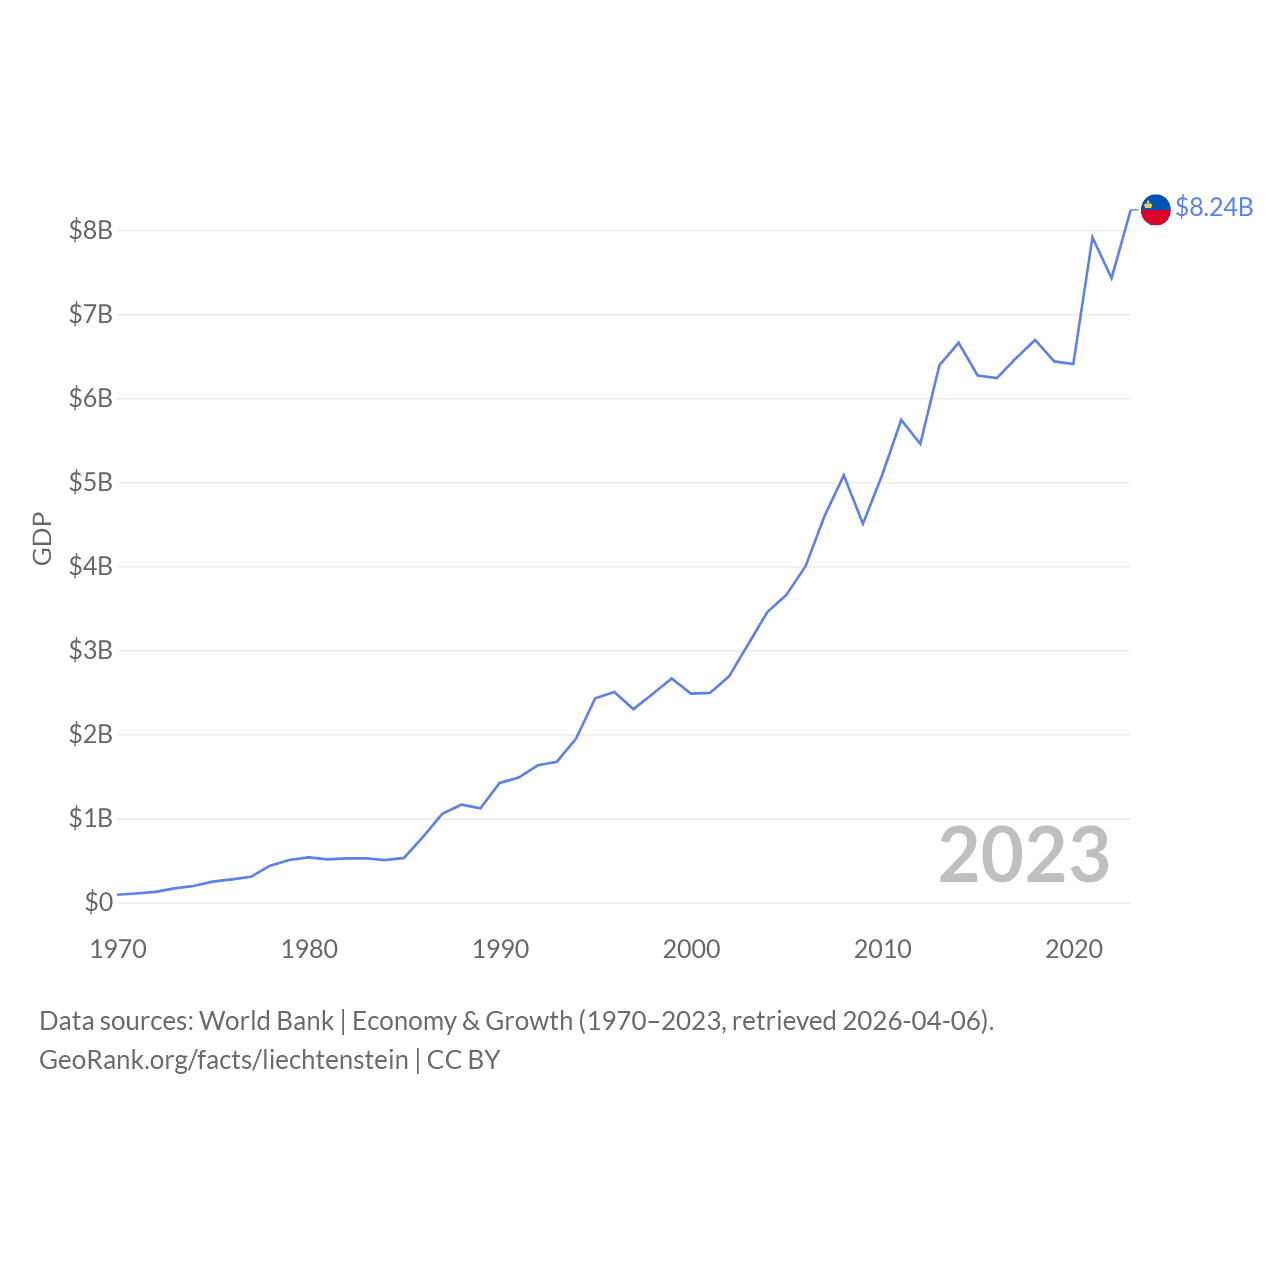
| Year | GDP |
|---|---|
| 2024 | $8,905,764,270 |
| 2023 | $8,239,379,403 |
| 2022 | $7,426,856,243 |
| 2021 | $7,912,602,342 |
| 2020 | $6,405,870,210 |
| 2019 | $6,436,467,007 |
| 2018 | $6,692,620,692 |
| 2017 | $6,474,308,718 |
| 2016 | $6,237,302,034 |
| 2015 | $6,268,515,276 |
| 2014 | $6,657,526,980 |
| 2013 | $6,391,708,311 |
| 2012 | $5,456,102,482 |
| 2011 | $5,739,706,005 |
| 2010 | $5,082,337,238 |
| 2009 | $4,504,375,348 |
| 2008 | $5,081,479,840 |
| 2007 | $4,601,429,897 |
| 2006 | $4,000,102,086 |
| 2005 | $3,659,319,117 |
| 2004 | $3,454,373,798 |
| 2003 | $3,070,803,051 |
| 2002 | $2,688,618,747 |
| 2001 | $2,491,800,559 |
| 2000 | $2,483,889,858 |
| 1999 | $2,664,105,901 |
| 1998 | $2,479,699,106 |
| 1997 | $2,298,389,803 |
| 1996 | $2,504,012,993 |
| 1995 | $2,428,525,061 |
| 1994 | $1,948,129,623 |
| 1993 | $1,673,085,245 |
| 1992 | $1,631,177,029 |
| 1991 | $1,484,160,302 |
| 1990 | $1,421,509,216 |
| 1989 | $1,119,983,801 |
| 1988 | $1,161,757,671 |
| 1987 | $1,052,848,996 |
| 1986 | $779,357,803 |
| 1985 | $529,073,612 |
| 1984 | $502,620,992 |
| 1983 | $524,023,625 |
| 1982 | $522,096,760 |
| 1981 | $511,647,750 |
| 1980 | $534,699,363 |
| 1979 | $503,173,104 |
| 1978 | $436,912,068 |
| 1977 | $303,493,119 |
| 1976 | $272,489,300 |
| 1975 | $246,389,102 |
| 1974 | $193,980,465 |
| 1973 | $165,928,882 |
| 1972 | $124,940,289 |
| 1971 | $104,889,795 |
| 1970 | $90,099,361 |
Data sources: World Bank | Economy & Growth (1970–2024, retrieved 2026-07-08).
GeoRank.org/facts/liechtenstein | CC BY 
Liechtenstein's economy ranked
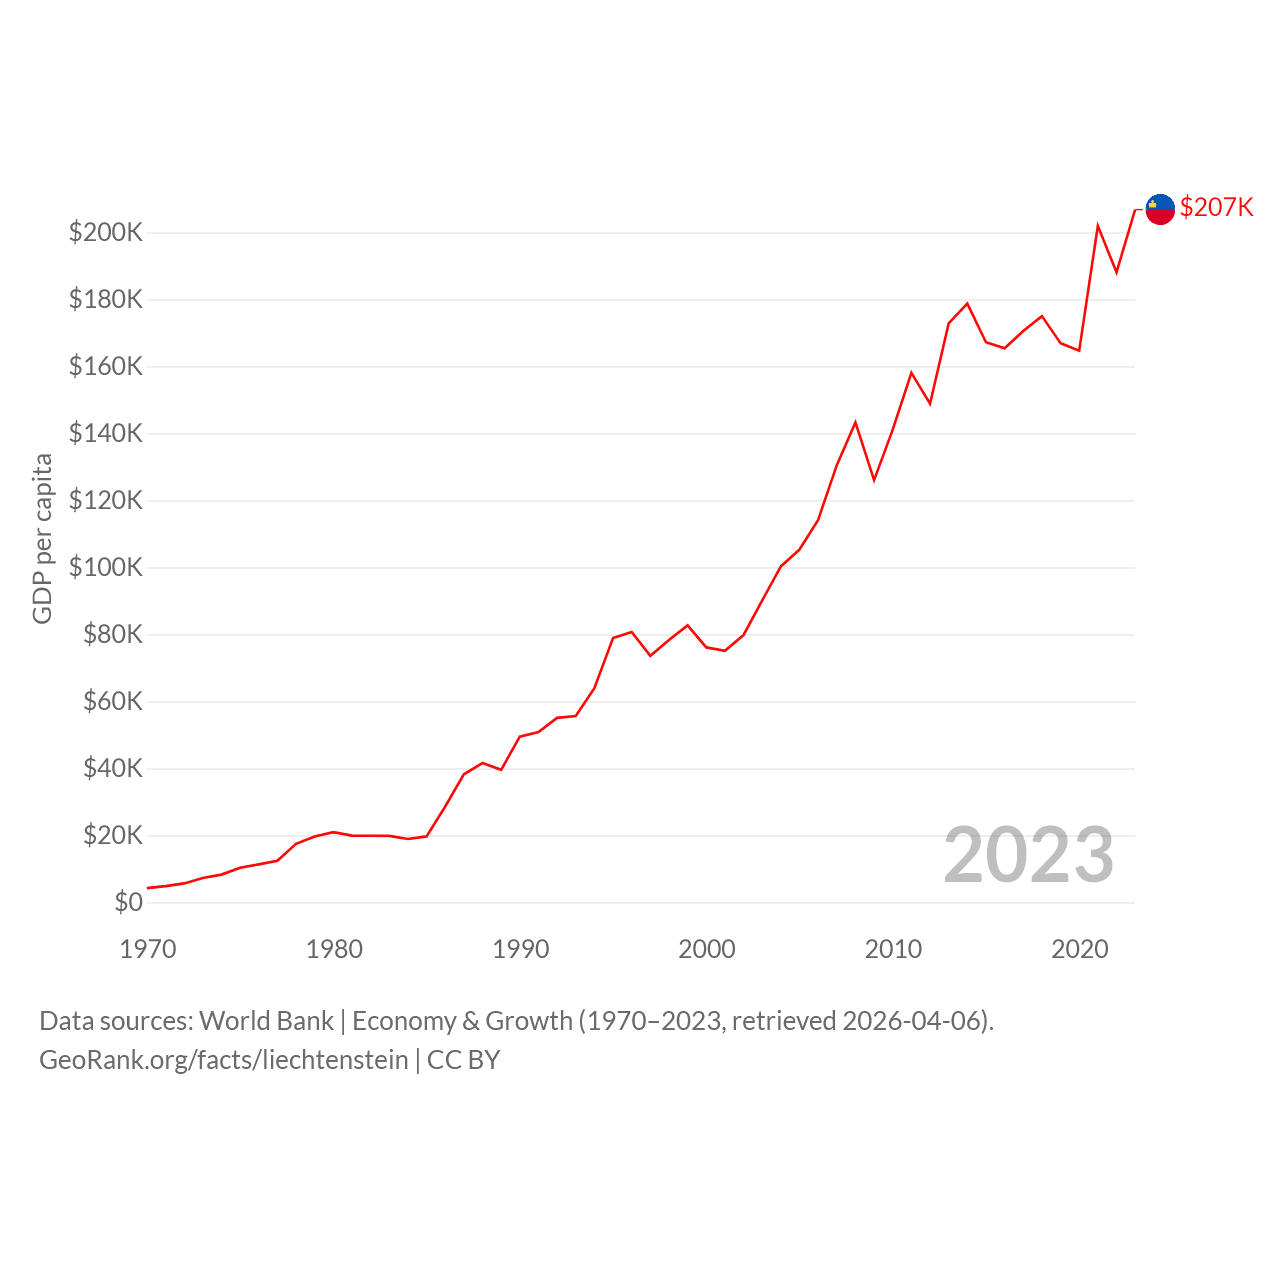
| Year | GDP per capita |
|---|---|
| 2024 | $220,167 |
| 2023 | $206,781 |
| 2022 | $188,055 |
| 2021 | $201,945 |
| 2020 | $164,671 |
| 2019 | $166,908 |
| 2018 | $174,989 |
| 2017 | $170,547 |
| 2016 | $165,375 |
| 2015 | $167,187 |
| 2014 | $178,735 |
| 2013 | $172,824 |
| 2012 | $148,842 |
| 2011 | $158,066 |
| 2010 | $141,090 |
| 2009 | $126,025 |
| 2008 | $143,249 |
| 2007 | $130,493 |
| 2006 | $114,168 |
| 2005 | $105,295 |
| 2004 | $100,281 |
| 2003 | $90,108 |
| 2002 | $79,795 |
| 2001 | $75,068 |
| 2000 | $76,088 |
| 1999 | $82,682 |
| 1998 | $78,303 |
| 1997 | $73,591 |
| 1996 | $80,689 |
| 1995 | $78,910 |
| 1994 | $63,936 |
| 1993 | $55,605 |
| 1992 | $55,057 |
| 1991 | $50,812 |
| 1990 | $49,458 |
| 1989 | $39,552 |
| 1988 | $41,569 |
| 1987 | $38,206 |
| 1986 | $28,613 |
| 1985 | $19,684 |
| 1984 | $18,898 |
| 1983 | $19,815 |
| 1982 | $19,886 |
| 1981 | $19,929 |
| 1980 | $20,959 |
| 1979 | $19,674 |
| 1978 | $17,457 |
| 1977 | $12,417 |
| 1976 | $11,326 |
| 1975 | $10,333 |
| 1974 | $8,272 |
| 1973 | $7,282 |
| 1972 | $5,645 |
| 1971 | $4,856 |
| 1970 | $4,262 |
Data sources: World Bank | Economy & Growth (1970–2024, retrieved 2026-07-08).
GeoRank.org/facts/liechtenstein | CC BY
Liechtenstein's life expectancy calculator
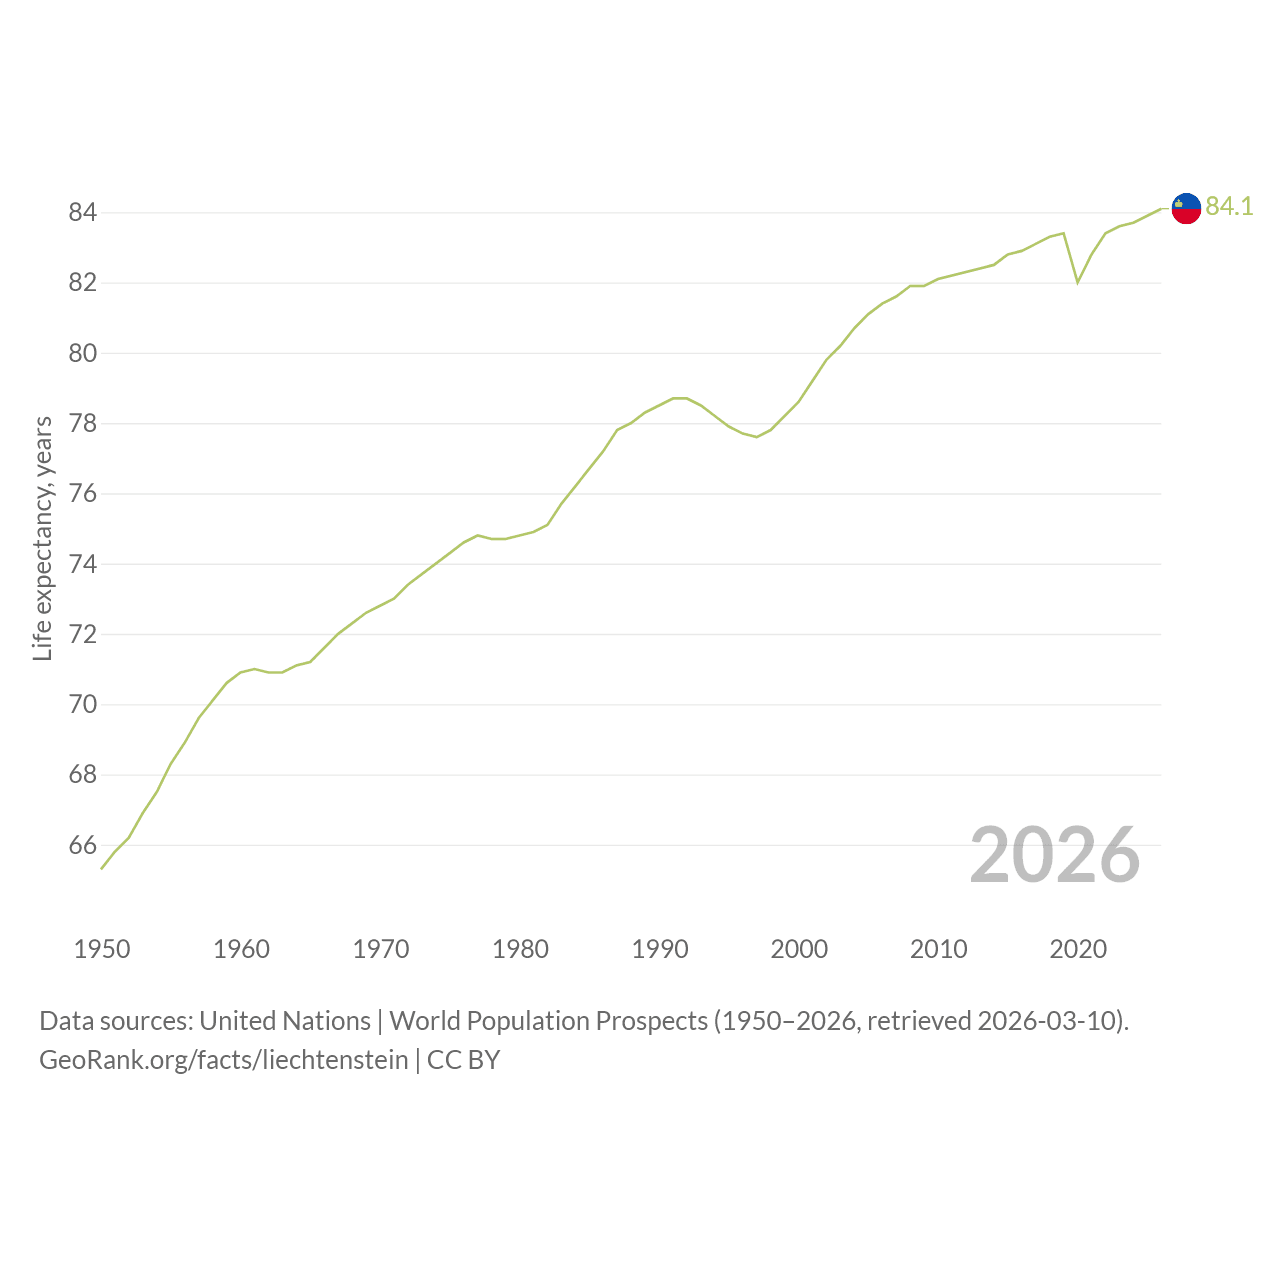
| Year | Life expectancy, years |
|---|---|
| 2026 | 84.1 |
| 2025 | 83.9 |
| 2024 | 83.7 |
| 2023 | 83.6 |
| 2022 | 83.4 |
| 2021 | 82.8 |
| 2020 | 82 |
| 2019 | 83.4 |
| 2018 | 83.3 |
| 2017 | 83.1 |
| 2016 | 82.9 |
| 2015 | 82.8 |
| 2014 | 82.5 |
| 2013 | 82.4 |
| 2012 | 82.3 |
| 2011 | 82.2 |
| 2010 | 82.1 |
| 2009 | 81.9 |
| 2008 | 81.9 |
| 2007 | 81.6 |
| 2006 | 81.4 |
| 2005 | 81.1 |
| 2004 | 80.7 |
| 2003 | 80.2 |
| 2002 | 79.8 |
| 2001 | 79.2 |
| 2000 | 78.6 |
| 1999 | 78.2 |
| 1998 | 77.8 |
| 1997 | 77.6 |
| 1996 | 77.7 |
| 1995 | 77.9 |
| 1994 | 78.2 |
| 1993 | 78.5 |
| 1992 | 78.7 |
| 1991 | 78.7 |
| 1990 | 78.5 |
| 1989 | 78.3 |
| 1988 | 78 |
| 1987 | 77.8 |
| 1986 | 77.2 |
| 1985 | 76.7 |
| 1984 | 76.2 |
| 1983 | 75.7 |
| 1982 | 75.1 |
| 1981 | 74.9 |
| 1980 | 74.8 |
| 1979 | 74.7 |
| 1978 | 74.7 |
| 1977 | 74.8 |
| 1976 | 74.6 |
| 1975 | 74.3 |
| 1974 | 74 |
| 1973 | 73.7 |
| 1972 | 73.4 |
| 1971 | 73 |
| 1970 | 72.8 |
| 1969 | 72.6 |
| 1968 | 72.3 |
| 1967 | 72 |
| 1966 | 71.6 |
| 1965 | 71.2 |
| 1964 | 71.1 |
| 1963 | 70.9 |
| 1962 | 70.9 |
| 1961 | 71 |
| 1960 | 70.9 |
| 1959 | 70.6 |
| 1958 | 70.1 |
| 1957 | 69.6 |
| 1956 | 68.9 |
| 1955 | 68.3 |
| 1954 | 67.5 |
| 1953 | 66.9 |
| 1952 | 66.2 |
| 1951 | 65.8 |
| 1950 | 65.3 |
Data sources: United Nations | World Population Prospects (1950–2026, retrieved 2026-07-08).
GeoRank.org/facts/liechtenstein | CC BY
Liechtenstein's population clock and projection
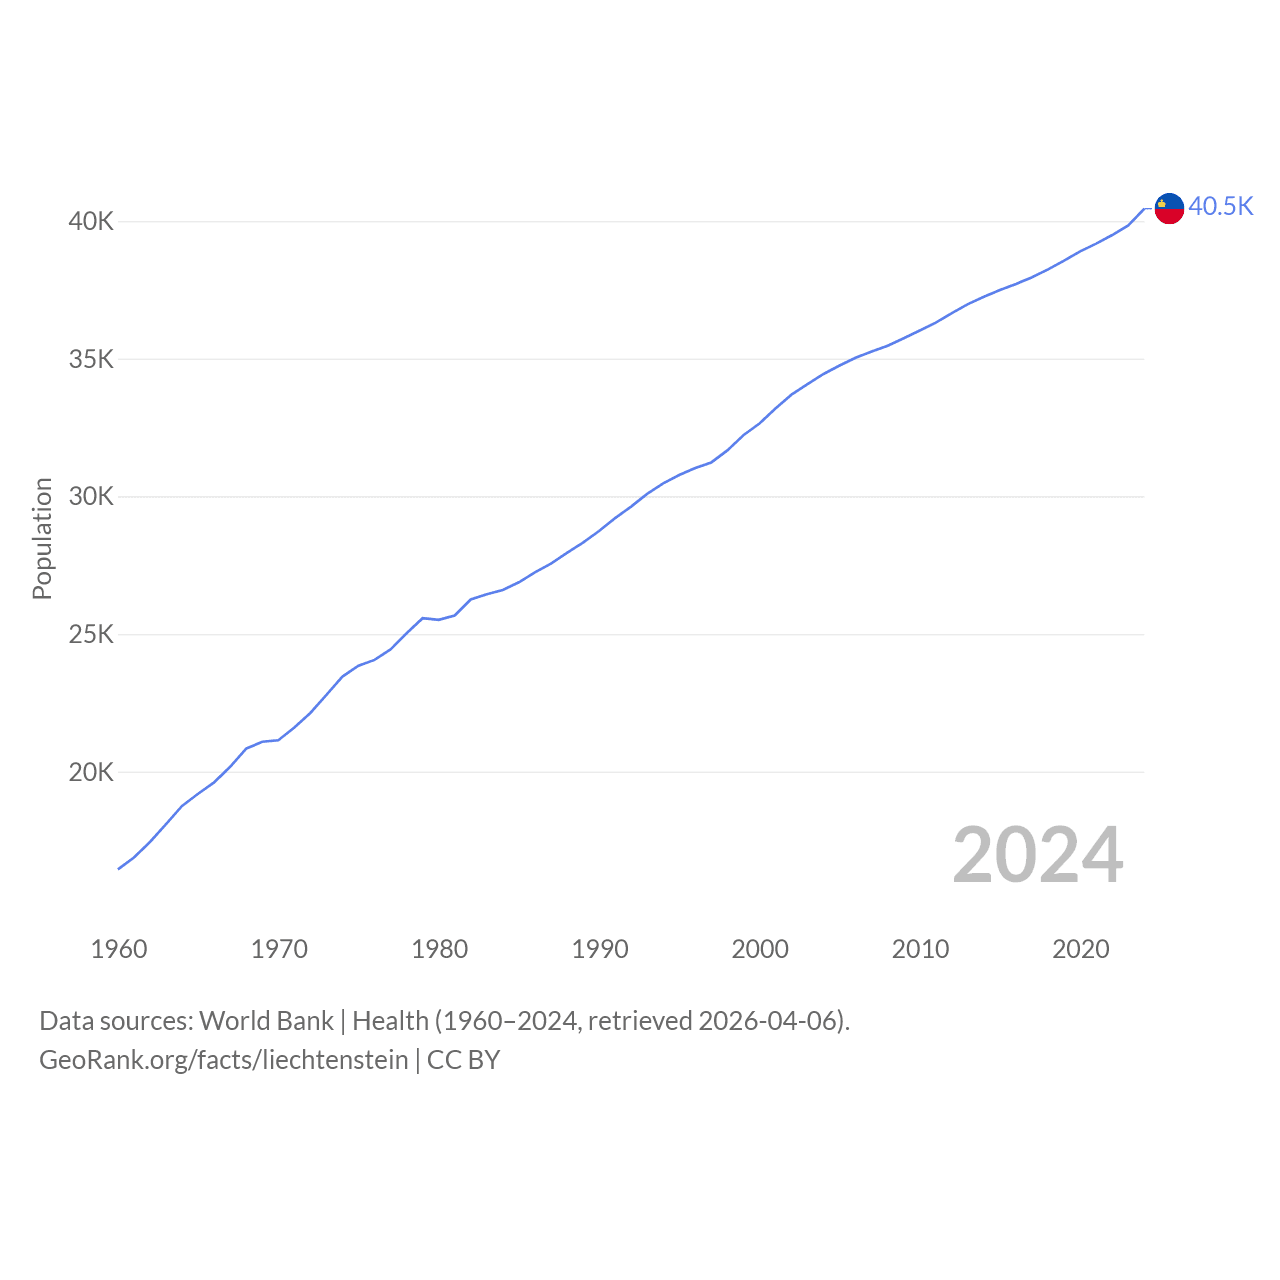
| Year | Population |
|---|---|
| 2025 | 41,024 |
| 2024 | 40,450 |
| 2023 | 39,846 |
| 2022 | 39,493 |
| 2021 | 39,182 |
| 2020 | 38,901 |
| 2019 | 38,563 |
| 2018 | 38,246 |
| 2017 | 37,962 |
| 2016 | 37,716 |
| 2015 | 37,494 |
| 2014 | 37,248 |
| 2013 | 36,984 |
| 2012 | 36,657 |
| 2011 | 36,312 |
| 2010 | 36,022 |
| 2009 | 35,742 |
| 2008 | 35,473 |
| 2007 | 35,262 |
| 2006 | 35,037 |
| 2005 | 34,753 |
| 2004 | 34,447 |
| 2003 | 34,079 |
| 2002 | 33,694 |
| 2001 | 33,194 |
| 2000 | 32,645 |
| 1999 | 32,221 |
| 1998 | 31,668 |
| 1997 | 31,232 |
| 1996 | 31,033 |
| 1995 | 30,776 |
| 1994 | 30,470 |
| 1993 | 30,089 |
| 1992 | 29,627 |
| 1991 | 29,209 |
| 1990 | 28,742 |
| 1989 | 28,317 |
| 1988 | 27,948 |
| 1987 | 27,557 |
| 1986 | 27,238 |
| 1985 | 26,878 |
| 1984 | 26,596 |
| 1983 | 26,446 |
| 1982 | 26,255 |
| 1981 | 25,673 |
| 1980 | 25,512 |
| 1979 | 25,575 |
| 1978 | 25,028 |
| 1977 | 24,442 |
| 1976 | 24,058 |
| 1975 | 23,846 |
| 1974 | 23,451 |
| 1973 | 22,785 |
| 1972 | 22,132 |
| 1971 | 21,600 |
| 1970 | 21,140 |
| 1969 | 21,084 |
| 1968 | 20,835 |
| 1967 | 20,175 |
| 1966 | 19,610 |
| 1965 | 19,195 |
| 1964 | 18,755 |
| 1963 | 18,093 |
| 1962 | 17,443 |
| 1961 | 16,877 |
| 1960 | 16,451 |
Data sources: World Bank | Health (1960–2025, retrieved 2026-07-08).
GeoRank.org/facts/liechtenstein | CC BY
Liechtenstein's birth and fertility rates
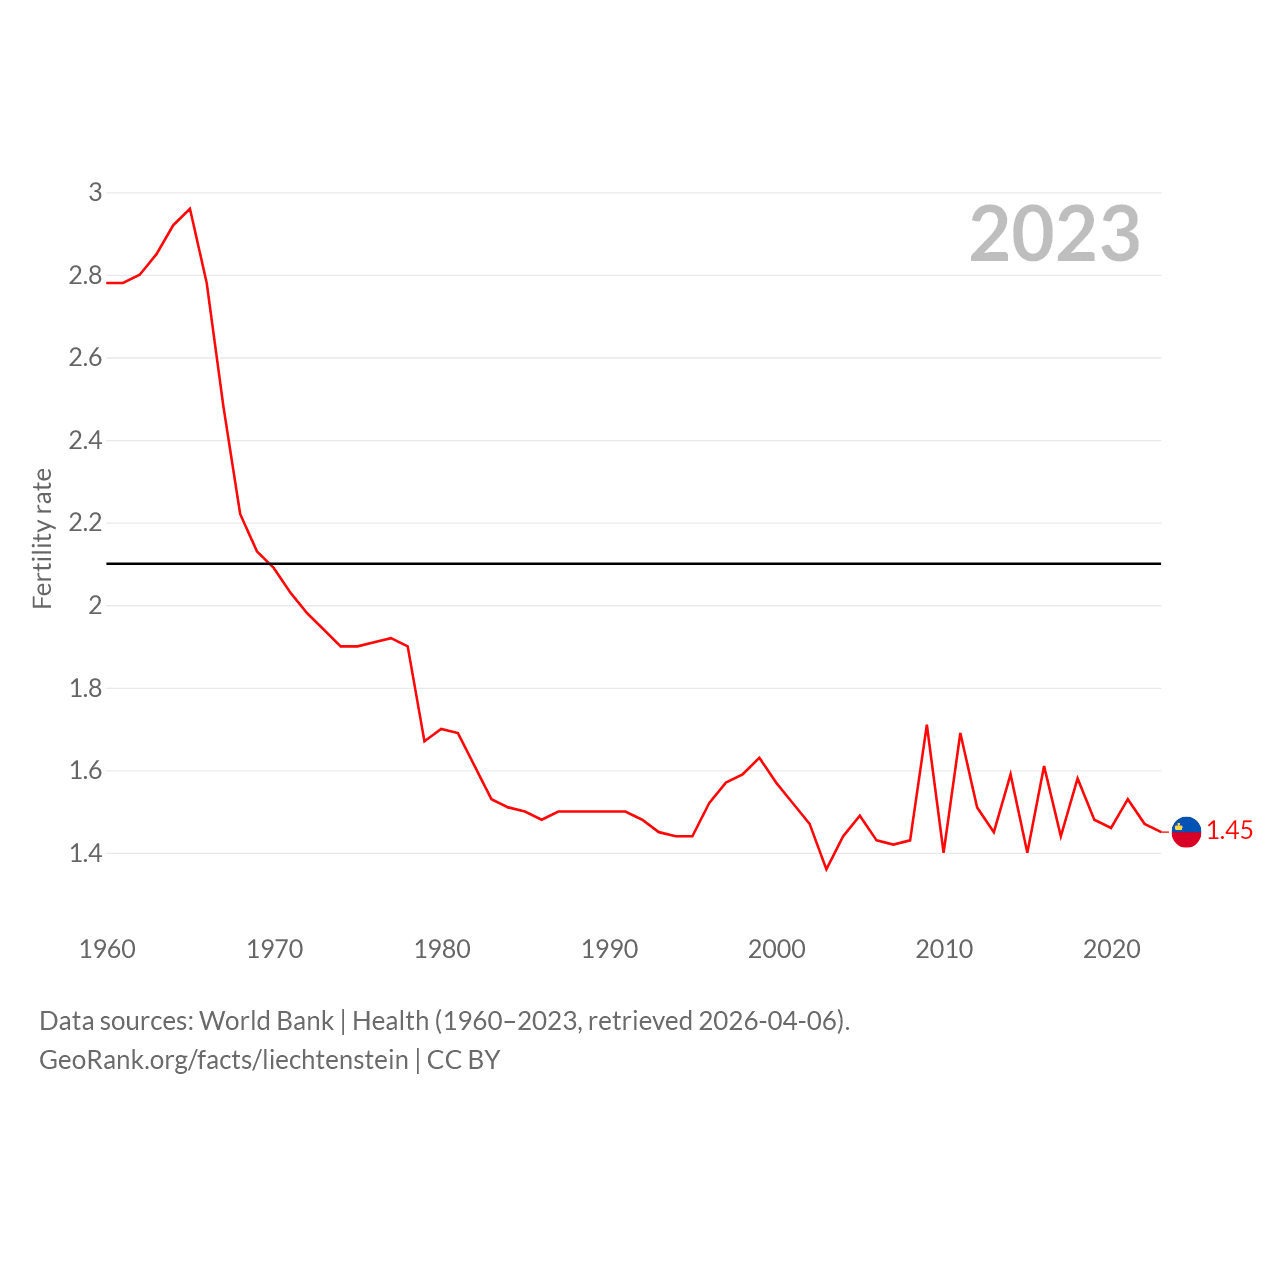
| Year | Fertility rate |
|---|---|
| 2024 | 1.37 |
| 2023 | 1.45 |
| 2022 | 1.47 |
| 2021 | 1.53 |
| 2020 | 1.46 |
| 2019 | 1.48 |
| 2018 | 1.58 |
| 2017 | 1.44 |
| 2016 | 1.61 |
| 2015 | 1.4 |
| 2014 | 1.59 |
| 2013 | 1.45 |
| 2012 | 1.51 |
| 2011 | 1.69 |
| 2010 | 1.4 |
| 2009 | 1.71 |
| 2008 | 1.43 |
| 2007 | 1.42 |
| 2006 | 1.43 |
| 2005 | 1.49 |
| 2004 | 1.44 |
| 2003 | 1.36 |
| 2002 | 1.47 |
| 2001 | 1.52 |
| 2000 | 1.57 |
| 1999 | 1.63 |
| 1998 | 1.59 |
| 1997 | 1.57 |
| 1996 | 1.52 |
| 1995 | 1.44 |
| 1994 | 1.44 |
| 1993 | 1.45 |
| 1992 | 1.48 |
| 1991 | 1.5 |
| 1990 | 1.5 |
| 1989 | 1.5 |
| 1988 | 1.5 |
| 1987 | 1.5 |
| 1986 | 1.48 |
| 1985 | 1.5 |
| 1984 | 1.51 |
| 1983 | 1.53 |
| 1982 | 1.61 |
| 1981 | 1.69 |
| 1980 | 1.7 |
| 1979 | 1.67 |
| 1978 | 1.9 |
| 1977 | 1.92 |
| 1976 | 1.91 |
| 1975 | 1.9 |
| 1974 | 1.9 |
| 1973 | 1.94 |
| 1972 | 1.98 |
| 1971 | 2.03 |
| 1970 | 2.09 |
| 1969 | 2.13 |
| 1968 | 2.22 |
| 1967 | 2.48 |
| 1966 | 2.78 |
| 1965 | 2.96 |
| 1964 | 2.92 |
| 1963 | 2.85 |
| 1962 | 2.8 |
| 1961 | 2.78 |
| 1960 | 2.78 |
Data sources: World Bank | Health (1960–2024, retrieved 2026-07-08).
GeoRank.org/facts/liechtenstein | CC BY
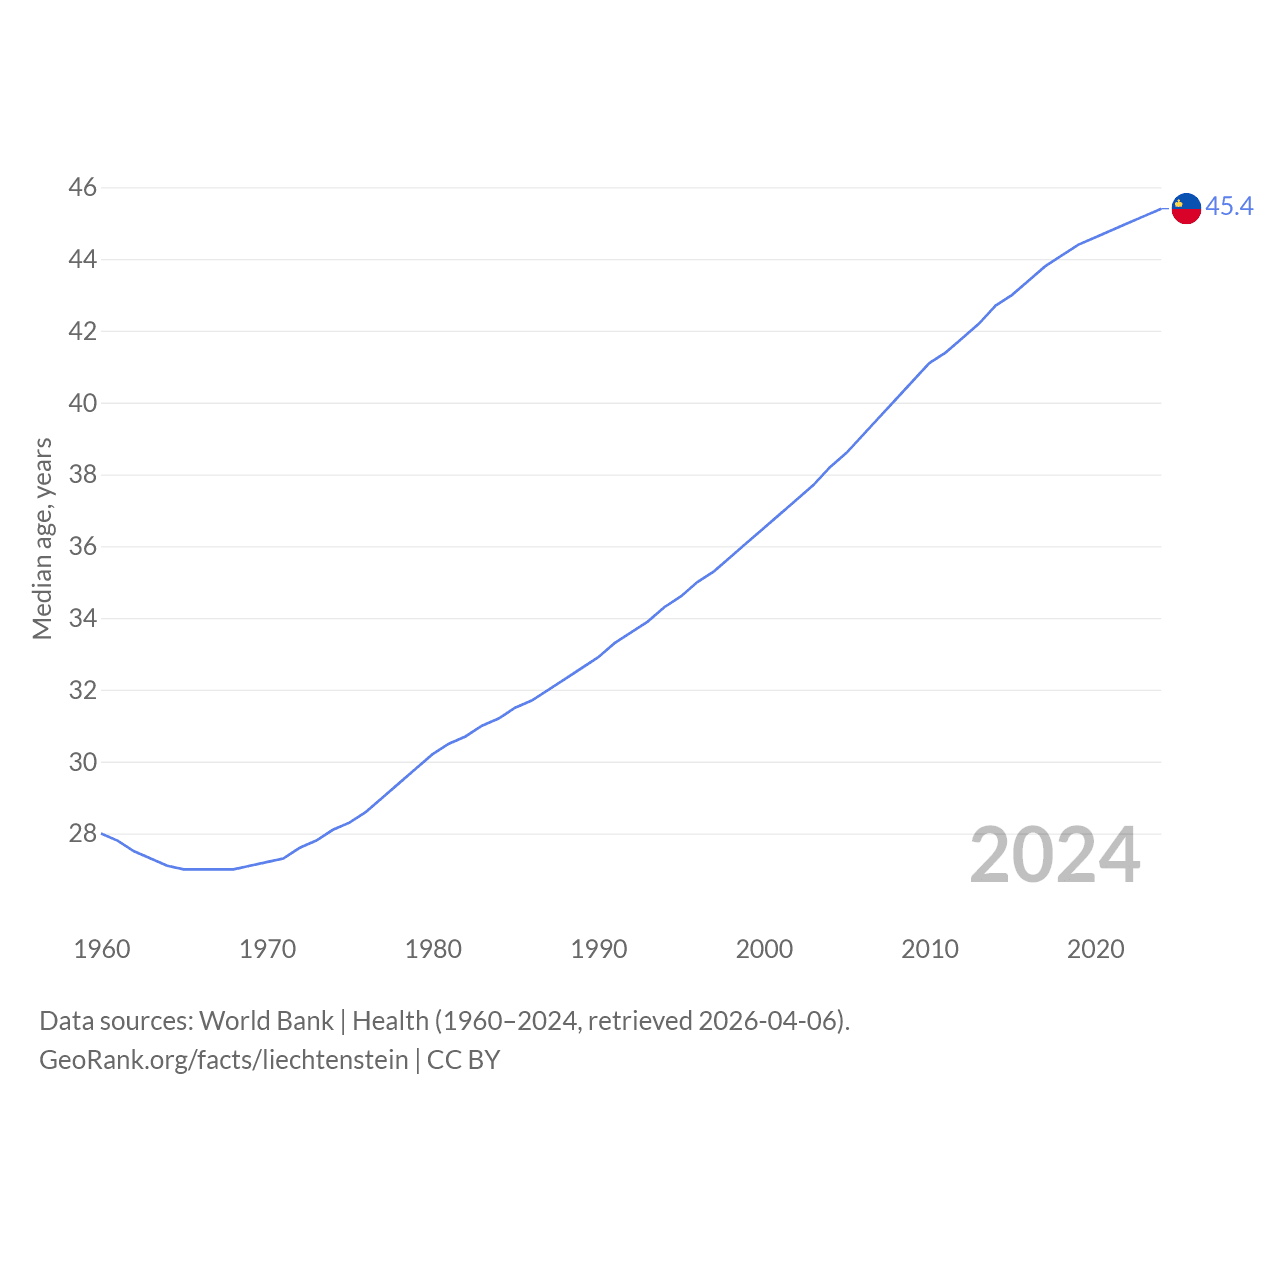
| Year | Median age, years |
|---|---|
| 2025 | 45.5 |
| 2024 | 45.4 |
| 2023 | 45.2 |
| 2022 | 45 |
| 2021 | 44.8 |
| 2020 | 44.6 |
| 2019 | 44.4 |
| 2018 | 44.1 |
| 2017 | 43.8 |
| 2016 | 43.4 |
| 2015 | 43 |
| 2014 | 42.7 |
| 2013 | 42.2 |
| 2012 | 41.8 |
| 2011 | 41.4 |
| 2010 | 41.1 |
| 2009 | 40.6 |
| 2008 | 40.1 |
| 2007 | 39.6 |
| 2006 | 39.1 |
| 2005 | 38.6 |
| 2004 | 38.2 |
| 2003 | 37.7 |
| 2002 | 37.3 |
| 2001 | 36.9 |
| 2000 | 36.5 |
| 1999 | 36.1 |
| 1998 | 35.7 |
| 1997 | 35.3 |
| 1996 | 35 |
| 1995 | 34.6 |
| 1994 | 34.3 |
| 1993 | 33.9 |
| 1992 | 33.6 |
| 1991 | 33.3 |
| 1990 | 32.9 |
| 1989 | 32.6 |
| 1988 | 32.3 |
| 1987 | 32 |
| 1986 | 31.7 |
| 1985 | 31.5 |
| 1984 | 31.2 |
| 1983 | 31 |
| 1982 | 30.7 |
| 1981 | 30.5 |
| 1980 | 30.2 |
| 1979 | 29.8 |
| 1978 | 29.4 |
| 1977 | 29 |
| 1976 | 28.6 |
| 1975 | 28.3 |
| 1974 | 28.1 |
| 1973 | 27.8 |
| 1972 | 27.6 |
| 1971 | 27.3 |
| 1970 | 27.2 |
| 1969 | 27.1 |
| 1968 | 27 |
| 1967 | 27 |
| 1966 | 27 |
| 1965 | 27 |
| 1964 | 27.1 |
| 1963 | 27.3 |
| 1962 | 27.5 |
| 1961 | 27.8 |
| 1960 | 28 |
Data sources: World Bank | Health (1960–2025, retrieved 2026-07-08).
GeoRank.org/facts/liechtenstein | CC BY
Liechtenstein vs. World: Interactive Maps
Use the buttons below to toggle between world maps that display different statistics comparing Liechtenstein with other countries.
Liechtenstein: National Statistics
Finance
|
Liechtenstein
|
Rank | |
|---|---|---|
| GNI, Atlas method |
$4.16B
2009 |
163/194 |
| Government expenditure, % of GDP |
22.6%
2026 |
134/195 |
| Education expenditure, % of GDP |
2.56%
2011 |
157/193 |
| Unemployment rate |
2.31%
2017 |
171/196 |
| Services, % of GDP |
57.4%
2023 |
94/191 |
| Industry, % of GDP |
39.1%
2023 |
18/194 |
| Economic freedom index |
74
2026 |
23/197 |
| Number of billionaires |
1
2026 |
69/74 |
| Percentage of billionaires |
0.003%
2026 |
2/74 |
| International tourist arrivals |
58,400
2020 |
174/188 |
Energy
|
Liechtenstein
|
Rank | |
|---|---|---|
| Renewable energy use share |
56.9%
2022 |
42/193 |
| Electricity access |
100%
2023 |
54/195 |
Society
|
Liechtenstein
|
Rank | |
|---|---|---|
| % of world population |
0.0005%
2025 |
190/197 |
| Annual migration change |
+194
2025 |
71/196 |
| Urban population |
14.6%
2025 |
195/195 |
| Male:Female ratio |
49.7:50.3
2025 |
N/A |
| Quality of life index |
97.5
2026 |
3/197 |
| Corruption Perceptions Index |
82
2026 |
5/197 |
| Higher education index |
44
2026 |
104/183 |
| Homicides per 100K people |
5.12
2021 |
71/197 |
| Road traffic mortality per 100K people |
0.5
2026 |
192/197 |
| Visa free countries |
170
2026 |
38/195 |
| Adult literacy rate |
100%
2013 |
3/196 |
| English speaking |
15.1%
2026 |
122/197 |
| People using the Internet |
98.3%
2024 |
9/195 |
Health
|
Liechtenstein
|
Rank | |
|---|---|---|
| Government health expenditure per capita |
$11,495
2023 |
3/192 |
| Out-of-pocket health expenditure per capita |
$2,266
2023 |
2/192 |
| Life expectancy |
84.1 years
2026 |
11/197 |
| Age at first childbirth |
31.3 years
2017 |
8/137 |
| Diabetes prevalence |
7.2%
2024 |
128/195 |
| Air quality index |
86
2026 |
29/197 |
Territory
|
Liechtenstein
|
Rank | |
|---|---|---|
| % of world land |
0.0001%
2026 |
192/197 |
| Land area per capita |
1,506 sq mi
2025 |
154/197 |
| Agricultural land area |
20 sq mi
2026 |
187/194 |
| Forest area |
25.9 sq mi
2026 |
182/196 |
| Roads length |
391 mi
2019 |
166/176 |
Compare Liechtenstein with other countries
Help us show the world through your eyes
Share a photo of your city and help others discover what it looks like to live there. Your contribution makes our data come alive.
Data sources:
- World Bank | Health (1960–2026, retrieved 2026-07-08)
- United Nations | World Population Prospects (1950–2026, retrieved 2026-07-08)
- U.S. Census Bureau (1960–2025, retrieved 2026-07-08)
- Central Intelligence Agency (CIA) (2000–2019, retrieved 2026-07-08)
- LivingCost (2026, retrieved 2026-07-08)
- Wikidata (2019, retrieved 2026-07-08)
- United Nations Economic Commission for Europe (UNECE) (2017, retrieved 2026-07-08)
- Passport Index (2026, retrieved 2026-07-08)
- EduRank (2026, retrieved 2026-07-08)
Creative Commons Attribution (CC BY) — you’re free to copy, share, remix, adapt, and use even commercially as long as you give appropriate credit and clearly indicate if you made changes. Other sources may be subject to different license terms.