The world's average population density is 144.1 people per square mile (calculated as total population divided by the combined land area of 197 countries).
World population density facts
- The least densely populated country is Mongolia, with a population density of 6 people per square mile.
- The most densely populated country is Monaco, with 38.3K people and a population density of 47,293 people per square mile.
- Among countries with a population over 1M, the most densely populated is Singapore, with a population of 6.11M people and a density of 22,183 people per square mile.
- India has a population density of 1,286 people per square mile, compared to 387 in China and 97.3 in the United States.
- The share of the urban population increased from 49.4% in 2005 to 57.8% in 2025.
- 28.4% of the world's population lives in agglomerations of 1M+ people.
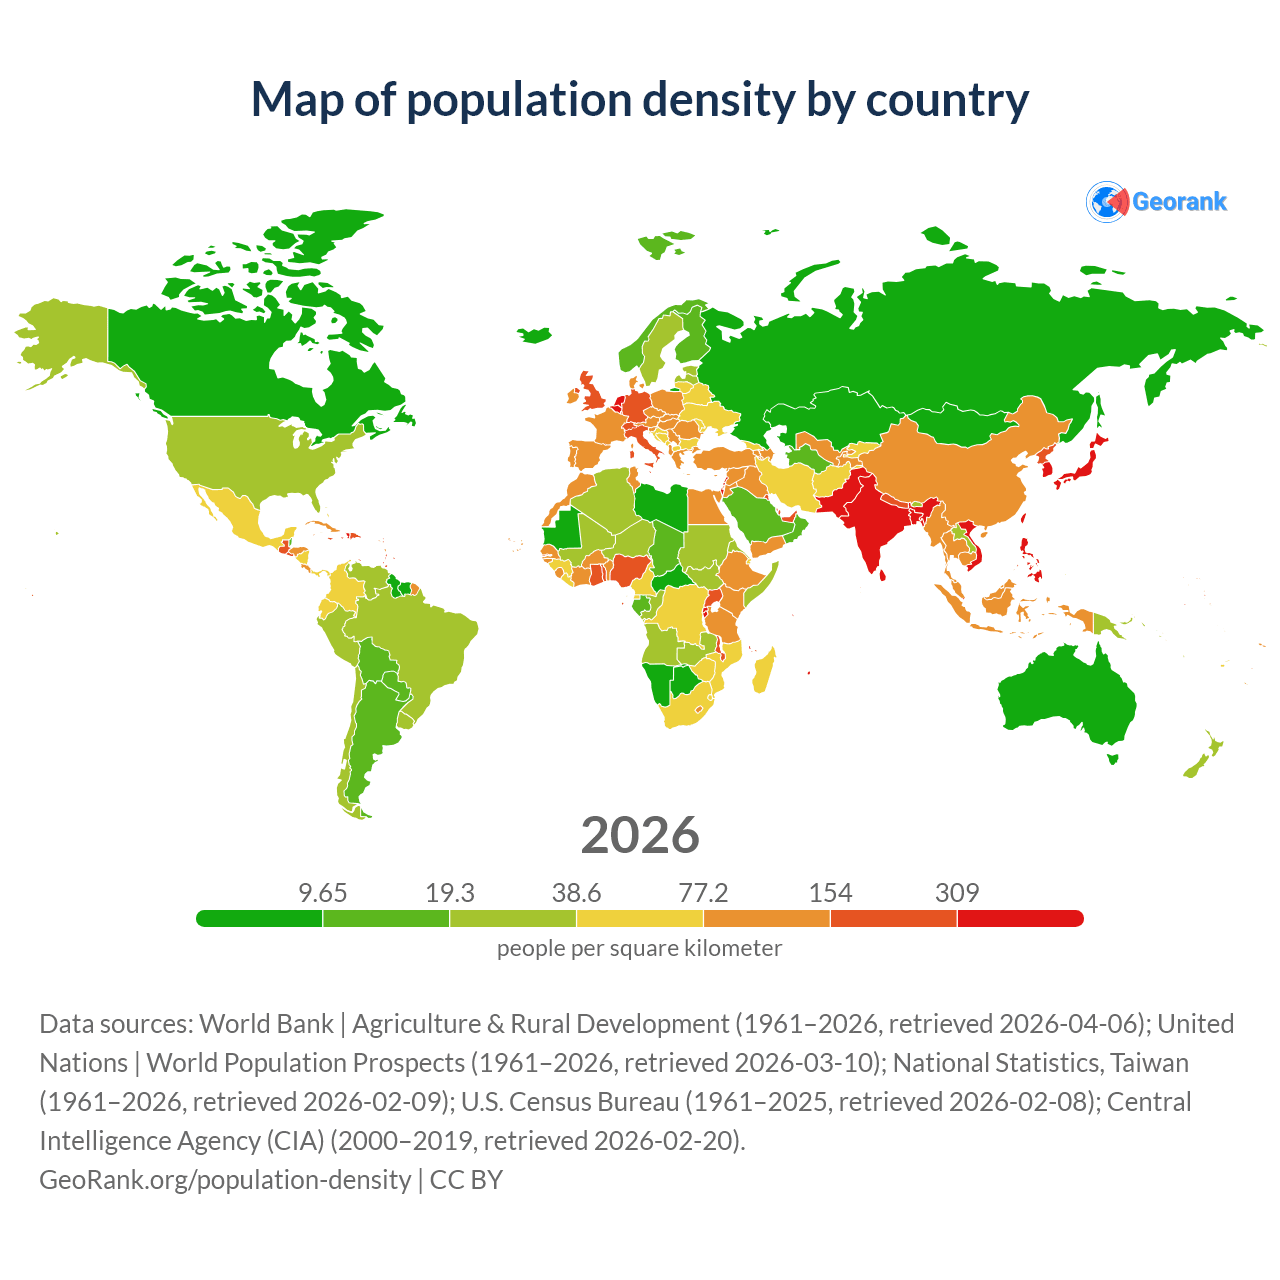
Map of population density by country
Data sources: World Bank | Agriculture & Rural Development (1961–2026, retrieved 2026-07-08); United Nations | World Population Prospects (1961–2026, retrieved 2026-07-08); National Statistics, Taiwan (1961–2026, retrieved 2026-07-08); U.S. Census Bureau (1961–2025, retrieved 2026-07-08); Central Intelligence Agency (CIA) (2000–2019, retrieved 2026-07-08).
GeoRank.org/population-density | CC BY 
This map shows population density from 1961 to 2026 for 197 countries.
List of countries ranked by population density
Population density varies drastically across the globe, even among countries with comparable populations. Bangladesh has a population density of 3,544 people per square mile, while Russia has only 22.6 people per square mile — a 157.1 times difference.
The table below lists 197 countries ranked from the most densely populated (Monaco), to the least densely populated (Mongolia).
| Rank | Country | Density, ppl per sq mi | Population | Land area, mi² | % of world population | % of world land | Urban popul. |
|---|---|---|---|---|---|---|---|
| 1 |
 Monaco
|
47,293 |
38054
|
0.8 | 0.0005% | 0.000001% | 100% |
| 2 |
 Singapore
|
22,183 |
6167445
|
277 | 0.07% | 0.0005% | 100% |
| 3 |
 Vatican
|
5,493 |
939
|
0.17 | 0.00001% | 0.0000003% | n/a |
| 4 |
 Bahrain
|
5,290 |
1649267
|
309 | 0.02% | 0.0005% | 90.9% |
| 5 |
 Malta
Malta
|
4,737 |
586345
|
124 | 0.007% | 0.0002% | 95.7% |
| 6 |
 Maldives
|
4,620 |
532468
|
115 | 0.006% | 0.0002% | 42.5% |
| 7 |
 Bangladesh
|
3,544 |
178936470
|
50.2K | 2.14% | 0.09% | 33.2% |
| 8 |
 Palestine
|
2,368 |
5563879
|
2.33K | 0.07% | 0.004% | 87.4% |
| 9 |
 Barbados
|
1,703 |
282789
|
166 | 0.003% | 0.0003% | 59.7% |
| 10 |
 Taiwan
|
1,662 |
23229461
|
14K | 0.28% | 0.02% | n/a |
| 11 |
 Mauritius
|
1,609 |
1240721
|
771 | 0.02% | 0.001% | 39% |
| 12 |
 Nauru
Nauru
|
1,567 |
12139
|
7.72 | 0.0001% | 0.00001% | 100% |
| 13 |
 Rwanda
|
1,564 |
15062056
|
9.52K | 0.18% | 0.02% | 30.9% |
| 14 |
 Lebanon
|
1,493 |
5921719
|
3.95K | 0.07% | 0.007% | 91% |
| 15 |
 Burundi
|
1,486 |
14909238
|
9.92K | 0.18% | 0.02% | 25.7% |
| 16 |
 San Marino
|
1,474 |
34159
|
23.2 | 0.0004% | 0.00004% | 97.2% |
| 17 |
 Netherlands
|
1,400 |
18243998
|
13K | 0.22% | 0.02% | 95.9% |
| 18 |
 South Korea
|
1,370 |
51624449
|
37.7K | 0.63% | 0.07% | 81.2% |
| 19 |
 India
India
|
1,286 |
1483314140
|
1.15M | 17.9% | 2% | 35.7% |
| 20 |
 Comoros
|
1,251 |
907554
|
719 | 0.01% | 0.001% | 33.9% |
| 21 |
 Israel
|
1,228 |
10334048
|
8.36K | 0.12% | 0.01% | 91.6% |
| 22 |
 Haiti
Haiti
|
1,131 |
12106577
|
10.6K | 0.15% | 0.02% | 55.6% |
| 23 |
 Philippines
|
1,023 |
118213646
|
115K | 1.42% | 0.2% | 55.8% |
| 24 |
 Belgium
|
1,016 |
11967185
|
11.8K | 0.15% | 0.02% | 87.7% |
| 25 |
 Sri Lanka
|
916 |
21926160
|
23.9K | 0.27% | 0.04% | 20.5% |
| 26 |
 Curacao
|
911 |
156236
|
171 | 0.002% | 0.0003% | 91.5% |
| 27 |
 Grenada
|
894 |
117405
|
131 | 0.001% | 0.0002% | 36.7% |
| 28 |
 Japan
Japan
|
872 |
122704252
|
141K | 1.5% | 0.24% | 92.3% |
| 29 |
 Pakistan
|
871 |
261421997
|
298K | 3.11% | 0.52% | 39.5% |
| 30 |
 Vietnam
|
844 |
102486146
|
121K | 1.24% | 0.21% | 38.8% |
| 31 |
 Cayman
|
833 |
77917
|
92.7 | 0.0009% | 0.0002% | 100% |
| 32 |
 Tuvalu
|
807 |
9349
|
11.6 | 0.0001% | 0.00002% | 65.4% |
| 33 |
 El Salvador
|
799 |
6404781
|
8K | 0.08% | 0.01% | 75.5% |
| 34 |
 Saint Lucia
|
766 |
180676
|
236 | 0.002% | 0.0004% | 29.1% |
| 35 |
 UK
UK
|
748 |
70071289
|
93.4K | 0.85% | 0.16% | 83.3% |
| 36 |
 Gambia
|
738 |
2916990
|
3.91K | 0.03% | 0.007% | 65% |
| 37 |
 Kuwait
|
719 |
4981316
|
6.88K | 0.06% | 0.01% | 100% |
| 38 |
 Seychelles
|
703 |
125859
|
178 | 0.001% | 0.0003% | 45.5% |
| 39 |
 Luxembourg
|
698 |
697802
|
994 | 0.008% | 0.002% | 94.9% |
| 40 |
 Trinidad
|
692 |
1370916
|
1.98K | 0.02% | 0.003% | 54% |
| 41 |
 Nigeria
|
689 |
245016045
|
352K | 2.9% | 0.61% | 63.8% |
| 42 |
 Qatar
Qatar
|
684 |
3058826
|
4.44K | 0.04% | 0.008% | 99.4% |
| 43 |
 Uganda
|
682 |
53495325
|
77.4K | 0.63% | 0.13% | 31.9% |
| 44 |
 Jamaica
|
678 |
2834177
|
4.18K | 0.03% | 0.007% | 59.4% |
| 45 |
 Liechtenstein
|
668 |
41400
|
61.8 | 0.0005% | 0.0001% | 14.6% |
| 46 |
 Sao Tome
|
661 |
247495
|
371 | 0.003% | 0.0006% | 69.2% |
| 47 |
 Saint Vincent
|
659 |
99243
|
151 | 0.001% | 0.0003% | 48% |
| 48 |
 Malawi
|
626 |
23086106
|
36.4K | 0.27% | 0.06% | 17.6% |
| 49 |
 Dominican
|
624 |
11656588
|
18.6K | 0.14% | 0.03% | 72.5% |
| 50 |
 Germany
|
614 |
82830814
|
135K | 1.02% | 0.23% | 82.1% |
| 51 |
 Switzerland
|
599 |
9155878
|
15.3K | 0.11% | 0.03% | 85.7% |
| 52 |
 North Korea
|
573 |
26668308
|
46.5K | 0.32% | 0.08% | 64.2% |
| 53 |
 Antigua
|
557 |
94846
|
170 | 0.001% | 0.0003% | 24.3% |
| 54 |
 Nepal
Nepal
|
535 |
29619950
|
55.3K | 0.36% | 0.1% | 67% |
| 55 |
 Italy
Italy
|
514 |
58708169
|
114K | 0.72% | 0.2% | 69.7% |
| 56 |
 Marshall
|
504 |
35039
|
69.5 | 0.0004% | 0.0001% | 79.1% |
| 57 |
 Saint Kitts
|
468 |
47031
|
100 | 0.0006% | 0.0002% | 31.9% |
| 58 |
 Andorra
|
462 |
84217
|
182 | 0.001% | 0.0003% | 88.9% |
| 59 |
 Guatemala
|
459 |
19115361
|
41.4K | 0.23% | 0.07% | 56.3% |
| 60 |
 Kiribati
|
443 |
139471
|
313 | 0.002% | 0.0005% | 63.4% |
| 61 |
 UAE
UAE
|
430 |
11885001
|
27.4K | 0.14% | 0.05% | 86% |
| 62 |
 Togo
Togo
|
418 |
8873660
|
21K | 0.1% | 0.04% | 44.4% |
| 63 |
 Ghana
Ghana
|
406 |
36032857
|
87.9K | 0.43% | 0.15% | 58.9% |
| 64 |
 Indonesia
|
394 |
289027659
|
731K | 3.48% | 1.27% | 59.4% |
| 65 |
 Denmark
|
391 |
6042125
|
15.4K | 0.07% | 0.03% | 88.8% |
| 66 |
 Cyprus
|
388 |
1388591
|
3.57K | 0.02% | 0.006% | 66.7% |
| 67 |
 China
China
|
387 |
1403335670
|
3.62M | 17.2% | 6.3% | 66.3% |
| 68 |
 Syria
Syria
|
374 |
26956472
|
70.9K | 0.31% | 0.12% | 72.1% |
| 69 |
 Tonga
Tonga
|
372 |
103283
|
278 | 0.001% | 0.0005% | 21.2% |
| 70 |
 Thailand
|
363 |
71565981
|
197K | 0.87% | 0.34% | 62.8% |
| 71 |
 Czechia
|
361 |
10742283
|
29.8K | 0.13% | 0.05% | 72.9% |
| 72 |
 Benin
Benin
|
348 |
15358725
|
43.5K | 0.18% | 0.08% | 53.4% |
| 73 |
 Cape Verde
|
340 |
530853
|
1.56K | 0.006% | 0.003% | 77.6% |
| 74 |
 Jordan
|
333 |
11538682
|
34.3K | 0.14% | 0.06% | 93.2% |
| 75 |
 France
|
331 |
68871753
|
208K | 0.84% | 0.36% | 78.8% |
| 76 |
 Azerbaijan
|
323 |
10333222
|
31.9K | 0.12% | 0.06% | 58.6% |
| 77 |
 Sierra Leone
|
323 |
9090531
|
27.9K | 0.11% | 0.05% | 45.9% |
| 78 |
 Ethiopia
|
319 |
140722974
|
436K | 1.65% | 0.76% | 24.1% |
| 79 |
 Egypt
Egypt
|
313 |
121012163
|
384K | 1.44% | 0.67% | 42.9% |
| 80 |
 Portugal
|
305 |
10788071
|
35.4K | 0.13% | 0.06% | 61.5% |
| 81 |
 Poland
|
304 |
36007074
|
118K | 0.44% | 0.21% | 60.1% |
| 82 |
 Turkey
|
289.7 |
86225430
|
297K | 1.05% | 0.52% | 89.5% |
| 83 |
 Slovakia
|
289.6 |
5376239
|
18.6K | 0.07% | 0.03% | 53.2% |
| 84 |
 Austria
|
288.8 |
9201502
|
31.9K | 0.11% | 0.06% | 69.7% |
| 85 |
 Malaysia
|
286.9 |
36600906
|
127K | 0.44% | 0.22% | 77.4% |
| 86 |
 Iraq
Iraq
|
286.5 |
48531417
|
168K | 0.57% | 0.29% | 69.9% |
| 87 |
 Armenia
|
281.4 |
3064036
|
10.9K | 0.04% | 0.02% | 65.9% |
| 88 |
 Slovenia
|
273.8 |
2128778
|
7.77K | 0.03% | 0.01% | 56% |
| 89 |
 Ivory Coast
|
272.9 |
33910252
|
123K | 0.4% | 0.21% | 54.5% |
| 90 |
 Cuba
Cuba
|
271.8 |
10893750
|
40.1K | 0.13% | 0.07% | 77.2% |
| 91 |
 Hungary
|
268.3 |
9454659
|
35.2K | 0.12% | 0.06% | 70.7% |
| 92 |
 Cambodia
|
264.9 |
18159213
|
68.2K | 0.22% | 0.12% | 41.1% |
| 93 |
 Costa Rica
|
262.5 |
5186356
|
19.7K | 0.06% | 0.03% | 79.7% |
| 94 |
 Kenya
Kenya
|
261.5 |
59218766
|
224K | 0.7% | 0.39% | 32.2% |
| 95 |
 Senegal
|
260.6 |
19596169
|
74.3K | 0.23% | 0.13% | 55.8% |
| 96 |
 Honduras
|
259 |
11279259
|
43.2K | 0.13% | 0.08% | 59.3% |
| 97 |
 Spain
Spain
|
255.7 |
49323658
|
193K | 0.6% | 0.34% | 80.5% |
| 98 |
 East Timor
|
250.2 |
1446322
|
5.74K | 0.02% | 0.01% | 28.8% |
| 99 |
 Burkina Faso
|
232.9 |
24880655
|
106K | 0.29% | 0.18% | 28.9% |
| 100 |
 Brunei
|
230.9 |
471596
|
2.04K | 0.006% | 0.004% | 75% |
| 101 |
 Dominica
|
226.2 |
65501
|
290 | 0.0008% | 0.0005% | 74% |
| 102 |
 Morocco
|
225 |
38938817
|
172K | 0.47% | 0.3% | 63.1% |
| 103 |
 Uzbekistan
|
221.8 |
38082870
|
170K | 0.45% | 0.3% | 51% |
| 104 |
 Albania
|
220.4 |
2332078
|
10.6K | 0.03% | 0.02% | 58.9% |
| 105 |
 Myanmar
|
219 |
55361818
|
252K | 0.67% | 0.44% | 30.6% |
| 106 |
 Romania
|
212.9 |
18912567
|
88.8K | 0.23% | 0.15% | 52.2% |
| 107 |
 Tanzania
|
212.2 |
73639263
|
342K | 0.86% | 0.59% | 36.9% |
| 108 |
 Guinea-Bissau
|
211.7 |
2323460
|
10.9K | 0.03% | 0.02% | 46.7% |
| 109 |
 Yemen
Yemen
|
210.8 |
43598646
|
204K | 0.51% | 0.35% | 37% |
| 110 |
 Greece
|
208.4 |
10371575
|
49.8K | 0.13% | 0.09% | 79.2% |
| 111 |
 Ireland
|
208.2 |
5562212
|
26.6K | 0.07% | 0.05% | 64.6% |
| 112 |
 Tunisia
|
207 |
12450912
|
60K | 0.15% | 0.1% | 70.7% |
| 113 |
 Samoa
Samoa
|
205.5 |
221158
|
1.07K | 0.003% | 0.002% | 17.5% |
| 114 |
 Tajikistan
|
204.9 |
11080415
|
53.6K | 0.13% | 0.09% | 26.2% |
| 115 |
 Lesotho
|
203.8 |
2402837
|
11.7K | 0.03% | 0.02% | 44.7% |
| 116 |
 Serbia
|
200.2 |
6500256
|
32.5K | 0.08% | 0.06% | 62.6% |
| 117 |
 Ecuador
|
192.3 |
18524711
|
95.9K | 0.22% | 0.17% | 63.4% |
| 118 |
 Eswatini
|
191.2 |
1276995
|
6.64K | 0.02% | 0.01% | 26.7% |
| 119 |
 N. Macedonia
|
186 |
1811466
|
9.74K | 0.02% | 0.02% | 62.9% |
| 120 |
 Eq. Guinea
|
183.3 |
2008950
|
10.8K | 0.02% | 0.02% | 71.6% |
| 121 |
 Moldova
|
183.1 |
2328600
|
12.7K | 0.03% | 0.02% | 43.7% |
| 122 |
 Ukraine
|
180.6 |
40408451
|
224K | 0.48% | 0.39% | 69.6% |
| 123 |
 Afghanistan
|
178.9 |
45682388
|
252K | 0.53% | 0.44% | 25.9% |
| 124 |
 Croatia
|
178.2 |
3849788
|
21.6K | 0.05% | 0.04% | 57.8% |
| 125 |
 Mexico
|
177.2 |
133551566
|
751K | 1.61% | 1.31% | 80% |
| 126 |
 Cameroon
|
167.9 |
31045453
|
183K | 0.36% | 0.32% | 55.7% |
| 127 |
 Guinea
|
162.8 |
15624314
|
94.9K | 0.18% | 0.16% | 38.5% |
| 128 |
 Panama
|
161.5 |
4654479
|
28.6K | 0.06% | 0.05% | 66.2% |
| 129 |
 Bosnia
|
157.6 |
3114736
|
19.8K | 0.04% | 0.03% | 52.7% |
| 130 |
 Liberia
|
157.3 |
5916561
|
37.2K | 0.07% | 0.06% | 56.1% |
| 131 |
 Nicaragua
|
152.8 |
7144725
|
46.5K | 0.09% | 0.08% | 59.4% |
| 132 |
 Bulgaria
|
152.5 |
6390149
|
41.9K | 0.08% | 0.07% | 74.2% |
| 133 |
 Madagascar
|
149.3 |
33936132
|
225K | 0.4% | 0.39% | 32.9% |
| 134 |
 Iran
Iran
|
148.8 |
93580141
|
626K | 1.13% | 1.09% | 77.4% |
| 135 |
 Georgia
|
146.6 |
3934050
|
26.8K | 0.05% | 0.05% | 61.2% |
| 136 |
 South Africa
|
139.8 |
65829368
|
468K | 0.79% | 0.81% | 63.8% |
| 137 |
 Djibouti
|
134 |
1207325
|
8.95K | 0.01% | 0.02% | 73% |
| 138 |
 DR Congo
|
133.1 |
118386491
|
875K | 1.38% | 1.52% | 45.1% |
| 139 |
 Fiji
Fiji
|
132.9 |
939479
|
7.05K | 0.01% | 0.01% | 59.5% |
| 140 |
 Colombia
|
125.9 |
54209462
|
428K | 0.65% | 0.74% | 78.8% |
| 141 |
 Mozambique
|
120.7 |
37173146
|
304K | 0.43% | 0.53% | 37.2% |
| 142 |
 Montenegro
|
118.2 |
613759
|
5.19K | 0.008% | 0.009% | 65.6% |
| 143 |
 Lithuania
|
117.7 |
2845693
|
24.2K | 0.04% | 0.04% | 69.1% |
| 144 |
 Zimbabwe
|
115.7 |
17443108
|
149K | 0.21% | 0.26% | 40.5% |
| 145 |
 Belarus
|
115.2 |
9025821
|
78.4K | 0.11% | 0.14% | 79.5% |
| 146 |
 Bahamas
|
104.7 |
405486
|
3.86K | 0.005% | 0.007% | 81.3% |
| 147 |
 Kyrgyzstan
|
100.6 |
7505771
|
74.1K | 0.09% | 0.13% | 34.7% |
| 148 |
 Palau
Palau
|
99.2 |
17620
|
178 | 0.0002% | 0.0003% | 79.3% |
| 149 |
 United States
|
97.3 |
344434632
|
3.53M | 4.17% | 6.14% | 80.2% |
| 150 |
 Laos
Laos
|
89.5 |
8027464
|
89.1K | 0.1% | 0.15% | 40.3% |
| 151 |
 Venezuela
|
84.1 |
28692435
|
341K | 0.35% | 0.59% | 89.3% |
| 152 |
 Somalia
|
83.9 |
20653532
|
242K | 0.24% | 0.42% | 55.1% |
| 153 |
 Angola
|
83.6 |
40839390
|
481K | 0.48% | 0.84% | 71.5% |
| 154 |
 Estonia
|
81.6 |
1347027
|
16.5K | 0.02% | 0.03% | 70.7% |
| 155 |
 Solomon
|
79.4 |
868694
|
10.8K | 0.01% | 0.02% | 31.3% |
| 156 |
 Eritrea
|
78.7 |
3722489
|
46.8K | 0.04% | 0.08% | 34.5% |
| 157 |
 Zambia
|
78.5 |
22844606
|
287K | 0.27% | 0.5% | 45.9% |
| 158 |
 Latvia
|
76 |
1826986
|
24K | 0.02% | 0.04% | 68.6% |
| 159 |
 Sudan
Sudan
|
73.9 |
54156832
|
721K | 0.63% | 1.25% | 34.9% |
| 160 |
 Vanuatu
|
72.8 |
346488
|
4.71K | 0.004% | 0.008% | 22.3% |
| 161 |
 Peru
Peru
|
70.7 |
35105331
|
494K | 0.42% | 0.86% | 85.6% |
| 162 |
 Chile
Chile
|
69.6 |
19992079
|
287K | 0.24% | 0.5% | 89.2% |
| 163 |
 Sweden
|
67.7 |
10665077
|
157K | 0.13% | 0.27% | 89.1% |
| 164 |
 Brazil
|
66.2 |
213964342
|
3.23M | 2.6% | 5.61% | 88.2% |
| 165 |
 Papua
Papua
|
62.6 |
11045681
|
175K | 0.13% | 0.3% | 15.8% |
| 166 |
 Niger
Niger
|
58.9 |
29294628
|
489K | 0.34% | 0.85% | 18.4% |
| 167 |
 Mali
Mali
|
55.1 |
26322576
|
471K | 0.31% | 0.82% | 32.2% |
| 168 |
 Bhutan
|
54.5 |
805057
|
14.7K | 0.01% | 0.03% | 43.4% |
| 169 |
 New Zealand
|
52.7 |
5380024
|
102K | 0.06% | 0.18% | 84% |
| 170 |
 Algeria
|
52.2 |
48345858
|
920K | 0.58% | 1.6% | 75.8% |
| 171 |
 South Sudan
|
51 |
12565048
|
244K | 0.15% | 0.42% | 21.7% |
| 172 |
 Congo
Congo
|
50.3 |
6718789
|
132K | 0.08% | 0.23% | 64.1% |
| 173 |
 Uruguay
|
50.1 |
3382672
|
67.6K | 0.04% | 0.12% | 95.7% |
| 174 |
 Belize
|
48.7 |
431659
|
8.81K | 0.005% | 0.02% | 41.6% |
| 175 |
 Finland
|
48.1 |
5647947
|
117K | 0.07% | 0.2% | 74.5% |
| 176 |
 Oman
Oman
|
47.6 |
5775345
|
119K | 0.07% | 0.21% | 79.5% |
| 177 |
 Paraguay
|
46.4 |
7138671
|
153K | 0.09% | 0.27% | 70.4% |
| 178 |
 Saudi Arabia
|
45.3 |
37955120
|
830K | 0.45% | 1.44% | 84.6% |
| 179 |
 Chad
Chad
|
44.4 |
21855137
|
486K | 0.26% | 0.85% | 27.6% |
| 180 |
 Argentina
|
43.5 |
46083022
|
1.06M | 0.56% | 1.84% | 92.4% |
| 181 |
 Turkmenistan
|
42.7 |
7800189
|
181K | 0.09% | 0.32% | 47.1% |
| 182 |
 Norway
|
40.2 |
5660666
|
141K | 0.07% | 0.24% | 83.6% |
| 183 |
 Bolivia
|
30.5 |
12837312
|
418K | 0.15% | 0.73% | 71.6% |
| 184 |
 Gabon
Gabon
|
26.6 |
2676097
|
99.5K | 0.03% | 0.17% | 92.1% |
| 185 |
 CAR
CAR
|
23.7 |
5798457
|
241K | 0.07% | 0.42% | 44.6% |
| 186 |
 Russia
|
22.6 |
142643173
|
6.32M | 1.75% | 11% | 75.3% |
| 187 |
 Kazakhstan
|
20.2 |
21211812
|
1.04M | 0.25% | 1.81% | 62.4% |
| 188 |
 Mauritania
|
13.7 |
5539189
|
398K | 0.06% | 0.69% | 61.5% |
| 189 |
 Canada
|
12.4 |
42199836
|
3.39M | 0.51% | 5.9% | 82.9% |
| 190 |
 Botswana
|
11.9 |
2624853
|
219K | 0.03% | 0.38% | 68% |
| 191 |
 Libya
Libya
|
11.1 |
7580693
|
679K | 0.09% | 1.18% | 87.9% |
| 192 |
 Suriname
|
10.4 |
648096
|
62K | 0.008% | 0.11% | 65.8% |
| 193 |
 Guyana
|
10.3 |
843423
|
81.5K | 0.01% | 0.14% | 26.5% |
| 194 |
 Iceland
|
10.2 |
398674
|
38.9K | 0.005% | 0.07% | 94.2% |
| 195 |
 Namibia
|
9.92 |
3185686
|
318K | 0.04% | 0.55% | 50.9% |
| 196 |
 Australia
|
9.39 |
28010980
|
2.97M | 0.34% | 5.16% | 87.7% |
| 197 |
 Mongolia
|
6 |
3630744
|
602K | 0.04% | 1.05% | 71.1% |
Compare countries by 7 more topics
World population density by year
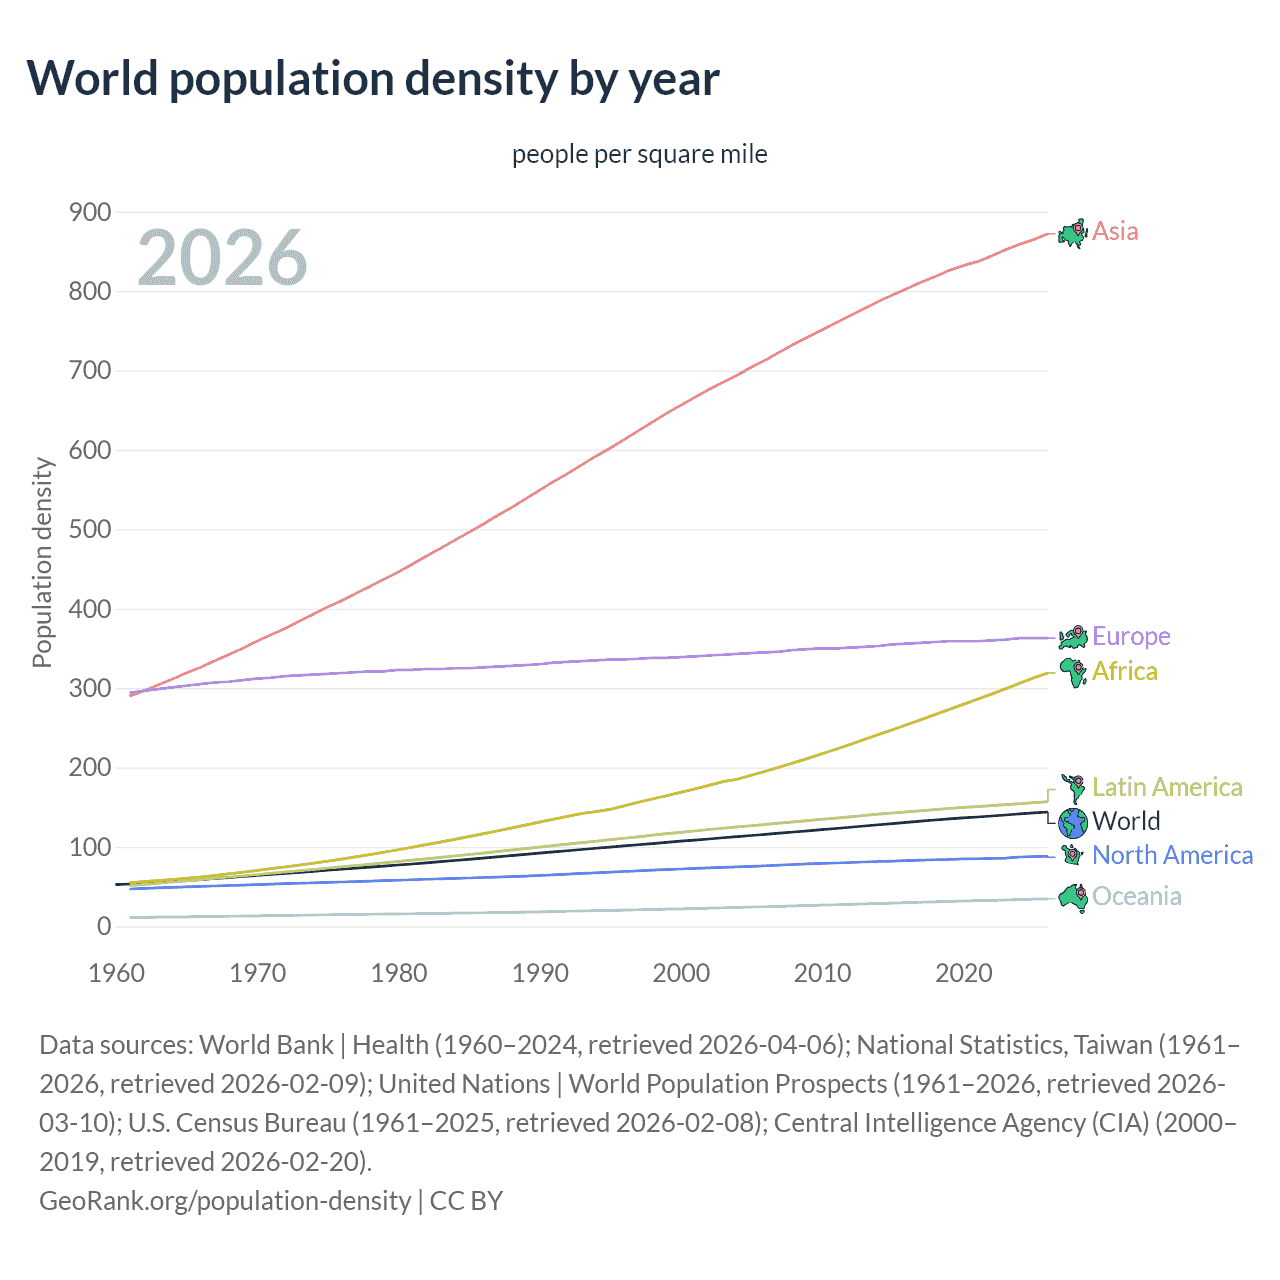
people per square mile
| Year | Population density | ||||||
|---|---|---|---|---|---|---|---|
| World | Asia | Europe | Africa | Latin America | North America | Oceania | |
| 2026 | 144.1 | 873 | 364 | 319 | 157.1 | 88.1 | 34.6 |
| 2025 | 142.9 | 866 | 364 | 312 | 155.9 | 87.6 | 34.2 |
| 2024 | 141.6 | 860 | 363 | 305 | 154.6 | 87.2 | 33.7 |
| 2023 | 140.2 | 853 | 361 | 298.4 | 153.3 | 85.9 | 33.2 |
| 2022 | 138.9 | 845 | 360 | 291.8 | 152.1 | 85.4 | 32.6 |
| 2021 | 137.7 | 838 | 359 | 285.3 | 150.9 | 85 | 32.2 |
| 2020 | 136.6 | 833 | 359 | 278.9 | 149.8 | 84.9 | 31.8 |
| 2019 | 135.2 | 827 | 359 | 272.5 | 148.6 | 84.1 | 31.3 |
| 2018 | 133.8 | 819 | 358 | 266.1 | 147.2 | 83.7 | 30.8 |
| 2017 | 132.4 | 812 | 357 | 259.7 | 145.8 | 83.3 | 30.3 |
| 2016 | 130.9 | 804 | 356 | 253.3 | 144.3 | 82.7 | 29.7 |
| 2015 | 129.4 | 796 | 355 | 247.1 | 142.9 | 82.1 | 29.2 |
| 2014 | 127.9 | 788 | 353 | 241 | 141.3 | 81.5 | 28.6 |
| 2013 | 126.3 | 779 | 352 | 234.8 | 139.8 | 80.9 | 28.1 |
| 2012 | 124.8 | 770 | 351 | 228.7 | 138.1 | 80.4 | 27.6 |
| 2011 | 123.2 | 761 | 350 | 222.7 | 136.4 | 79.8 | 27.1 |
| 2010 | 121.7 | 752 | 350 | 216.8 | 134.9 | 79.2 | 26.6 |
| 2009 | 120.3 | 743 | 349 | 211.1 | 133.3 | 78.5 | 26.1 |
| 2008 | 118.8 | 734 | 348 | 205.5 | 131.7 | 77.9 | 25.6 |
| 2007 | 117.3 | 724 | 346 | 200.1 | 130 | 77 | 25.2 |
| 2006 | 115.8 | 714 | 345 | 194.8 | 128.4 | 76.3 | 24.7 |
| 2005 | 114.3 | 704 | 344 | 189.7 | 126.8 | 75.5 | 24.2 |
| 2004 | 112.9 | 695 | 343 | 184.8 | 125.3 | 74.8 | 23.8 |
| 2003 | 111.5 | 686 | 342 | 181.8 | 123.6 | 74.2 | 23.3 |
| 2002 | 110 | 677 | 341 | 177.1 | 122 | 73.5 | 22.8 |
| 2001 | 108.6 | 667 | 340 | 172.6 | 120.2 | 72.8 | 22.4 |
| 2000 | 107.1 | 656 | 339 | 168.3 | 118.5 | 72.1 | 22 |
| 1999 | 105.7 | 646 | 338 | 164.1 | 116.7 | 71.4 | 21.6 |
| 1998 | 104.2 | 636 | 338 | 160 | 114.9 | 70.6 | 21.2 |
| 1997 | 102.7 | 625 | 337 | 155.9 | 112.8 | 69.8 | 20.8 |
| 1996 | 101.2 | 614 | 336 | 151.3 | 111 | 69 | 20.4 |
| 1995 | 99.7 | 603 | 336 | 146.8 | 109.1 | 68.2 | 20 |
| 1994 | 98.3 | 592 | 335 | 144.1 | 107.3 | 67.4 | 19.6 |
| 1993 | 96.8 | 581 | 334 | 141.8 | 105.5 | 66.6 | 19.3 |
| 1992 | 95.2 | 571 | 333 | 138.2 | 103.6 | 65.7 | 18.9 |
| 1991 | 93.7 | 560 | 332 | 134.5 | 101.7 | 64.8 | 18.6 |
| 1990 | 92.1 | 549 | 330 | 130.8 | 99.8 | 64 | 18.1 |
| 1989 | 90.6 | 538 | 329 | 127.1 | 97.9 | 63.1 | 17.8 |
| 1988 | 89 | 528 | 328 | 123.4 | 96 | 62.5 | 17.6 |
| 1987 | 87.4 | 517 | 327 | 119.7 | 94.1 | 62 | 17.3 |
| 1986 | 85.9 | 507 | 326 | 116.1 | 92.3 | 61.4 | 17.1 |
| 1985 | 84.3 | 496 | 325 | 112.7 | 90.4 | 60.8 | 16.8 |
| 1984 | 82.9 | 486 | 325 | 109.2 | 88.6 | 60.3 | 16.6 |
| 1983 | 81.4 | 476 | 324 | 105.9 | 86.8 | 59.8 | 16.3 |
| 1982 | 80 | 466 | 324 | 102.6 | 85 | 59.2 | 16 |
| 1981 | 78.5 | 456 | 323 | 99.4 | 83.3 | 58.7 | 15.8 |
| 1980 | 77.2 | 446 | 323 | 96.2 | 81.6 | 57.9 | 15.5 |
| 1979 | 75.8 | 437 | 321 | 93 | 79.9 | 57.5 | 15.3 |
| 1978 | 74.5 | 428 | 321 | 90.1 | 78.2 | 56.9 | 15.1 |
| 1977 | 73.2 | 419 | 320 | 87.2 | 76.5 | 56.3 | 15 |
| 1976 | 71.9 | 410 | 319 | 84.4 | 74.8 | 55.8 | 14.7 |
| 1975 | 70.6 | 402 | 318 | 81.8 | 73.1 | 55.2 | 14.5 |
| 1974 | 69.3 | 393 | 317 | 79.3 | 71.5 | 54.7 | 14.3 |
| 1973 | 68 | 384 | 316 | 76.8 | 69.8 | 54.2 | 14 |
| 1972 | 66.7 | 375 | 315 | 74.6 | 68.2 | 53.7 | 13.7 |
| 1971 | 65.4 | 367 | 313 | 72.4 | 66.6 | 53.1 | 13.4 |
| 1970 | 64 | 359 | 312 | 70.1 | 65 | 52.4 | 13.2 |
| 1969 | 62.7 | 350 | 310 | 68 | 63.4 | 51.8 | 12.9 |
| 1968 | 61.4 | 342 | 308 | 65.8 | 61.9 | 51.3 | 12.7 |
| 1967 | 60.1 | 334 | 307 | 63.8 | 60.3 | 50.8 | 12.5 |
| 1966 | 58.9 | 326 | 305 | 62 | 58.8 | 50.2 | 12.2 |
| 1965 | 57.7 | 319 | 303 | 60.3 | 57.3 | 49.7 | 12 |
| 1964 | 56.5 | 311 | 301 | 58.8 | 55.8 | 49 | 11.7 |
| 1963 | 55.4 | 304 | 298.7 | 57.4 | 54.3 | 48.4 | 11.4 |
| 1962 | 54.2 | 296.2 | 296.4 | 56.1 | 52.9 | 47.7 | 11.2 |
| 1961 | 53.3 | 289.9 | 294.2 | 54.7 | 51.5 | 46.9 | 10.9 |
| 1960 | 52.5 | - | - | - | - | - | - |
Data sources: World Bank | Health (1960–2025, retrieved 2026-07-08); National Statistics, Taiwan (1961–2026, retrieved 2026-07-08); United Nations | World Population Prospects (1961–2026, retrieved 2026-07-08); U.S. Census Bureau (1961–2025, retrieved 2026-07-08); Central Intelligence Agency (CIA) (2000–2019, retrieved 2026-07-08).
GeoRank.org/population-density | CC BY
This chart shows world and regional population density from 1960 to 2026. Asia's population density increased 3.01-fold from 289.9 people per square mile in 1960 to 873 people per square mile in 2026, while Europe went from 294.2 to 364.
Africa, Latin America, and North America had comparable population density of 51.5 people per square mile in 1960, close to the world average of 52.5 at the time. By 2026, population density in Africa grew 5.82-fold to 319 people per square mile, Latin America grew 3.05-fold, and North America grew 1.88-fold.
Population density by region
| # Rank | Region | Density, ppl per sq mi | Population | Land area, mi² | Share of population | Share of land | Urban population |
|---|---|---|---|---|---|---|---|
| 1 | Asia | 873 |
4861527384
|
12M | 58.7% | 20.9% | 53.4% |
| 2 | Europe | 364 |
744041683
|
8.54M | 9.08% | 14.9% | 75.5% |
| 3 | Africa | 319 |
1600561986
|
11.5M | 18.9% | 19.9% | 46.4% |
| 4 | Latin America | 157.1 |
669578880
|
7.74M | 8.09% | 13.5% | 81.4% |
| 5 | North America | 88.1 |
386669507
|
6.93M | 4.68% | 12% | 80.5% |
| 6 | Oceania | 34.6 |
47094366
|
3.27M | 0.56% | 5.69% | 68% |
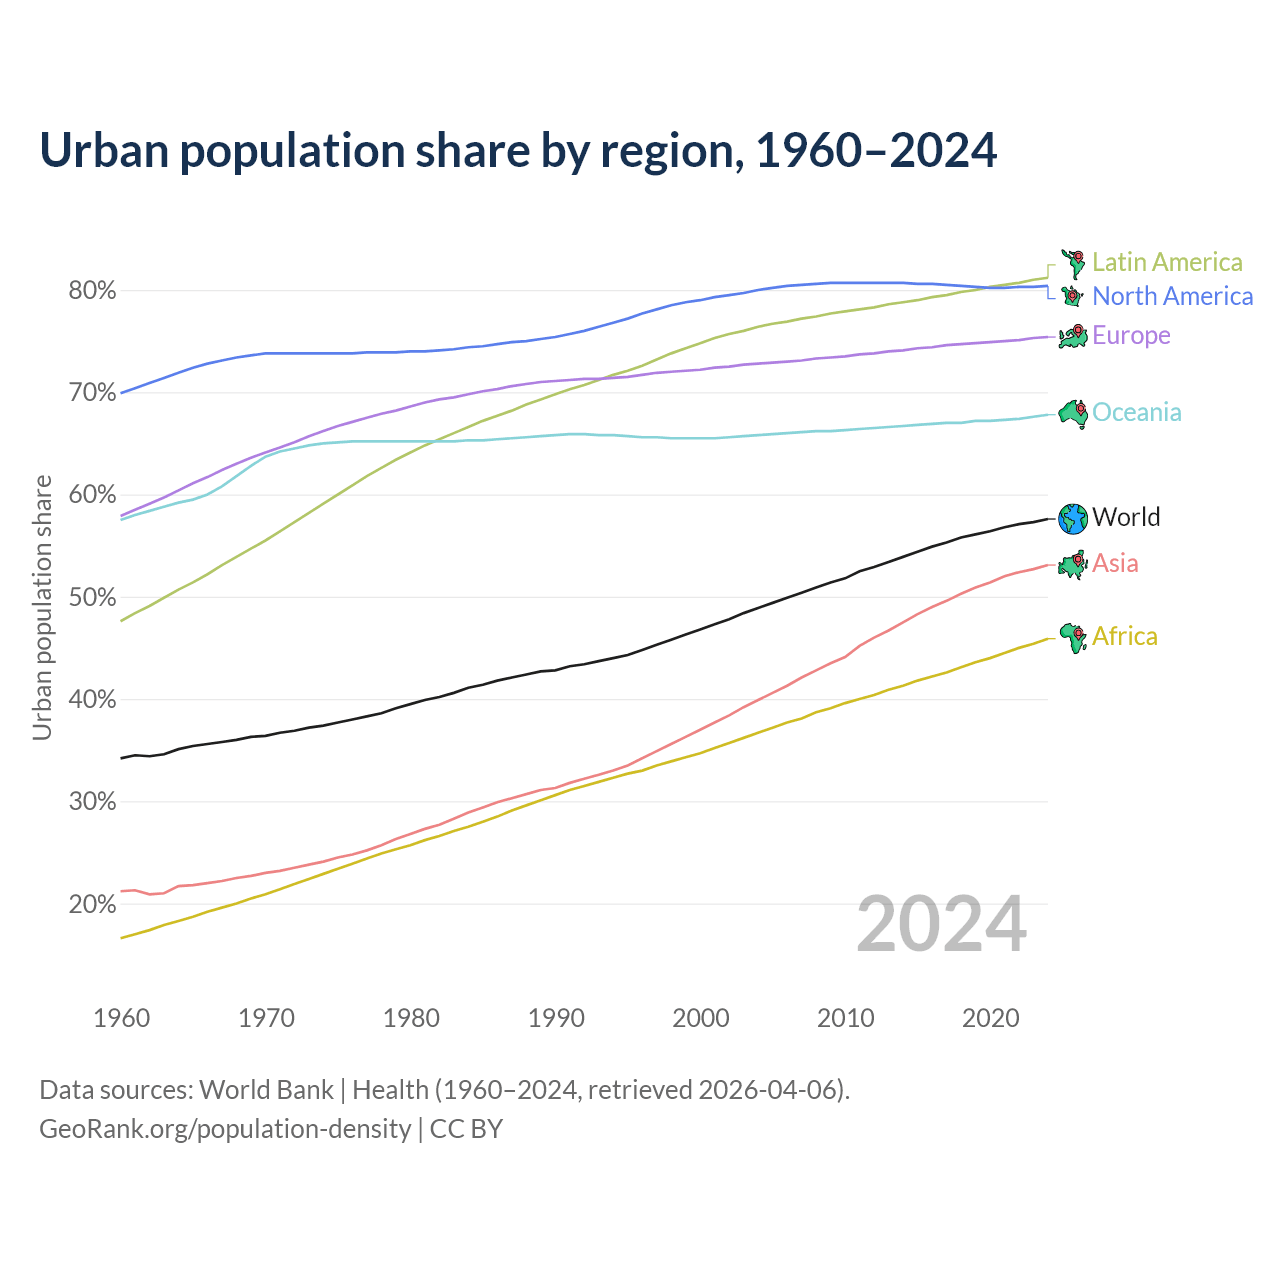
Urban population share by region, 1960–2025
| Year | Urban population share | ||||||
|---|---|---|---|---|---|---|---|
| World | Latin America | North America | Europe | Oceania | Asia | Africa | |
| 2025 | 57.8% | 81.4% | 80.5% | 75.5% | 68% | 53.4% | 46.4% |
| 2024 | 57.6% | 81.2% | 80.4% | 75.4% | 67.8% | 53% | 45.9% |
| 2023 | 57.3% | 80.9% | 80.3% | 75.3% | 67.6% | 52.7% | 45.4% |
| 2022 | 57.1% | 80.7% | 80.3% | 75.1% | 67.4% | 52.4% | 44.9% |
| 2021 | 56.8% | 80.5% | 80.2% | 75% | 67.2% | 52% | 44.4% |
| 2020 | 56.4% | 80.2% | 80.2% | 74.9% | 67.2% | 51.4% | 44% |
| 2019 | 56.1% | 80% | 80.3% | 74.8% | 67.1% | 50.9% | 43.5% |
| 2018 | 55.8% | 79.7% | 80.4% | 74.7% | 67% | 50.3% | 43.1% |
| 2017 | 55.3% | 79.5% | 80.5% | 74.6% | 66.9% | 49.6% | 42.6% |
| 2016 | 54.9% | 79.3% | 80.6% | 74.5% | 66.8% | 48.9% | 42.2% |
| 2015 | 54.4% | 79% | 80.6% | 74.3% | 66.7% | 48.2% | 41.7% |
| 2014 | 53.9% | 78.8% | 80.7% | 74.1% | 66.6% | 47.4% | 41.3% |
| 2013 | 53.4% | 78.5% | 80.7% | 74% | 66.5% | 46.7% | 40.8% |
| 2012 | 52.9% | 78.3% | 80.7% | 73.8% | 66.4% | 45.9% | 40.4% |
| 2011 | 52.5% | 78.1% | 80.7% | 73.7% | 66.3% | 45.2% | 39.9% |
| 2010 | 51.8% | 77.9% | 80.7% | 73.5% | 66.3% | 44.1% | 39.5% |
| 2009 | 51.4% | 77.6% | 80.7% | 73.4% | 66.2% | 43.5% | 39.1% |
| 2008 | 50.9% | 77.4% | 80.6% | 73.3% | 66.1% | 42.8% | 38.6% |
| 2007 | 50.4% | 77.1% | 80.5% | 73.2% | 66% | 42.1% | 38.1% |
| 2006 | 49.9% | 76.9% | 80.4% | 73% | 65.9% | 41.3% | 37.6% |
| 2005 | 49.4% | 76.6% | 80.2% | 72.9% | 65.8% | 40.6% | 37.1% |
| 2004 | 48.9% | 76.3% | 80% | 72.8% | 65.7% | 39.9% | 36.6% |
| 2003 | 48.4% | 76% | 79.7% | 72.7% | 65.7% | 39.2% | 36.1% |
| 2002 | 47.8% | 75.6% | 79.5% | 72.5% | 65.6% | 38.4% | 35.6% |
| 2001 | 47.3% | 75.2% | 79.3% | 72.4% | 65.5% | 37.7% | 35.1% |
| 2000 | 46.8% | 74.8% | 79% | 72.2% | 65.4% | 37% | 34.7% |
| 1999 | 46.3% | 74.3% | 78.8% | 72.1% | 65.4% | 36.3% | 34.2% |
| 1998 | 45.8% | 73.7% | 78.5% | 72% | 65.5% | 35.6% | 33.8% |
| 1997 | 45.3% | 73.1% | 78.1% | 71.9% | 65.5% | 34.9% | 33.4% |
| 1996 | 44.8% | 72.6% | 77.7% | 71.7% | 65.6% | 34.2% | 33% |
| 1995 | 44.3% | 72.1% | 77.2% | 71.5% | 65.7% | 33.5% | 32.6% |
| 1994 | 44% | 71.6% | 76.8% | 71.4% | 65.7% | 33.1% | 32.2% |
| 1993 | 43.7% | 71.2% | 76.4% | 71.3% | 65.8% | 32.6% | 31.8% |
| 1992 | 43.4% | 70.7% | 76% | 71.3% | 65.8% | 32.2% | 31.4% |
| 1991 | 43.2% | 70.2% | 75.7% | 71.2% | 65.8% | 31.8% | 31% |
| 1990 | 42.8% | 69.7% | 75.4% | 71.1% | 65.8% | 31.4% | 30.5% |
| 1989 | 42.7% | 69.2% | 75.2% | 71% | 65.7% | 31.1% | 30% |
| 1988 | 42.4% | 68.7% | 75% | 70.8% | 65.6% | 30.8% | 29.5% |
| 1987 | 42.1% | 68.2% | 74.9% | 70.6% | 65.5% | 30.4% | 29% |
| 1986 | 41.8% | 67.7% | 74.7% | 70.3% | 65.4% | 29.9% | 28.5% |
| 1985 | 41.4% | 67.1% | 74.5% | 70.1% | 65.3% | 29.4% | 28% |
| 1984 | 41.1% | 66.6% | 74.4% | 69.8% | 65.2% | 28.9% | 27.5% |
| 1983 | 40.6% | 66% | 74.2% | 69.5% | 65.2% | 28.3% | 27% |
| 1982 | 40.2% | 65.4% | 74.1% | 69.3% | 65.1% | 27.7% | 26.6% |
| 1981 | 39.9% | 64.8% | 74% | 69% | 65.1% | 27.3% | 26.1% |
| 1980 | 39.5% | 64.1% | 74% | 68.6% | 65.1% | 26.8% | 25.7% |
| 1979 | 39.1% | 63.4% | 73.9% | 68.2% | 65.2% | 26.3% | 25.2% |
| 1978 | 38.6% | 62.6% | 73.9% | 67.9% | 65.2% | 25.7% | 24.8% |
| 1977 | 38.3% | 61.8% | 73.9% | 67.5% | 65.2% | 25.2% | 24.3% |
| 1976 | 38% | 60.9% | 73.8% | 67.1% | 65.2% | 24.9% | 23.9% |
| 1975 | 37.7% | 60% | 73.8% | 66.7% | 65.1% | 24.5% | 23.4% |
| 1974 | 37.4% | 59.1% | 73.8% | 66.2% | 64.9% | 24.1% | 22.9% |
| 1973 | 37.2% | 58.1% | 73.8% | 65.7% | 64.7% | 23.9% | 22.4% |
| 1972 | 36.9% | 57.2% | 73.8% | 65.1% | 64.5% | 23.5% | 21.9% |
| 1971 | 36.7% | 56.3% | 73.8% | 64.6% | 64.2% | 23.2% | 21.4% |
| 1970 | 36.4% | 55.5% | 73.8% | 64.1% | 63.7% | 23% | 20.9% |
| 1969 | 36.3% | 54.7% | 73.6% | 63.6% | 62.8% | 22.7% | 20.4% |
| 1968 | 36% | 53.9% | 73.4% | 63% | 61.7% | 22.5% | 20% |
| 1967 | 35.8% | 53% | 73.1% | 62.4% | 60.7% | 22.2% | 19.5% |
| 1966 | 35.6% | 52.2% | 72.8% | 61.7% | 60% | 22% | 19.1% |
| 1965 | 35.4% | 51.4% | 72.4% | 61% | 59.5% | 21.8% | 18.7% |
| 1964 | 35.1% | 50.6% | 71.9% | 60.4% | 59.1% | 21.7% | 18.2% |
| 1963 | 34.6% | 49.9% | 71.4% | 59.7% | 58.8% | 21% | 17.8% |
| 1962 | 34.4% | 49.1% | 70.9% | 59.1% | 58.4% | 20.9% | 17.4% |
| 1961 | 34.5% | 48.4% | 70.4% | 58.5% | 58% | 21.3% | 17% |
| 1960 | 34.2% | 47.6% | 69.9% | 57.9% | 57.5% | 21.2% | 16.6% |
Data sources: World Bank | Health (1960–2025, retrieved 2026-07-08).
GeoRank.org/population-density | CC BY
This chart shows the growth of the urban population share: in 1960, only 34.2% of the world's population lived in urban areas; by 2025, this share increased to 57.8%.
Help us show the world through your eyes
Share a photo of your city and help others discover what it looks like to live there. Your contribution makes our data come alive.
Data sources:
- World Bank | Health (1960–2025, retrieved 2026-07-08)
- United Nations | World Population Prospects (1961–2026, retrieved 2026-07-08)
- National Statistics, Taiwan (1961–2026, retrieved 2026-07-08)
- U.S. Census Bureau (1961–2025, retrieved 2026-07-08)
- Central Intelligence Agency (CIA) (2000–2025, retrieved 2026-07-08)
Creative Commons Attribution (CC BY) — you’re free to copy, share, remix, adapt, and use even commercially as long as you give appropriate credit and clearly indicate if you made changes. Other sources may be subject to different license terms.