Taiwan ranked 22/197 by economy size with a GDP of $802B and 38/197 by GDP per capita at $34,238. Taiwan has $215B in government debt, with a debt-to-GDP ratio of 22.4%.
In 2024, Taiwan made up 0.72% of the world's economy, compared to 0.13% in 1960.
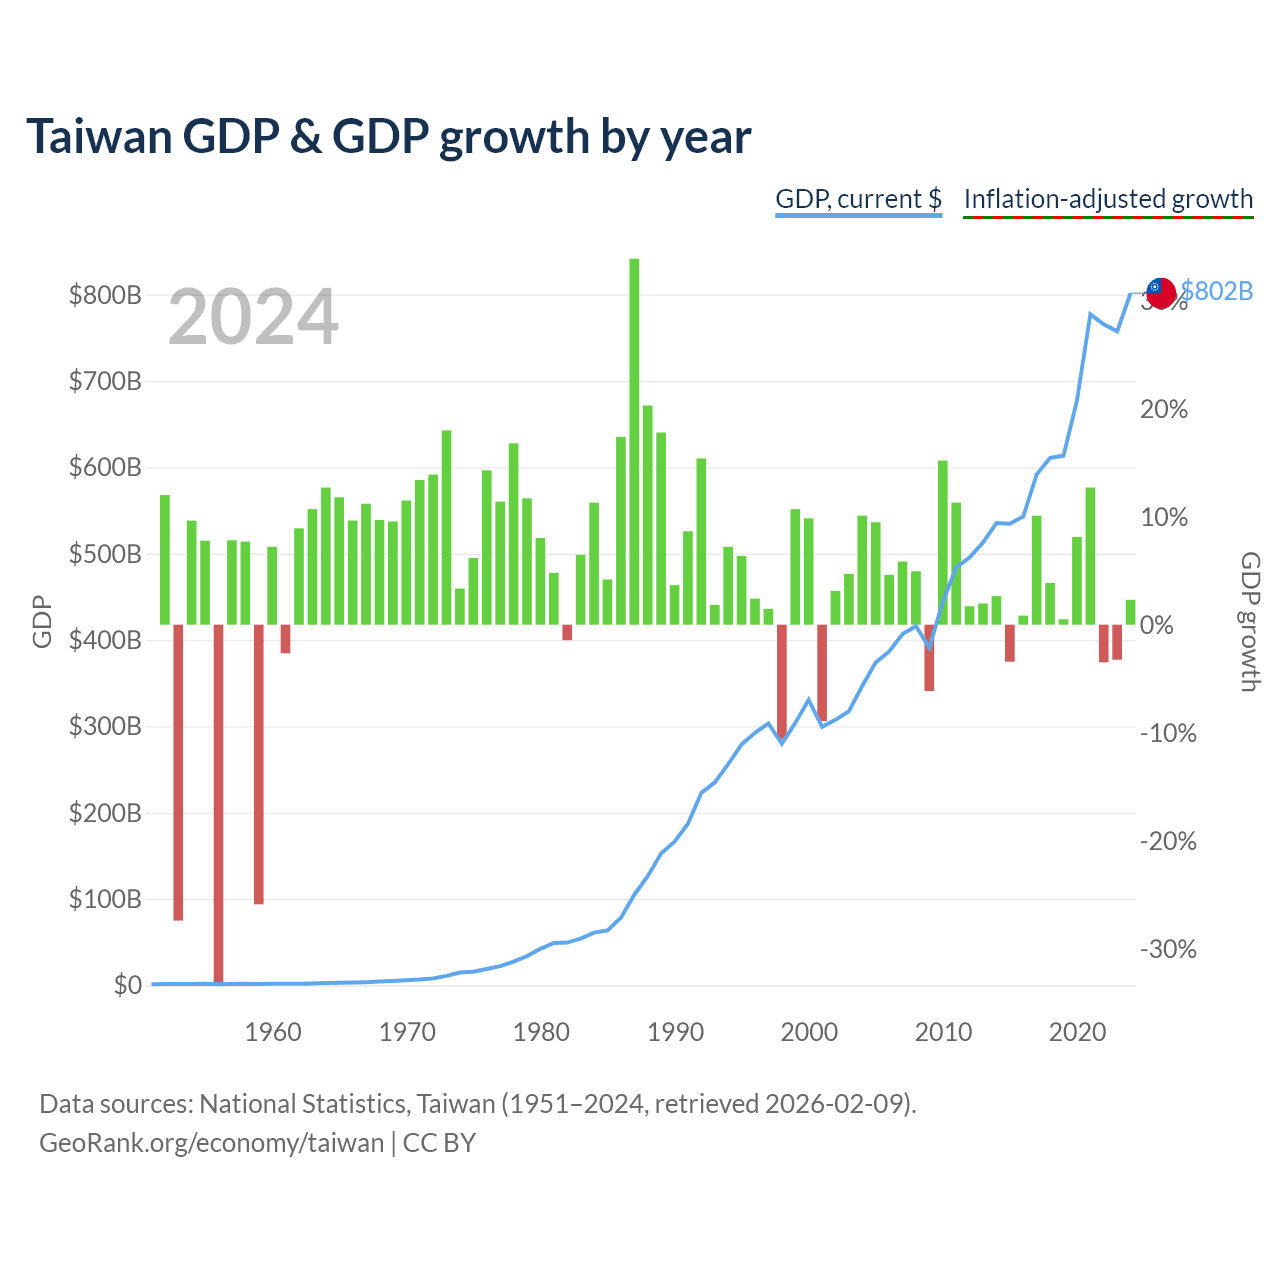
Taiwan GDP & GDP growth by year
| Year | GDP | GDP growth |
|---|---|---|
| 2024 | $801,529,000,000 | 2.16% |
| 2023 | $757,328,000,000 | -3.3% |
| 2022 | $765,529,000,000 | -3.48% |
| 2021 | $777,062,000,000 | 12.7% |
| 2020 | $676,935,000,000 | 8.13% |
| 2019 | $613,453,000,000 | 0.5% |
| 2018 | $610,744,000,000 | 3.86% |
| 2017 | $591,734,000,000 | 10.1% |
| 2016 | $543,002,000,000 | 0.84% |
| 2015 | $534,474,000,000 | -3.43% |
| 2014 | $535,332,000,000 | 2.65% |
| 2013 | $512,957,000,000 | 1.96% |
| 2012 | $495,536,000,000 | 1.71% |
| 2011 | $483,957,000,000 | 11.3% |
| 2010 | $444,245,000,000 | 15.2% |
| 2009 | $390,788,000,000 | -6.14% |
| 2008 | $415,824,000,000 | 4.95% |
| 2007 | $406,940,000,000 | 5.85% |
| 2006 | $386,492,000,000 | 4.62% |
| 2005 | $374,042,000,000 | 9.49% |
| 2004 | $346,881,000,000 | 10.1% |
| 2003 | $317,374,000,000 | 4.71% |
| 2002 | $307,429,000,000 | 3.13% |
| 2001 | $299,303,000,000 | -8.92% |
| 2000 | $330,725,000,000 | 9.85% |
| 1999 | $303,827,000,000 | 10.7% |
| 1998 | $279,926,000,000 | -10.6% |
| 1997 | $303,315,000,000 | 1.47% |
| 1996 | $292,473,000,000 | 2.42% |
| 1995 | $279,013,000,000 | 6.38% |
| 1994 | $256,213,000,000 | 7.22% |
| 1993 | $234,943,000,000 | 1.84% |
| 1992 | $222,947,000,000 | 15.4% |
| 1991 | $187,100,000,000 | 8.65% |
| 1990 | $166,392,000,000 | 3.66% |
| 1989 | $152,687,000,000 | 17.8% |
| 1988 | $126,378,000,000 | 20.3% |
| 1987 | $104,956,000,000 | 33.9% |
| 1986 | $78,347,000,000 | 17.4% |
| 1985 | $63,599,000,000 | 4.19% |
| 1984 | $61,036,000,000 | 11.3% |
| 1983 | $54,155,000,000 | 6.48% |
| 1982 | $49,540,000,000 | -1.44% |
| 1981 | $49,047,000,000 | 4.8% |
| 1980 | $42,292,000,000 | 8.03% |
| 1979 | $33,875,000,000 | 11.7% |
| 1978 | $27,373,000,000 | 16.8% |
| 1977 | $22,252,000,000 | 11.4% |
| 1976 | $18,988,000,000 | 14.3% |
| 1975 | $15,836,000,000 | 6.18% |
| 1974 | $14,739,000,000 | 3.35% |
| 1973 | $10,940,000,000 | 18% |
| 1972 | $8,063,000,000 | 13.9% |
| 1971 | $6,727,000,000 | 13.4% |
| 1970 | $5,785,000,000 | 11.5% |
| 1969 | $5,017,000,000 | 9.56% |
| 1968 | $4,325,000,000 | 9.7% |
| 1967 | $3,709,000,000 | 11.2% |
| 1966 | $3,207,000,000 | 9.65% |
| 1965 | $2,869,000,000 | 11.8% |
| 1964 | $2,592,000,000 | 12.7% |
| 1963 | $2,218,000,000 | 10.7% |
| 1962 | $1,960,000,000 | 8.92% |
| 1961 | $1,778,000,000 | -2.66% |
| 1960 | $1,743,000,000 | 7.22% |
| 1959 | $1,444,000,000 | -25.9% |
| 1958 | $1,836,000,000 | 7.7% |
| 1957 | $1,636,000,000 | 7.82% |
| 1956 | $1,399,000,000 | -33.4% |
| 1955 | $1,940,000,000 | 7.78% |
| 1954 | $1,628,000,000 | 9.64% |
| 1953 | $1,481,000,000 | -27.4% |
| 1952 | $1,677,000,000 | 12% |
| 1951 | $1,197,000,000 | - |
Data sources: National Statistics, Taiwan (1951–2024, retrieved 2026-07-08).
GeoRank.org/economy/taiwan | CC BY 
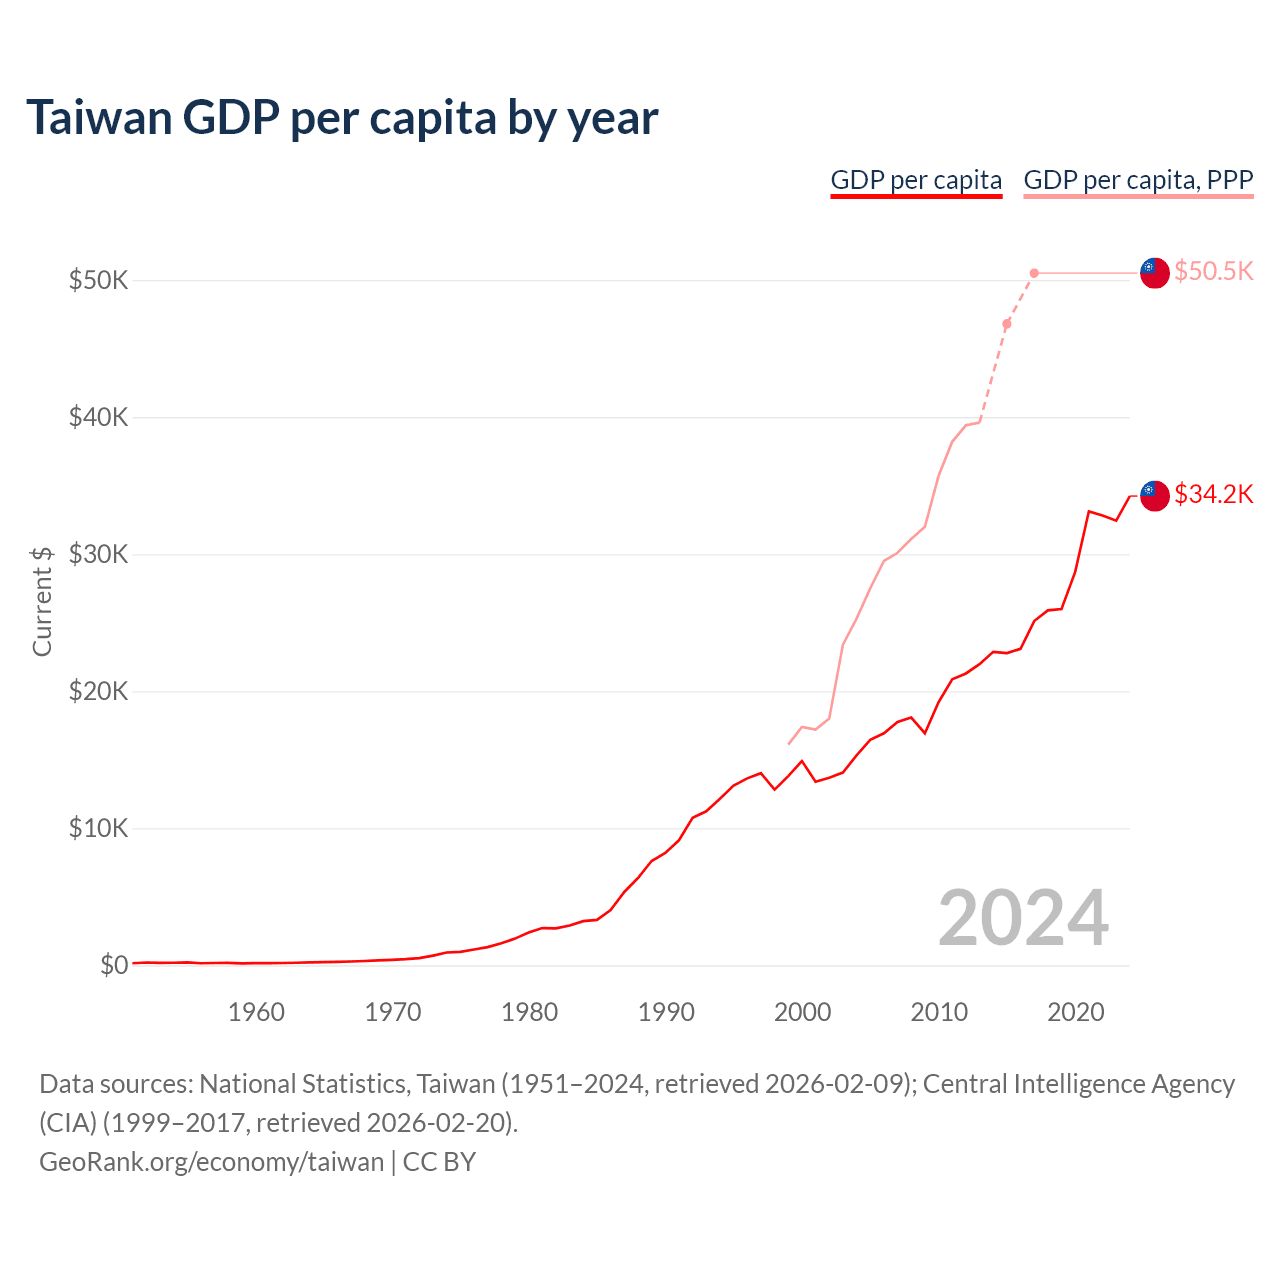
Taiwan GDP per capita by year
| Year | Current $ | |
|---|---|---|
| GDP per capita | GDP per capita, PPP | |
| 2024 | $34,238 | - |
| 2023 | $32,444 | - |
| 2022 | $32,827 | - |
| 2021 | $33,111 | - |
| 2020 | $28,705 | - |
| 2019 | $25,998 | - |
| 2018 | $25,901 | - |
| 2017 | $25,121 | $50,500 |
| 2016 | $23,091 | - |
| 2015 | $22,780 | $46,800 |
| 2014 | $22,874 | - |
| 2013 | $21,973 | $39,600 |
| 2012 | $21,295 | $39,400 |
| 2011 | $20,866 | $38,200 |
| 2010 | $19,197 | $35,700 |
| 2009 | $16,933 | $32,000 |
| 2008 | $18,081 | $31,100 |
| 2007 | $17,757 | $30,100 |
| 2006 | $16,934 | $29,500 |
| 2005 | $16,456 | $27,500 |
| 2004 | $15,317 | $25,300 |
| 2003 | $14,066 | $23,400 |
| 2002 | $13,686 | $18,000 |
| 2001 | $13,397 | $17,200 |
| 2000 | $14,908 | $17,400 |
| 1999 | $13,804 | $16,100 |
| 1998 | $12,820 | - |
| 1997 | $14,020 | - |
| 1996 | $13,641 | - |
| 1995 | $13,119 | - |
| 1994 | $12,150 | - |
| 1993 | $11,242 | - |
| 1992 | $10,768 | - |
| 1991 | $9,125 | - |
| 1990 | $8,205 | - |
| 1989 | $7,613 | - |
| 1988 | $6,370 | - |
| 1987 | $5,350 | - |
| 1986 | $4,036 | - |
| 1985 | $3,314 | - |
| 1984 | $3,224 | - |
| 1983 | $2,903 | - |
| 1982 | $2,699 | - |
| 1981 | $2,720 | - |
| 1980 | $2,389 | - |
| 1979 | $1,950 | - |
| 1978 | $1,606 | - |
| 1977 | $1,330 | - |
| 1976 | $1,158 | - |
| 1975 | $985 | - |
| 1974 | $934 | - |
| 1973 | $706 | - |
| 1972 | $530 | - |
| 1971 | $451 | - |
| 1970 | $397 | - |
| 1969 | $357 | - |
| 1968 | $319 | - |
| 1967 | $280.8 | - |
| 1966 | $249.1 | - |
| 1965 | $229.3 | - |
| 1964 | $213.6 | - |
| 1963 | $188.6 | - |
| 1962 | $172 | - |
| 1961 | $161.2 | - |
| 1960 | $163.4 | - |
| 1959 | $140.4 | - |
| 1958 | $185.1 | - |
| 1957 | $170.5 | - |
| 1956 | $150.6 | - |
| 1955 | $216.3 | - |
| 1954 | $188.3 | - |
| 1953 | $177.7 | - |
| 1952 | $208.4 | - |
| 1951 | $154.3 | - |
Data sources: National Statistics, Taiwan (1951–2024, retrieved 2026-07-08); Central Intelligence Agency (CIA) (1999–2017, retrieved 2026-07-08).
GeoRank.org/economy/taiwan | CC BY
Taiwan has a GDP per capita of $34,238, ranking 38/197, a GDP per capita based on purchasing power parity (PPP) of $50,500, ranking 44/197, and a median annual after tax income of $18,863, ranking 47/197.
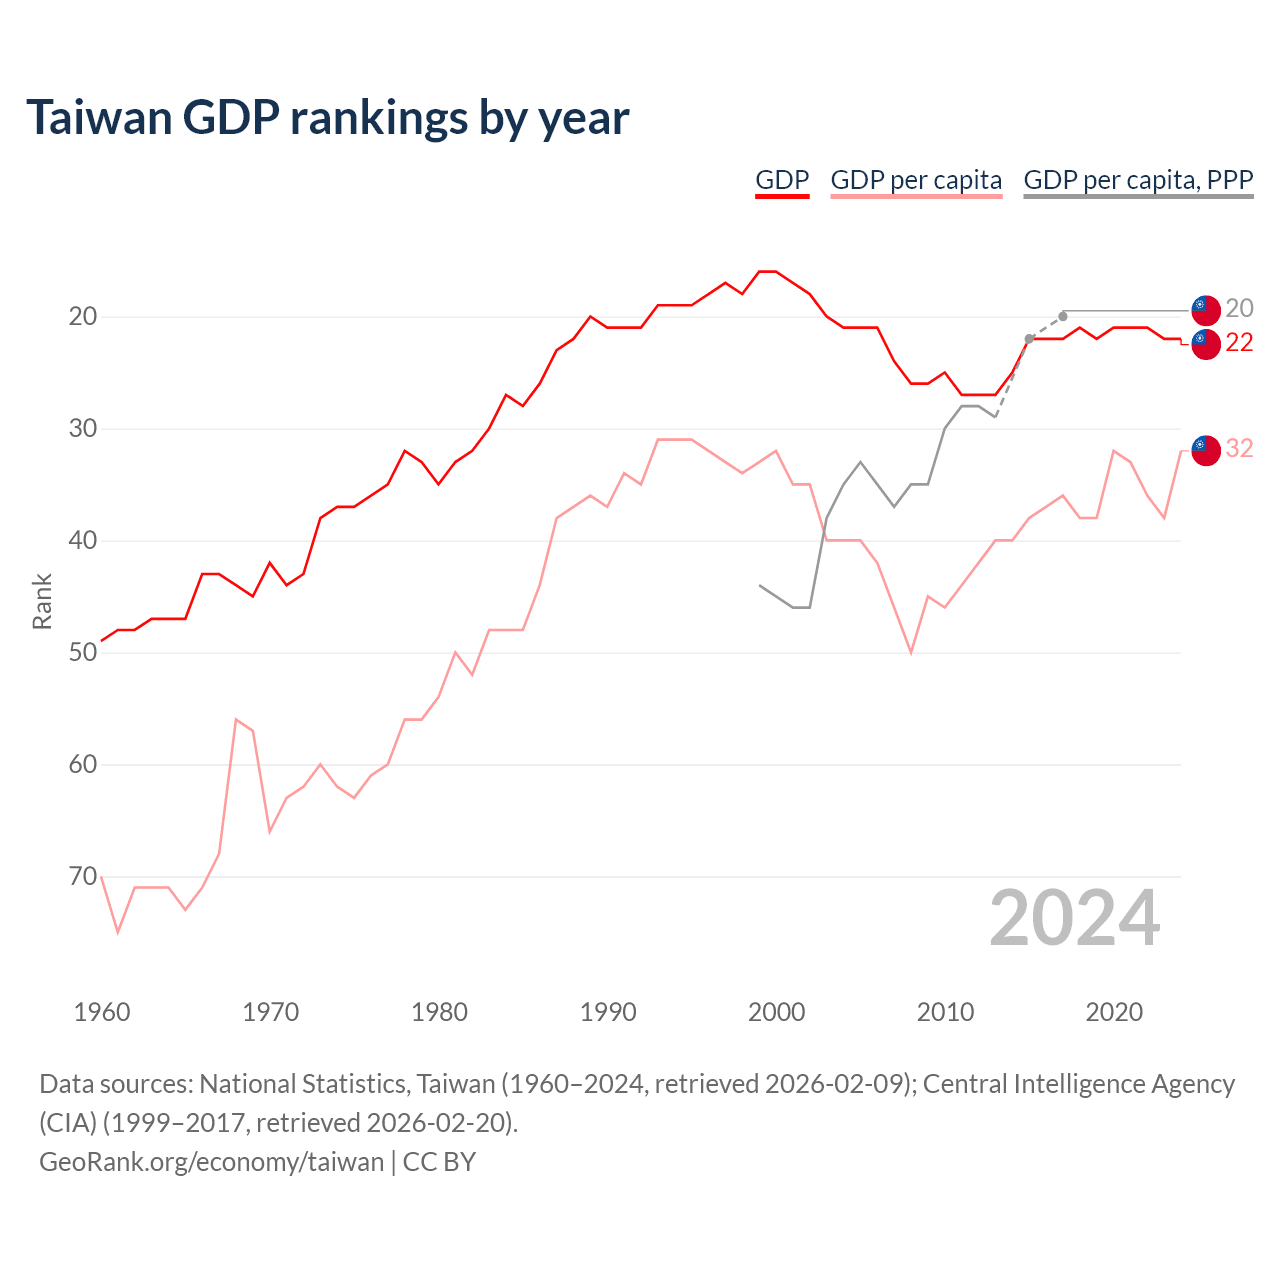
Taiwan GDP rankings by year
| Year | Rank | ||
|---|---|---|---|
| GDP | GDP per capita | GDP per capita, PPP | |
| 2024 | 22 | 34 | - |
| 2023 | 22 | 38 | - |
| 2022 | 21 | 36 | - |
| 2021 | 21 | 33 | - |
| 2020 | 21 | 32 | - |
| 2019 | 22 | 38 | - |
| 2018 | 21 | 38 | - |
| 2017 | 22 | 36 | 20 |
| 2016 | 22 | 37 | - |
| 2015 | 22 | 38 | 22 |
| 2014 | 25 | 40 | - |
| 2013 | 27 | 40 | 29 |
| 2012 | 27 | 42 | 28 |
| 2011 | 27 | 44 | 28 |
| 2010 | 25 | 46 | 30 |
| 2009 | 27 | 45 | 35 |
| 2008 | 26 | 49 | 35 |
| 2007 | 25 | 46 | 37 |
| 2006 | 21 | 42 | 35 |
| 2005 | 21 | 40 | 33 |
| 2004 | 21 | 40 | 35 |
| 2003 | 20 | 40 | 38 |
| 2002 | 18 | 35 | 46 |
| 2001 | 17 | 35 | 46 |
| 2000 | 16 | 32 | 45 |
| 1999 | 16 | 33 | 44 |
| 1998 | 18 | 34 | - |
| 1997 | 17 | 33 | - |
| 1996 | 18 | 32 | - |
| 1995 | 19 | 31 | - |
| 1994 | 19 | 31 | - |
| 1993 | 19 | 31 | - |
| 1992 | 21 | 35 | - |
| 1991 | 21 | 34 | - |
| 1990 | 21 | 37 | - |
| 1989 | 20 | 36 | - |
| 1988 | 22 | 37 | - |
| 1987 | 23 | 38 | - |
| 1986 | 26 | 44 | - |
| 1985 | 28 | 48 | - |
| 1984 | 27 | 48 | - |
| 1983 | 30 | 48 | - |
| 1982 | 32 | 52 | - |
| 1981 | 33 | 50 | - |
| 1980 | 35 | 54 | - |
| 1979 | 33 | 56 | - |
| 1978 | 32 | 56 | - |
| 1977 | 35 | 60 | - |
| 1976 | 36 | 61 | - |
| 1975 | 37 | 63 | - |
| 1974 | 37 | 62 | - |
| 1973 | 38 | 60 | - |
| 1972 | 43 | 62 | - |
| 1971 | 44 | 63 | - |
| 1970 | 42 | 66 | - |
| 1969 | 45 | 57 | - |
| 1968 | 44 | 56 | - |
| 1967 | 43 | 68 | - |
| 1966 | 43 | 71 | - |
| 1965 | 47 | 73 | - |
| 1964 | 47 | 71 | - |
| 1963 | 47 | 71 | - |
| 1962 | 48 | 71 | - |
| 1961 | 48 | 75 | - |
| 1960 | 49 | 70 | - |
Data sources: National Statistics, Taiwan (1960–2024, retrieved 2026-07-08); Central Intelligence Agency (CIA) (1999–2017, retrieved 2026-07-08).
GeoRank.org/economy/taiwan | CC BY
Compared with 2000, in 2024 Taiwan is ranked 22nd out of 189 by GDP (down from 16th), 34th by GDP per capita (down from 32nd), and 20th by GDP per capita PPP (up from 45th).
Economic indicators
 Taiwan
|
Rank | |
|---|---|---|
| Gross domestic product |
$802B
2024 |
22/197 |
| GDP growth |
2.16%
2023-2024 |
132/194 |
| GDP per capita |
$34,238
2024 |
38/197 |
| GDP per capita, PPP |
$50,500
2017 |
44/197 |
| Government debt |
$215B
2024 |
43/185 |
| Debt-to-GDP ratio |
22.4%
2025 |
170/185 |
| Government debt per person |
$9,170
2024 |
64/185 |
| Average annual personal income after taxes |
$18,863
2026 |
47/197 |
| Number of millionaires |
772,000
2026 |
15/40 |
| Millionaire frequency |
1 in 25
2026 |
15/40 |
| Number of billionaires |
66
2026 |
9/74 |
| Billionaire frequency |
1 in 298,057
2026 |
12/74 |
| Government expenditure, % of GDP |
15.8%
2024 |
180/195 |
| Consumer prices inflation |
1.7%
2024-2025 |
139/195 |
| Central bank interest rate |
2%
2024 |
97/106 |
| Unemployment rate |
3.35%
2025 |
144/196 |
| Population |
23229461
|
60/197 |
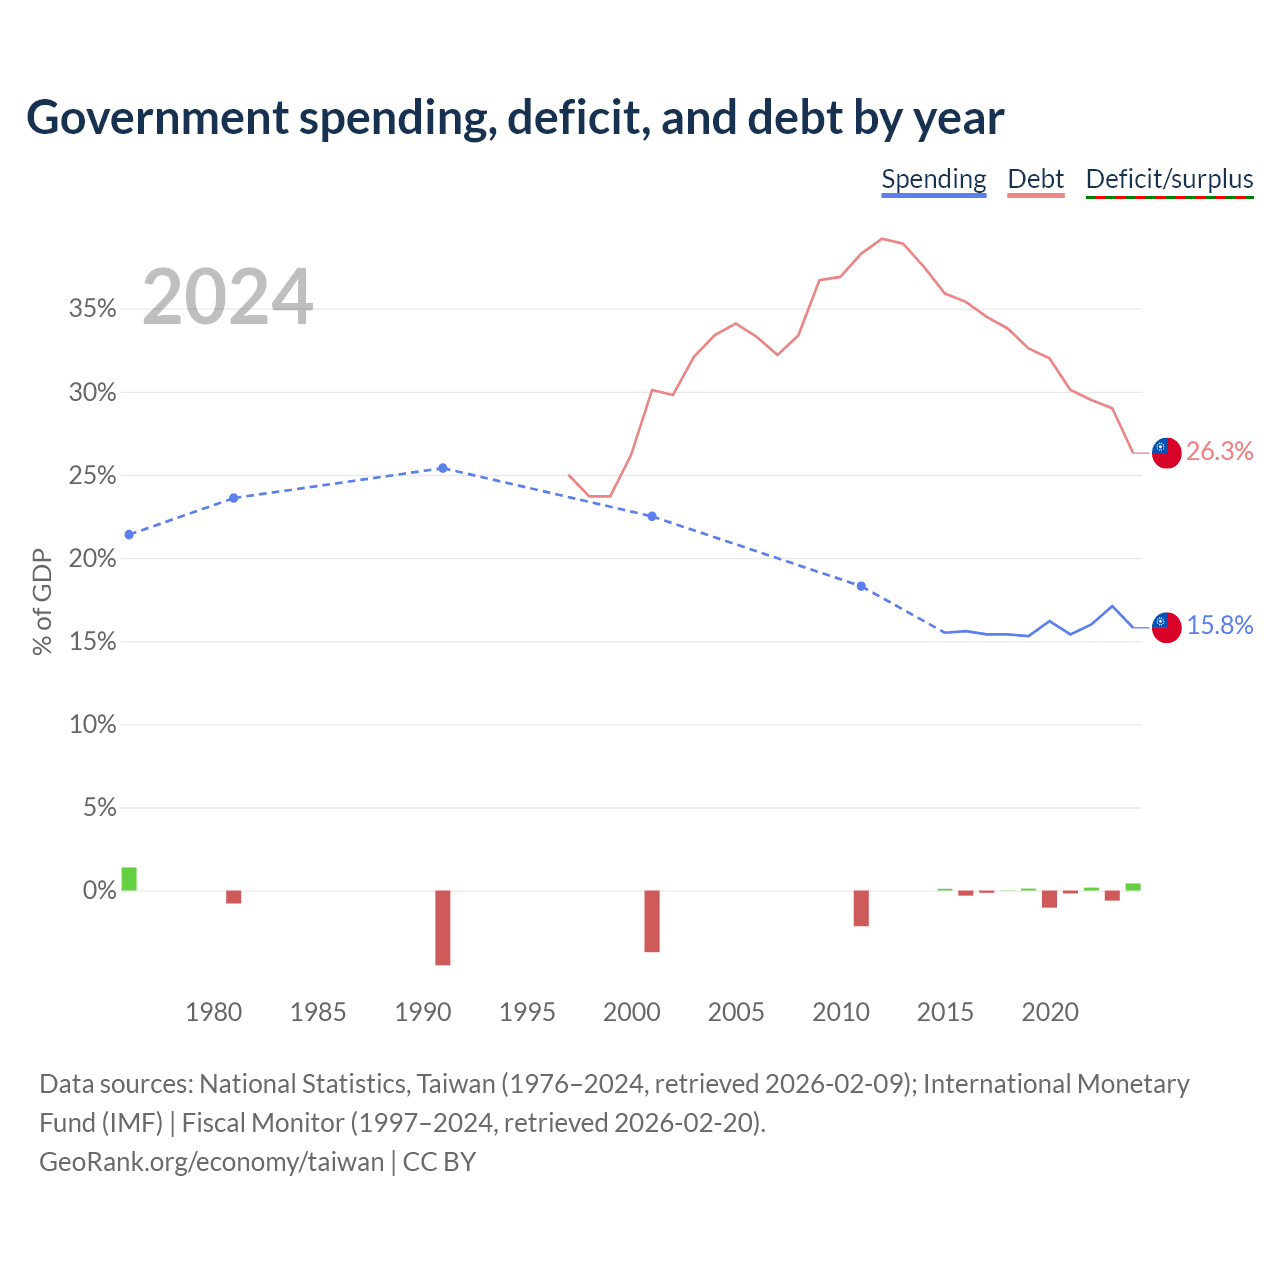
Government spending, deficit, and debt by year
| Year | % of GDP | ||
|---|---|---|---|
| Government spending | Government debt | Government deficit/surplus | |
| 2025 | - | 22.4% | - |
| 2024 | 15.8% | 26.8% | 0.43% |
| 2023 | 17.1% | 29% | -0.61% |
| 2022 | 16% | 29.5% | 0.17% |
| 2021 | 15.4% | 30.1% | -0.18% |
| 2020 | 16.2% | 32% | -1.03% |
| 2019 | 15.3% | 32.6% | 0.11% |
| 2018 | 15.4% | 33.8% | 0.02% |
| 2017 | 15.4% | 34.5% | -0.14% |
| 2016 | 15.6% | 35.4% | -0.31% |
| 2015 | 15.5% | 35.9% | 0.1% |
| 2014 | - | 37.5% | - |
| 2013 | - | 38.9% | - |
| 2012 | - | 39.2% | - |
| 2011 | 18.3% | 38.3% | -2.15% |
| 2010 | - | 36.9% | - |
| 2009 | - | 36.7% | - |
| 2008 | - | 33.4% | - |
| 2007 | - | 32.2% | - |
| 2006 | - | 33.3% | - |
| 2005 | - | 34.1% | - |
| 2004 | - | 33.4% | - |
| 2003 | - | 32.1% | - |
| 2002 | - | 29.8% | - |
| 2001 | 22.4% | 30.1% | -3.7% |
| 2000 | - | 26.2% | - |
| 1999 | - | 23.7% | - |
| 1998 | - | 23.7% | - |
| 1997 | - | 25% | - |
| 1996 | - | - | - |
| 1995 | - | - | - |
| 1994 | - | - | - |
| 1993 | - | - | - |
| 1992 | - | - | - |
| 1991 | 25.4% | - | -4.5% |
| 1990 | - | - | - |
| 1989 | - | - | - |
| 1988 | - | - | - |
| 1987 | - | - | - |
| 1986 | - | - | - |
| 1985 | - | - | - |
| 1984 | - | - | - |
| 1983 | - | - | - |
| 1982 | - | - | - |
| 1981 | 23.6% | - | -0.78% |
| 1980 | - | - | - |
| 1979 | - | - | - |
| 1978 | - | - | - |
| 1977 | - | - | - |
| 1976 | 20.3% | - | 1.32% |
Data sources: National Statistics, Taiwan (1976–2024, retrieved 2026-07-08); International Monetary Fund (IMF) | Fiscal Monitor (1997–2025, retrieved 2026-07-08).
GeoRank.org/economy/taiwan | CC BY
This chart shows Taiwan's government spending, budget balance, and debt over time, each expressed as a share of GDP.
Over the past 15 years, Taiwan recorded a fiscal deficit in 9 of them, with an average annual deficit equal to 0.75% of GDP. In 2024, government spending reached $127B (15.8% of GDP), with a surplus of 0.43%.
The national debt reached $215B, ranking 43rd out of 185 countries by total size, with a debt-to-GDP ratio of 22.4%, ranking 170th.
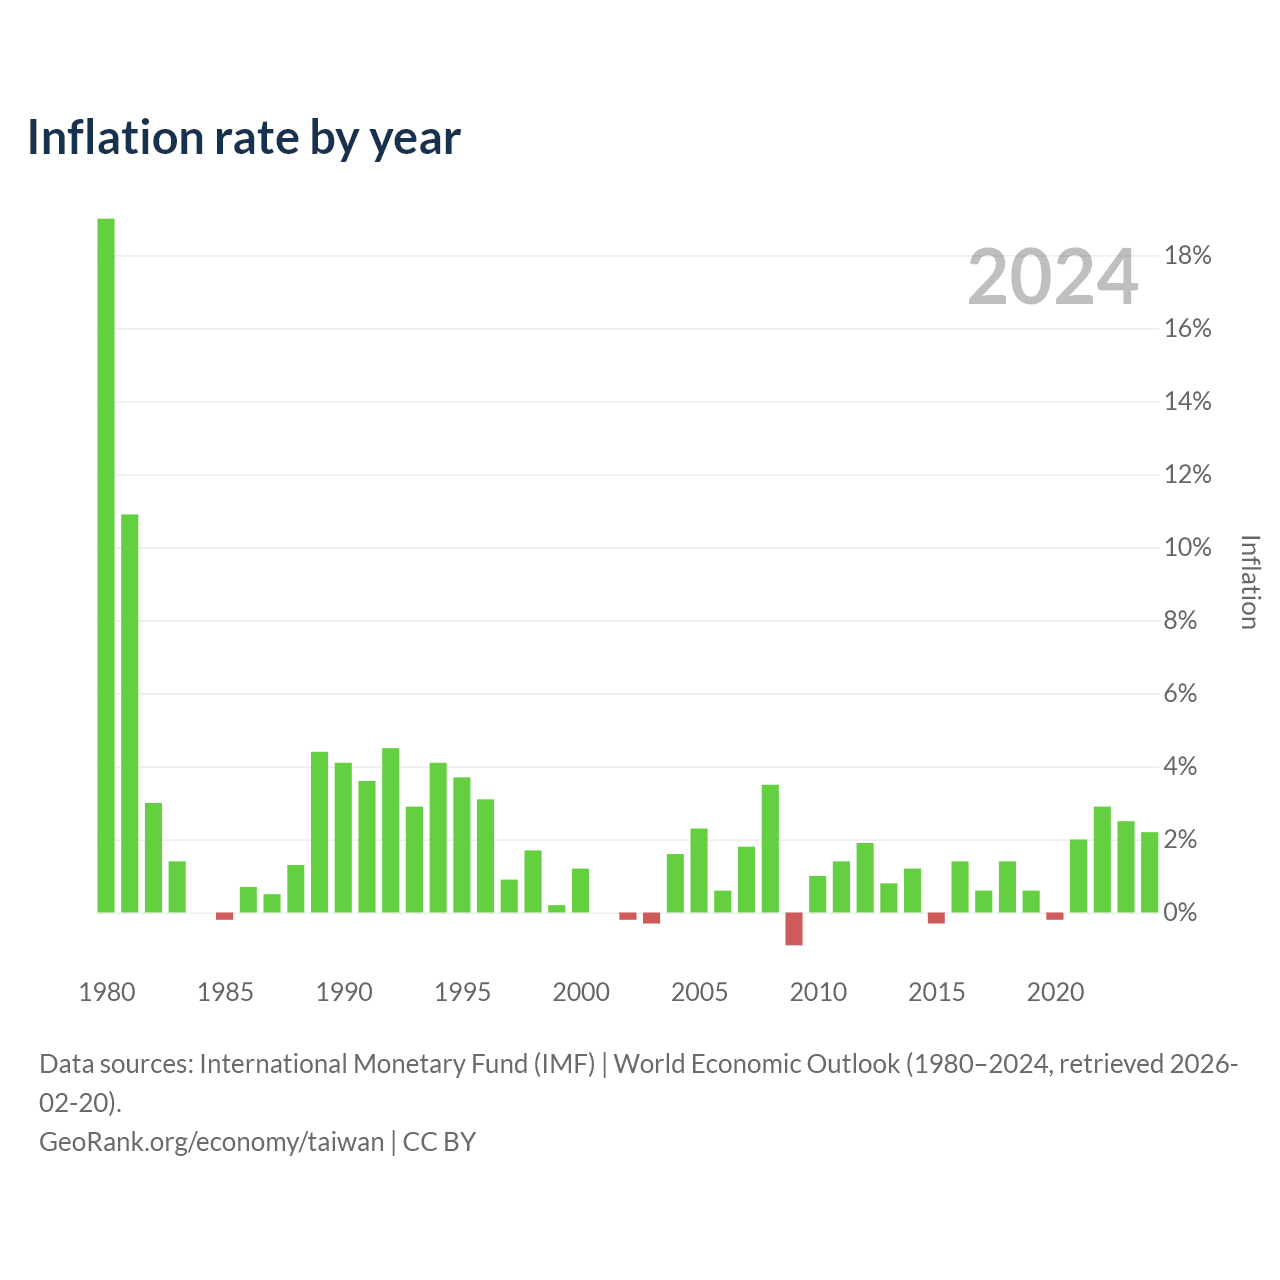
Inflation rate by year
| Year | Inflation |
|---|---|
| 2025 | 1.7% |
| 2024 | 2.2% |
| 2023 | 2.5% |
| 2022 | 2.9% |
| 2021 | 2% |
| 2020 | -0.2% |
| 2019 | 0.6% |
| 2018 | 1.4% |
| 2017 | 0.6% |
| 2016 | 1.4% |
| 2015 | -0.3% |
| 2014 | 1.2% |
| 2013 | 0.8% |
| 2012 | 1.9% |
| 2011 | 1.4% |
| 2010 | 1% |
| 2009 | -0.9% |
| 2008 | 3.5% |
| 2007 | 1.8% |
| 2006 | 0.6% |
| 2005 | 2.3% |
| 2004 | 1.6% |
| 2003 | -0.3% |
| 2002 | -0.2% |
| 2001 | 0% |
| 2000 | 1.2% |
| 1999 | 0.2% |
| 1998 | 1.7% |
| 1997 | 0.9% |
| 1996 | 3.1% |
| 1995 | 3.7% |
| 1994 | 4.1% |
| 1993 | 2.9% |
| 1992 | 4.5% |
| 1991 | 3.6% |
| 1990 | 4.1% |
| 1989 | 4.4% |
| 1988 | 1.3% |
| 1987 | 0.5% |
| 1986 | 0.7% |
| 1985 | -0.2% |
| 1984 | 0% |
| 1983 | 1.4% |
| 1982 | 3% |
| 1981 | 10.9% |
| 1980 | 19% |
Data sources: International Monetary Fund (IMF) | World Economic Outlook (1980–2025, retrieved 2026-07-08).
GeoRank.org/economy/taiwan | CC BY
Over the past 20 years, Taiwan has had an average annual inflation rate of 1.31%. In 2025, inflation was 1.7%. The bar chart above shows consumer price inflation by year.
Balance of trade
|
Taiwan
|
Rank | |
|---|---|---|
|
Current account balance
|
$113B
2024 |
5/190 |
| Current account balance, % of GDP |
+14.1%
2024 |
13/190 |
| Imports of goods and services, % of GDP |
54.5%
2025 |
61/182 |
| Exports of goods and services, % of GDP |
73.6%
2025 |
20/193 |
Economic freedom indices
|
Taiwan
|
Rank | |
|---|---|---|
| Economic freedom | 79.8 | 6/197 |
| Property rights | 83.4 | 35/182 |
| Government integrity | 74.3 | 23/182 |
| Judicial effectiveness | 94.3 | 15/182 |
| Tax burden | 78.9 | 91/182 |
| Government spending | 90 | 25/180 |
| Fiscal health | 92.9 | 41/181 |
| Business freedom | 78.6 | 36/182 |
| Labor freedom | 69 | 13/182 |
| Monetary freedom | 80.3 | 17/180 |
| Trade freedom | 86 | 9/181 |
| Investment freedom | 70 | 45/181 |
| Financial freedom | 60 | 65/181 |
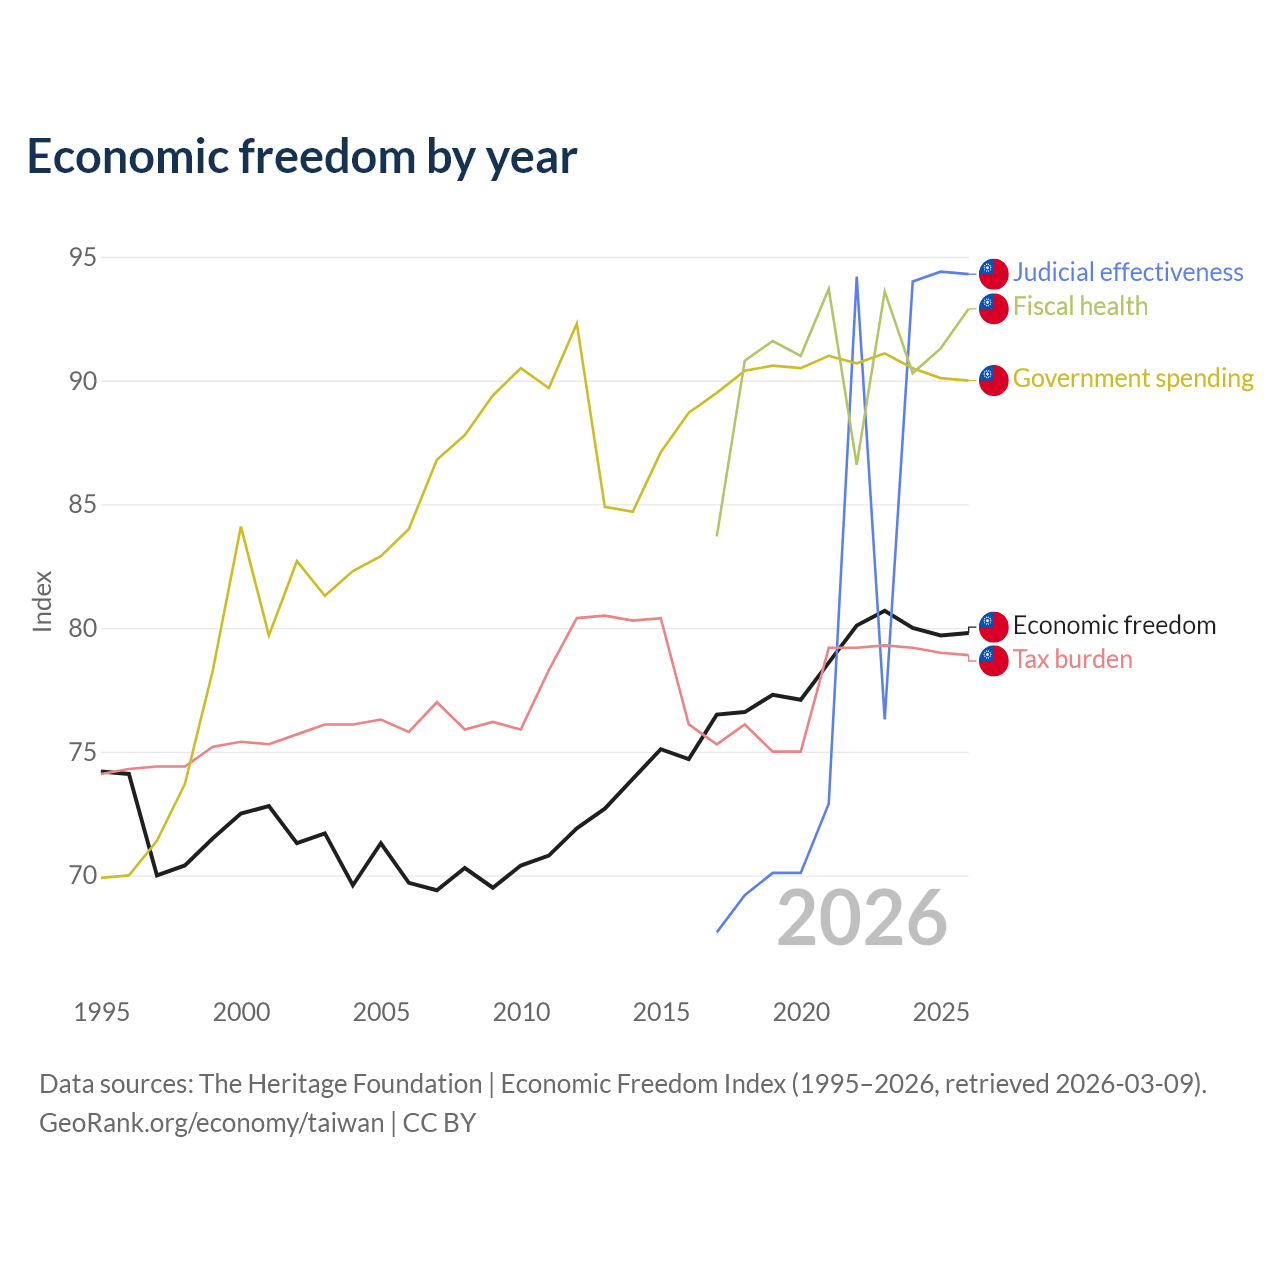
Economic freedom by year
| Year | Index | ||||
|---|---|---|---|---|---|
| Economic freedom | Judicial effectiveness | Tax burden | Government spending | Fiscal health | |
| 2026 | 79.8 | 94.3 | 78.9 | 90 | 92.9 |
| 2025 | 79.7 | 94.4 | 79 | 90.1 | 91.3 |
| 2024 | 80 | 94 | 79.2 | 90.5 | 90.3 |
| 2023 | 80.7 | 76.3 | 79.3 | 91.1 | 93.6 |
| 2022 | 80.1 | 94.2 | 79.2 | 90.7 | 86.6 |
| 2021 | 78.6 | 72.9 | 79.2 | 91 | 93.7 |
| 2020 | 77.1 | 70.1 | 75 | 90.5 | 91 |
| 2019 | 77.3 | 70.1 | 75 | 90.6 | 91.6 |
| 2018 | 76.6 | 69.2 | 76.1 | 90.4 | 90.8 |
| 2017 | 76.5 | 67.7 | 75.3 | 89.5 | 83.7 |
| 2016 | 74.7 | - | 76.1 | 88.7 | - |
| 2015 | 75.1 | - | 80.4 | 87.1 | - |
| 2014 | 73.9 | - | 80.3 | 84.7 | - |
| 2013 | 72.7 | - | 80.5 | 84.9 | - |
| 2012 | 71.9 | - | 80.4 | 92.3 | - |
| 2011 | 70.8 | - | 78.3 | 89.7 | - |
| 2010 | 70.4 | - | 75.9 | 90.5 | - |
| 2009 | 69.5 | - | 76.2 | 89.4 | - |
| 2008 | 70.3 | - | 75.9 | 87.8 | - |
| 2007 | 69.4 | - | 77 | 86.8 | - |
| 2006 | 69.7 | - | 75.8 | 84 | - |
| 2005 | 71.3 | - | 76.3 | 82.9 | - |
| 2004 | 69.6 | - | 76.1 | 82.3 | - |
| 2003 | 71.7 | - | 76.1 | 81.3 | - |
| 2002 | 71.3 | - | 75.7 | 82.7 | - |
| 2001 | 72.8 | - | 75.3 | 79.7 | - |
| 2000 | 72.5 | - | 75.4 | 84.1 | - |
| 1999 | 71.5 | - | 75.2 | 78.3 | - |
| 1998 | 70.4 | - | 74.4 | 73.7 | - |
| 1997 | 70 | - | 74.4 | 71.4 | - |
| 1996 | 74.1 | - | 74.3 | 70 | - |
| 1995 | 74.2 | - | 74.1 | 69.9 | - |
Data sources: The Heritage Foundation | Economic Freedom Index (1995–2026, retrieved 2026-07-08).
GeoRank.org/economy/taiwan | CC BY
Taiwan is ranked 5/174 for economic freedom with a score of 79.8, compared to 29/162 and a score of 69.7 in 2006.
Other economic metrics
|
Taiwan
|
Rank | |
|---|---|---|
| Services, % of GDP |
58.1%
2024 |
89/191 |
| Industry, % of GDP |
40.4%
2024 |
14/194 |
| Agriculture, forestry, and fishing, % of GDP |
1.46%
2024 |
163/193 |
|
GNI, Atlas method
|
$832B
2024 |
22/194 |
| Poverty at national poverty lines |
1.5%
2020 |
174/176 |
|
Gross capital formation, % of GDP
|
26.9%
2024 |
53/179 |
Compare Taiwan vs other countries
GDP per capita map
Data sources: World Bank | Economy & Growth (1985–2025, retrieved 2026-07-08); National Statistics, Taiwan (1985–2024, retrieved 2026-07-08); U.S. Census Bureau (1985–2025, retrieved 2026-07-08).
GeoRank.org/economy/taiwan | CC BY
Help us show the world through your eyes
Share a photo of your city and help others discover what it looks like to live there. Your contribution makes our data come alive.
Data sources:
- World Bank | Economy & Growth (1985–2025, retrieved 2026-07-08)
- National Statistics, Taiwan (1951–2026, retrieved 2026-07-08)
- The Heritage Foundation | Economic Freedom Index (1995–2026, retrieved 2026-07-08)
- International Monetary Fund (IMF) | World Economic Outlook (1980–2025, retrieved 2026-07-08)
- U.S. Census Bureau (1985–2025, retrieved 2026-07-08)
- Central Intelligence Agency (CIA) (1999–2020, retrieved 2026-07-08)
- United Nations | World Population Prospects (2026, retrieved 2026-07-08)
- LivingCost (2026, retrieved 2026-07-08)
Creative Commons Attribution (CC BY) — you’re free to copy, share, remix, adapt, and use even commercially as long as you give appropriate credit and clearly indicate if you made changes. Other sources may be subject to different license terms.
The current account balance is the sum of net trade in goods and services, net earnings from cross-border investments, and net transfer payments. It reflects a country's economic transactions with the rest of the world and is a fundamental component of the balance of payments. A surplus indicates that a country exports more than it imports, while a deficit shows the opposite.
Gross National Income (GNI) measures a country's total income. It encompasses income earned by residents, businesses, and foreign sources, defined as employee compensation and investment profits. GNI adds product taxes not included elsewhere and subtracts subsidies. It accounts for income from residents working abroad but excludes earnings from foreigners within the country.
Formerly gross domestic investment, gross capital formation measures the share of a country’s economic output invested in fixed assets, including buildings, machinery, and infrastructure. It indicates how much of the economy is devoted to building productive capacity.