The current population of Georgia is 3,934,050 people, as of 2026 based on the adjusted UN estimation. The latest officially reported number was 3,935,766 in 2025.
- Georgia is ranked 129/197 by population and was ranked 124th in 2006.
- Georgia accounts for 0.05% of the world's population.
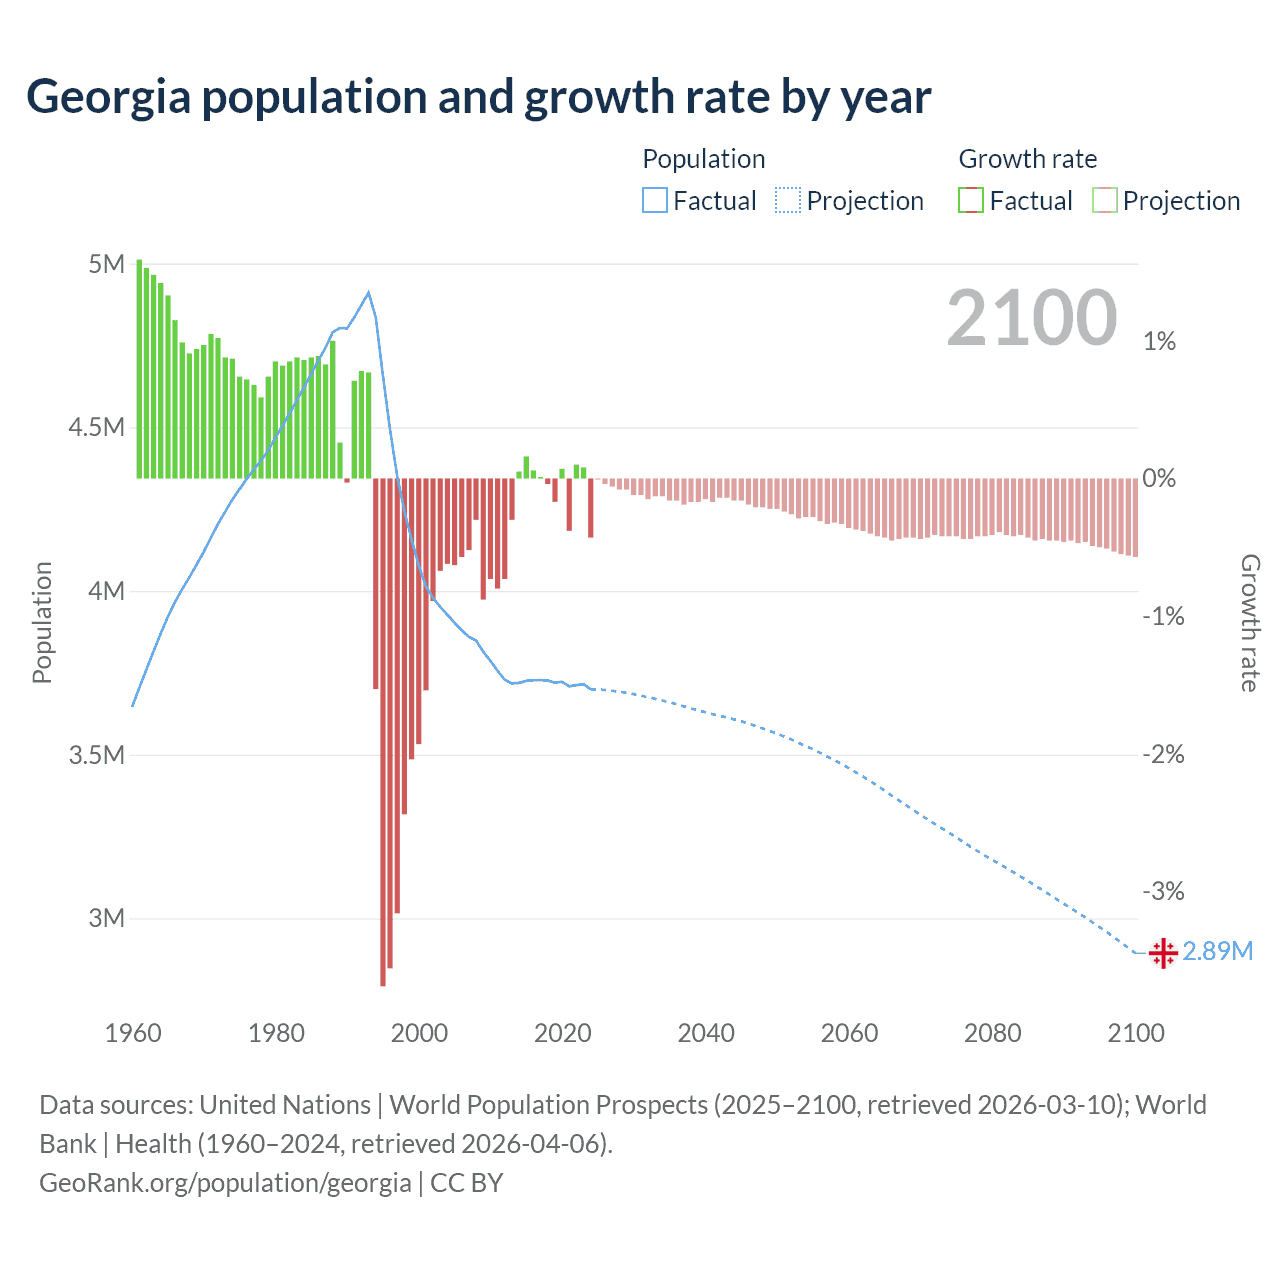
- Georgia's population peaked in 1993 at 4.91M people and has been in decline since.
- For the last 20 years, Georgia has had an average growth rate of 0.07% per year.
- The UN estimates that Georgia's population is going to decline by -3.61% to 3.79M people by 2050.
- Since 2006, population has increased from 3.88M people to 3.93M (1.38% growth in 20 years).
Georgia population and growth rate by year
| Year | Population | Growth rate |
|---|---|---|
| 2100 | 3,078,390 | -0.57% |
| 2099 | 3,095,962 | -0.56% |
| 2098 | 3,113,268 | -0.55% |
| 2097 | 3,130,535 | -0.53% |
| 2096 | 3,147,088 | -0.51% |
| 2095 | 3,163,140 | -0.5% |
| 2094 | 3,179,046 | -0.49% |
| 2093 | 3,194,797 | -0.46% |
| 2092 | 3,209,692 | -0.47% |
| 2091 | 3,224,841 | -0.45% |
| 2090 | 3,239,446 | -0.46% |
| 2089 | 3,254,302 | -0.45% |
| 2088 | 3,269,115 | -0.45% |
| 2087 | 3,284,011 | -0.44% |
| 2086 | 3,298,437 | -0.45% |
| 2085 | 3,313,192 | -0.43% |
| 2084 | 3,327,434 | -0.41% |
| 2083 | 3,341,286 | -0.42% |
| 2082 | 3,355,214 | -0.41% |
| 2081 | 3,368,911 | -0.39% |
| 2080 | 3,382,244 | -0.41% |
| 2079 | 3,396,024 | -0.42% |
| 2078 | 3,410,227 | -0.42% |
| 2077 | 3,424,676 | -0.44% |
| 2076 | 3,439,894 | -0.44% |
| 2075 | 3,455,072 | -0.42% |
| 2074 | 3,469,703 | -0.42% |
| 2073 | 3,484,340 | -0.42% |
| 2072 | 3,498,926 | -0.41% |
| 2071 | 3,513,371 | -0.43% |
| 2070 | 3,528,520 | -0.44% |
| 2069 | 3,544,057 | -0.43% |
| 2068 | 3,559,495 | -0.43% |
| 2067 | 3,575,004 | -0.44% |
| 2066 | 3,590,926 | -0.45% |
| 2065 | 3,607,114 | -0.43% |
| 2064 | 3,622,820 | -0.42% |
| 2063 | 3,637,969 | -0.4% |
| 2062 | 3,652,682 | -0.38% |
| 2061 | 3,666,528 | -0.37% |
| 2060 | 3,680,180 | -0.36% |
| 2059 | 3,693,482 | -0.33% |
| 2058 | 3,705,813 | -0.32% |
| 2057 | 3,717,709 | -0.33% |
| 2056 | 3,729,974 | -0.31% |
| 2055 | 3,741,446 | -0.28% |
| 2054 | 3,751,834 | -0.28% |
| 2053 | 3,762,225 | -0.29% |
| 2052 | 3,773,210 | -0.26% |
| 2051 | 3,782,880 | -0.24% |
| 2050 | 3,792,010 | -0.22% |
| 2049 | 3,800,334 | -0.22% |
| 2048 | 3,808,834 | -0.21% |
| 2047 | 3,816,936 | -0.21% |
| 2046 | 3,825,088 | -0.19% |
| 2045 | 3,832,457 | -0.16% |
| 2044 | 3,838,601 | -0.16% |
| 2043 | 3,844,640 | -0.14% |
| 2042 | 3,850,029 | -0.14% |
| 2041 | 3,855,284 | -0.17% |
| 2040 | 3,861,929 | -0.15% |
| 2039 | 3,867,567 | -0.17% |
| 2038 | 3,874,063 | -0.17% |
| 2037 | 3,880,743 | -0.19% |
| 2036 | 3,887,984 | -0.16% |
| 2035 | 3,894,028 | -0.16% |
| 2034 | 3,900,127 | -0.13% |
| 2033 | 3,905,266 | -0.13% |
| 2032 | 3,910,171 | -0.15% |
| 2031 | 3,915,886 | -0.12% |
| 2030 | 3,920,585 | -0.12% |
| 2029 | 3,925,124 | -0.08% |
| 2028 | 3,928,232 | -0.08% |
| 2027 | 3,931,570 | -0.06% |
| 2026 | 3,934,050 | -0.04% |
| 2025 | 3,935,766 | 3.23% |
| 2024 | 3,812,518 | 2.61% |
| 2023 | 3,715,483 | 0.08% |
| 2022 | 3,712,502 | 0.1% |
| 2021 | 3,708,610 | -0.38% |
| 2020 | 3,722,716 | 0.07% |
| 2019 | 3,720,161 | -0.17% |
| 2018 | 3,726,549 | -0.04% |
| 2017 | 3,728,004 | 0.01% |
| 2016 | 3,727,505 | 0.06% |
| 2015 | 3,725,276 | 0.16% |
| 2014 | 3,719,414 | 0.05% |
| 2013 | 3,717,668 | -0.3% |
| 2012 | 3,728,874 | -0.73% |
| 2011 | 3,756,441 | -0.8% |
| 2010 | 3,786,695 | -0.73% |
| 2009 | 3,814,419 | -0.88% |
| 2008 | 3,848,449 | -0.3% |
| 2007 | 3,860,158 | -0.52% |
| 2006 | 3,880,347 | -0.57% |
| 2005 | 3,902,469 | -0.63% |
| 2004 | 3,927,340 | -0.62% |
| 2003 | 3,951,736 | -0.67% |
| 2002 | 3,978,515 | -0.89% |
| 2001 | 4,014,373 | -1.54% |
| 2000 | 4,077,131 | -1.93% |
| 1999 | 4,157,192 | -2.04% |
| 1998 | 4,243,607 | -2.44% |
| 1997 | 4,349,913 | -3.16% |
| 1996 | 4,491,699 | -3.56% |
| 1995 | 4,657,722 | -3.69% |
| 1994 | 4,836,076 | -1.53% |
| 1993 | 4,911,100 | 0.77% |
| 1992 | 4,873,500 | 0.78% |
| 1991 | 4,835,900 | 0.71% |
| 1990 | 4,802,000 | -0.03% |
| 1989 | 4,803,300 | 0.26% |
| 1988 | 4,790,700 | 1% |
| 1987 | 4,743,500 | 0.83% |
| 1986 | 4,704,500 | 0.89% |
| 1985 | 4,662,900 | 0.88% |
| 1984 | 4,622,200 | 0.86% |
| 1983 | 4,582,900 | 0.88% |
| 1982 | 4,542,800 | 0.85% |
| 1981 | 4,504,500 | 0.82% |
| 1980 | 4,467,700 | 0.85% |
| 1979 | 4,430,200 | 0.74% |
| 1978 | 4,397,700 | 0.59% |
| 1977 | 4,372,100 | 0.68% |
| 1976 | 4,342,400 | 0.72% |
| 1975 | 4,311,200 | 0.74% |
| 1974 | 4,279,500 | 0.87% |
| 1973 | 4,242,500 | 0.88% |
| 1972 | 4,205,300 | 1.02% |
| 1971 | 4,163,000 | 1.05% |
| 1970 | 4,119,900 | 0.97% |
| 1969 | 4,080,300 | 0.94% |
| 1968 | 4,042,300 | 0.91% |
| 1967 | 4,005,800 | 0.99% |
| 1966 | 3,966,700 | 1.15% |
| 1965 | 3,921,600 | 1.33% |
| 1964 | 3,870,300 | 1.42% |
| 1963 | 3,816,100 | 1.48% |
| 1962 | 3,760,300 | 1.53% |
| 1961 | 3,703,600 | 1.59% |
| 1960 | 3,645,600 | - |
Data sources: United Nations | World Population Prospects (2026–2100, retrieved 2026-07-08); World Bank | Health (1960–2025, retrieved 2026-07-08).
GeoRank.org/population/georgia | CC BY 
Georgia has a population of 3.93M as of 2026, compared to 3.73M in 2016, 3.88M in 2006, and 4.49M in 1996.
Over the past 10 years, the population has had a trend to increase by an average of 0.55% per year. Georgia is ranked 132nd out of 197 countries by a 10-year average growth rate.
The UN's World Population Prospects forecasts that with changing growth rate trends in 20 years (in 2046) Georgia will have 3,825,088 people (-2.77% decline) with a rank change from 129th to 134th.
By the year 2100, Georgia's population is projected to decline by 21.8% from its current level to 3.08M people.
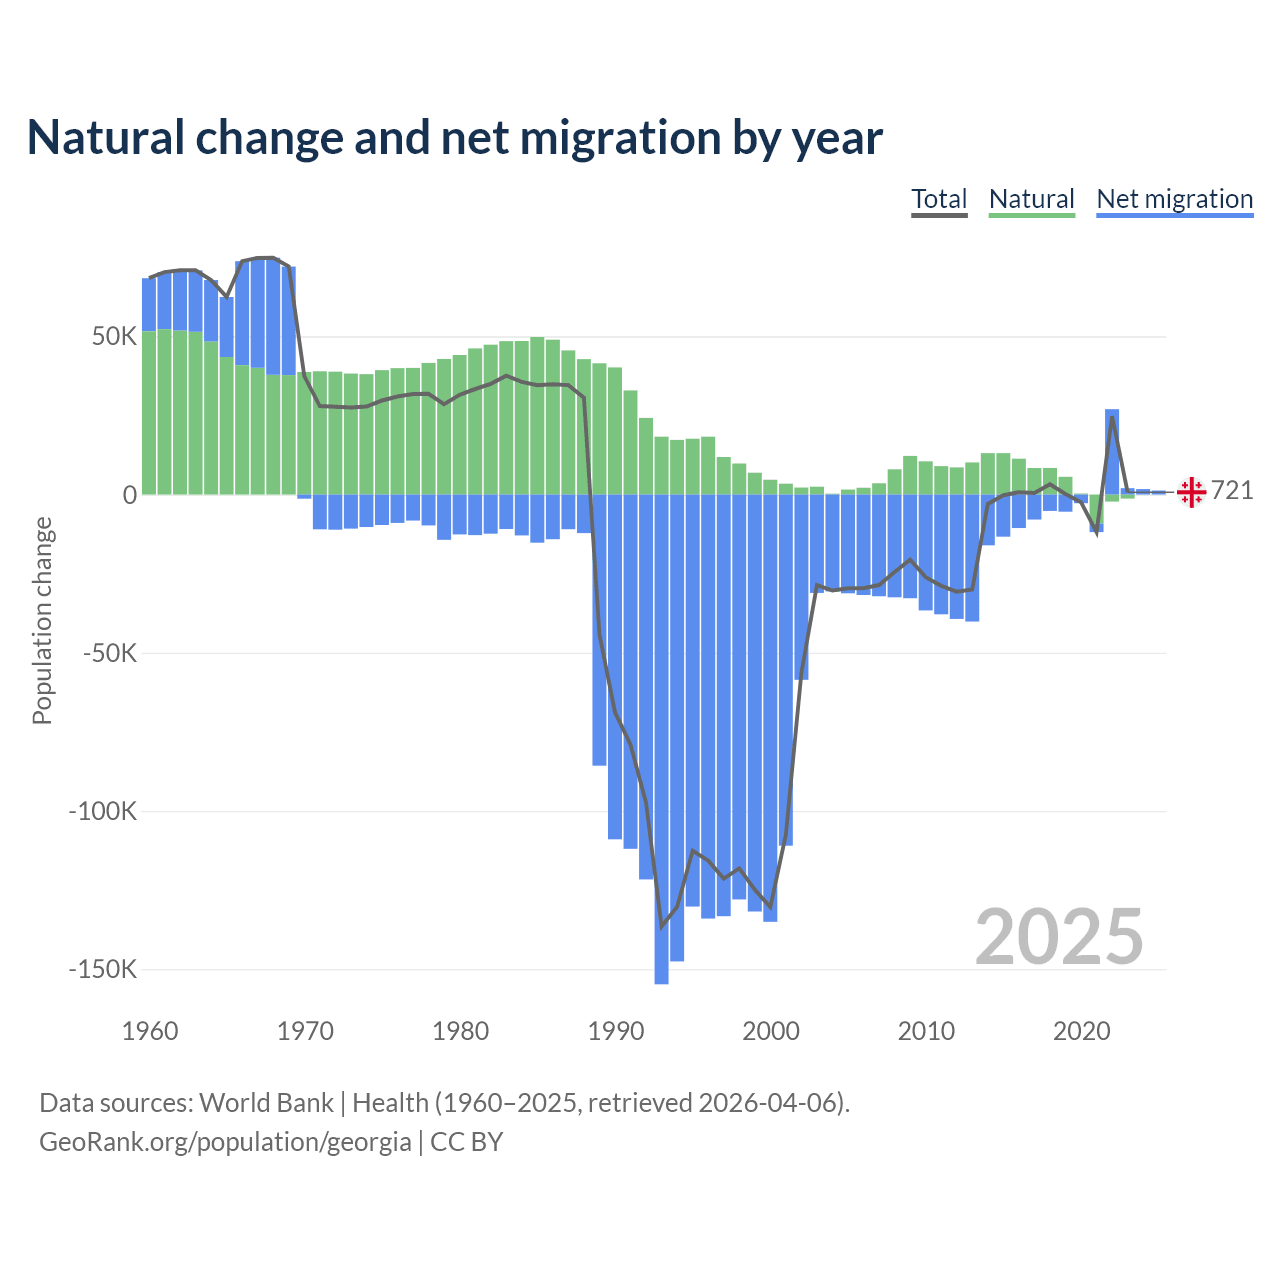
Natural change and net migration by year
| Year | Population change | ||
|---|---|---|---|
| Total | Natural | Net migration | |
| 2025 | - | - | 1,283 |
| 2024 | -340 | -2,085 | 1,745 |
| 2023 | 721 | -1,282 | 2,003 |
| 2022 | 24,775 | -2,224 | 26,999 |
| 2021 | -11,865 | -9,127 | -2,738 |
| 2020 | -2,403 | 335 | -2,738 |
| 2019 | 194 | 5,606 | -5,412 |
| 2018 | 3,231 | 8,407 | -5,176 |
| 2017 | 502 | 8,391 | -7,889 |
| 2016 | 758 | 11,346 | -10,588 |
| 2015 | -216 | 13,105 | -13,321 |
| 2014 | -2,958 | 13,089 | -16,047 |
| 2013 | -29,972 | 10,145 | -40,117 |
| 2012 | -30,706 | 8,584 | -39,290 |
| 2011 | -28,858 | 8,989 | -37,847 |
| 2010 | -26,107 | 10,501 | -36,608 |
| 2009 | -20,547 | 12,210 | -32,757 |
| 2008 | -24,489 | 7,974 | -32,463 |
| 2007 | -28,591 | 3,551 | -32,142 |
| 2006 | -29,583 | 2,146 | -31,729 |
| 2005 | -29,612 | 1,604 | -31,216 |
| 2004 | -30,331 | 283 | -30,614 |
| 2003 | -28,593 | 2,482 | -31,075 |
| 2002 | -56,303 | 2,228 | -58,531 |
| 2001 | -107,524 | 3,445 | -110,969 |
| 2000 | -130,365 | 4,681 | -135,046 |
| 1999 | -124,867 | 6,901 | -131,768 |
| 1998 | -118,139 | 9,823 | -127,962 |
| 1997 | -121,388 | 11,862 | -133,250 |
| 1996 | -115,695 | 18,304 | -133,999 |
| 1995 | -112,557 | 17,644 | -130,201 |
| 1994 | -130,272 | 17,279 | -147,551 |
| 1993 | -136,485 | 18,303 | -154,788 |
| 1992 | -97,421 | 24,226 | -121,647 |
| 1991 | -79,026 | 32,932 | -111,958 |
| 1990 | -68,800 | 40,169 | -108,969 |
| 1989 | -44,180 | 41,510 | -85,690 |
| 1988 | 30,621 | 42,810 | -12,189 |
| 1987 | 34,595 | 45,561 | -10,966 |
| 1986 | 34,837 | 48,960 | -14,123 |
| 1985 | 34,578 | 49,786 | -15,208 |
| 1984 | 35,603 | 48,523 | -12,920 |
| 1983 | 37,590 | 48,496 | -10,906 |
| 1982 | 35,000 | 47,363 | -12,363 |
| 1981 | 33,363 | 46,185 | -12,822 |
| 1980 | 31,521 | 44,114 | -12,593 |
| 1979 | 28,582 | 42,863 | -14,281 |
| 1978 | 31,861 | 41,616 | -9,755 |
| 1977 | 31,810 | 40,023 | -8,213 |
| 1976 | 31,012 | 39,964 | -8,952 |
| 1975 | 29,726 | 39,331 | -9,605 |
| 1974 | 27,810 | 38,071 | -10,261 |
| 1973 | 27,496 | 38,259 | -10,763 |
| 1972 | 27,735 | 38,832 | -11,097 |
| 1971 | 27,956 | 38,953 | -10,997 |
| 1970 | 37,420 | 38,731 | -1,311 |
| 1969 | 72,065 | 37,764 | 34,301 |
| 1968 | 74,871 | 37,840 | 37,031 |
| 1967 | 74,804 | 40,070 | 34,734 |
| 1966 | 73,774 | 40,905 | 32,869 |
| 1965 | 62,444 | 43,463 | 18,981 |
| 1964 | 67,806 | 48,429 | 19,377 |
| 1963 | 70,861 | 51,456 | 19,405 |
| 1962 | 70,884 | 51,903 | 18,981 |
| 1961 | 70,300 | 52,284 | 18,016 |
| 1960 | 68,380 | 51,640 | 16,740 |
Data sources: World Bank | Health (1960–2025, retrieved 2026-07-08).
GeoRank.org/population/georgia | CC BY
Over the last 10 years, 65.5% of the population change in Georgia is from natural causes (a gain of 32,472 people) and 34.5% is from migration (a loss of 17,115 people).
As of 2024, 81,582 residents or 2.1% of the population were not native-born in Georgia, compared to 73,078 and 1.9% in 2010.
Georgia population clock
 Georgia
|
Rank | |
|---|---|---|
| Current population |
3934050
|
129/197 |
| Percent of world population | 0.05% | 129/197 |
| One net population change |
4.28 minutes
|
78/197 |
| One birth every |
12.2 minutes
|
138/196 |
| One death every |
11.6 minutes
|
111/196 |
| Daily growth/decline | +338 | 78/197 |
| Annual growth/decline | +123,248 | 78/197 |
| Annual growth/decline rate | +3.23% | 11/197 |
| One migration net change every |
6.85 hours
|
61/196 |
| Annual migration change | +1,283 | 61/196 |
| Foreign-born residents | 81,582 | 137/195 |
| Foreign-born share of population | 2.1% | 133/195 |
Largest cities by population
Compare countries by 7 more topics
Georgia population statistics
|
Georgia
|
 World
World
|
|
|---|---|---|
| Life expectancy | 75 years | 73.8 years |
| Average age | 38.8 years | 34 years |
| Median age | 38.3 years | 31.8 years |
| Male:Female ratio | 46.6:53.4 | 50.3:49.7 |
| Fertility rate | 1.8 births per woman | 2.19 births per woman |
| Population density | 146.6 ppl/mi² | 144.1 ppl/mi² |
Population map with other countries
Data sources: World Bank | Health (1960–2025, retrieved 2026-07-08); United Nations | World Population Prospects (1960–2026, retrieved 2026-07-08); U.S. Census Bureau (1960–2025, retrieved 2026-07-08); Central Intelligence Agency (CIA) (2000–2019, retrieved 2026-07-08).
GeoRank.org/population/georgia | CC BY
Help us show the world through your eyes
Share a photo of your city and help others discover what it looks like to live there. Your contribution makes our data come alive.
Data sources:
- World Bank | Health (1960–2025, retrieved 2026-07-08)
- United Nations | World Population Prospects (1960–2100, retrieved 2026-07-08)
- U.S. Census Bureau (1960–2025, retrieved 2026-07-08)
- Central Intelligence Agency (CIA) (2000–2019, retrieved 2026-07-08)
- Wikidata (2026, retrieved 2026-07-08)
Creative Commons Attribution (CC BY) — you’re free to copy, share, remix, adapt, and use even commercially as long as you give appropriate credit and clearly indicate if you made changes. Other sources may be subject to different license terms.