The United States' land area is 3,531,839 sq mi, and the total size is 3,794,100 sq mi, with inland water included. The United States rankes 3/197 by total surface area.
- Occupies 6.14% of the land mass of all countries.
- 46.1% of its territory is agricultural land.
- The US has 8.8% of the world's agricultural land area.
- 33.9% of its area is covered by forests.
- Has 7.68% of the world's forests.
The United States total size and land area
 United States
|
Rank | |
|---|---|---|
| Total surface area |
3,794,100 sq mi |
3/197 |
| Share all of all countries' surface area | 1.93% | N/A |
| Land area |
3,531,839 sq mi |
3/197 |
| Share of all countries' land area | 6.14% | N/A |
| Population | 341,784,857 | 3/197 |
| Population density | 97.3 ppl/mi² | 149/197 |
United States' area by type
|
United States
|
Rank | |
|---|---|---|
| Forest area |
1,196,125 sq mi |
4/196 |
| Forest area as share of land | 33.9% | 89/196 |
| World's forests share | 7.68% | N/A |
Agricultural land

|
1,627,576 sq mi |
2/194 |
| Agricultural land share | 46.1% | 71/194 |
| Share of global agricultural land | 8.8% | N/A |
|
Arable land
|
585,190 sq mi |
2/191 |
| Arable land share | 16.6% | 61/191 |
|
Permanent cropland
|
12,242 sq mi |
14/192 |
| Permanent cropland share | 0.35% | 148/192 |
|
Water area
|
262,262 sq mi |
3/197 |
| Water as share of total area | 6.91% | 22/197 |
| Roads length |
4,092,730 mi |
2/176 |
| Land borders length |
7,458 mi |
6/197 |
| Coastline length |
12,380 mi |
8/197 |
| Share of marine protected waters | 19% | 29/155 |
Size rank: if US states were countries
If US states were countries, Alaska would be the 19th biggest country by land area size. Texas would be 40th (bigger than Norway, Germany, Finland, or Italy), and California — 61st (bigger than New Zealand, the United Kingdom, Guyana, or Iceland).
The table below ranks US states by land area in one mix with countries.
| # | State | Land area, mi² |
|---|---|---|
| 1 |
 Russia
|
6,323,145 |
| 2 |
 China
China
|
3,624,808 |
| 3 |
United States
|
3,531,839 |
| 4 |
 Canada
|
3,393,336 |
| 5 |
 Brazil
|
3,227,096 |
| 6 |
 Australia
|
2,969,906 |
| 7 |
 India
India
|
1,147,955 |
| 8 |
 Argentina
|
1,056,642 |
| 9 |
 Kazakhstan
|
1,042,360 |
| 10 |
 Algeria
|
919,595 |
| 11 |
 DR Congo
|
875,313 |
| 12 |
 Saudi Arabia
|
830,000 |
| 13 |
 Mexico
|
750,563 |
| 14 |
 Indonesia
|
730,720 |
| 15 |
 Sudan
Sudan
|
721,239 |
| 16 |
 Libya
Libya
|
679,362 |
| 17 |
 Iran
Iran
|
626,451 |
| 18 |
 Mongolia
|
601,740 |
| * | Alaska | 570,641 |
| 19 |
 Peru
Peru
|
494,211 |
| 20 |
 Niger
Niger
|
489,076 |
| 21 |
 Chad
Chad
|
486,180 |
| 22 |
 Angola
|
481,354 |
| 23 |
 Mali
Mali
|
471,118 |
| 24 |
 South Africa
|
468,377 |
| 25 |
 Ethiopia
|
435,716 |
| 26 |
 Colombia
|
428,380 |
| 27 |
 Bolivia
|
418,264 |
| 28 |
 Mauritania
|
397,955 |
| 29 |
 Egypt
Egypt
|
384,345 |
| 30 |
 Nigeria
|
351,650 |
| 31 |
 Tanzania
|
342,009 |
| 32 |
 Venezuela
|
340,561 |
| 33 |
 Namibia
|
317,874 |
| 34 |
 Mozambique
|
303,623 |
| 35 |
 Pakistan
|
297,638 |
| 36 |
 Turkey
|
297,156 |
| 37 |
 Zambia
|
287,024 |
| 38 |
 Chile
Chile
|
286,809 |
| * | Texas | 261,232 |
| 39 |
 Myanmar
|
251,997 |
| 40 |
 Afghanistan
|
251,827 |
| 41 |
 South Sudan
|
243,990 |
| 42 |
 Somalia
|
242,217 |
| 43 |
 CAR
CAR
|
240,534 |
| 44 |
 Madagascar
|
224,634 |
| 45 |
 Kenya
Kenya
|
224,278 |
| 46 |
 Ukraine
|
223,708 |
| 47 |
 Botswana
|
218,816 |
| 48 |
 France
|
208,090 |
| 49 |
 Yemen
Yemen
|
203,850 |
| 50 |
 Thailand
|
197,256 |
| 51 |
 Spain
Spain
|
192,934 |
| 52 |
 Cameroon
|
182,514 |
| 53 |
 Turkmenistan
|
181,441 |
| 54 |
 Papua New Guinea
|
174,850 |
| 55 |
 Morocco
|
172,317 |
| 56 |
 Uzbekistan
|
170,136 |
| 57 |
 Iraq
Iraq
|
167,619 |
| 58 |
 Sweden
|
157,248 |
| * | California | 155,779 |
| 59 |
 Paraguay
|
152,901 |
| 60 |
 Zimbabwe
|
149,364 |
| * | Montana | 145,546 |
| 61 |
 Japan
Japan
|
140,761 |
| 62 |
 Norway
|
140,645 |
| 63 |
 Germany
|
134,916 |
| 64 |
 Congo
Congo
|
131,854 |
| 65 |
 Malaysia
|
126,854 |
| 66 |
 Ivory Coast
|
122,780 |
| * | New Mexico | 121,298 |
| 67 |
 Vietnam
|
121,016 |
| 68 |
 Oman
Oman
|
119,499 |
| 69 |
 Poland
|
118,252 |
| 70 |
 Finland
|
117,360 |
| 71 |
 Philippines
|
115,124 |
| 72 |
 Italy
Italy
|
114,178 |
| * | Arizona | 113,594 |
| * | Nevada | 109,781 |
| 73 |
 Burkina Faso
|
105,638 |
| * | Colorado | 103,642 |
| 74 |
 New Zealand
|
101,665 |
| 75 |
 Gabon
Gabon
|
99,487 |
| * | Wyoming | 97,093 |
| * | Oregon | 95,988 |
| 76 |
 Ecuador
|
95,892 |
| 77 |
 Guinea
|
94,873 |
| 78 |
 United Kingdom
|
93,410 |
| 79 |
 Laos
Laos
|
89,112 |
| 80 |
 Romania
|
88,834 |
| 81 |
 Ghana
Ghana
|
87,851 |
| * | Idaho | 82,643 |
| * | Utah | 82,169 |
| * | Kansas | 81,759 |
| 82 |
 Guyana
|
81,522 |
| * | Minnesota | 79,627 |
| 83 |
 Belarus
|
78,372 |
| 84 |
 Uganda
|
77,421 |
| * | Nebraska | 76,824 |
| * | South Dakota | 75,811 |
| 85 |
 Senegal
|
74,336 |
| 86 |
 Kyrgyzstan
|
74,054 |
| 87 |
 Syria
Syria
|
70,900 |
| * | North Dakota | 69,001 |
| * | Missouri | 68,742 |
| * | Oklahoma | 68,595 |
| 88 |
 Cambodia
|
68,155 |
| 89 |
 Uruguay
|
67,576 |
| * | Washington | 66,456 |
| 90 |
 Suriname
|
61,972 |
| 91 |
 Tunisia
|
59,985 |
| * | Georgia | 57,513 |
| * | Michigan | 56,539 |
| * | Iowa | 55,857 |
| * | Illinois | 55,519 |
| 92 |
 Nepal
Nepal
|
55,348 |
| * | Wisconsin | 54,158 |
| * | Florida | 53,625 |
| 93 |
 Tajikistan
|
53,587 |
| * | Arkansas | 52,035 |
| * | Alabama | 50,645 |
| 94 |
 Bangladesh
|
50,186 |
| 95 |
 Greece
|
49,769 |
| * | North Carolina | 48,618 |
| * | New York | 47,126 |
| * | Mississippi | 46,923 |
| 96 |
 Eritrea
|
46,787 |
| 97 |
 North Korea
|
46,491 |
| 98 |
 Nicaragua
|
46,464 |
| * | Pennsylvania | 44,743 |
| 99 |
 Benin
Benin
|
43,537 |
| * | Louisiana | 43,204 |
| 100 |
 Honduras
|
43,201 |
| 101 |
 Bulgaria
|
41,915 |
| 102 |
 Guatemala
|
41,375 |
| * | Tennessee | 41,235 |
| * | Ohio | 40,861 |
| 103 |
 Cuba
Cuba
|
40,077 |
| * | Virginia | 39,490 |
| * | Kentucky | 39,486 |
| 104 |
 Iceland
|
38,931 |
| 105 |
 South Korea
|
37,684 |
| 106 |
 Liberia
|
37,189 |
| 107 |
 Malawi
|
36,402 |
| * | Indiana | 35,826 |
| 108 |
 Portugal
|
35,369 |
| 109 |
 Hungary
|
35,236 |
| 110 |
 Jordan
|
34,284 |
| 111 |
 Serbia
|
32,467 |
| 112 |
 Azerbaijan
|
31,911 |
| 113 |
 Austria
|
31,861 |
| * | Maine | 30,843 |
| * | South Carolina | 30,061 |
| 114 |
 Czech Republic
|
29,794 |
| 115 |
 Panama
|
28,641 |
| 116 |
 Sierra Leone
|
27,869 |
| 117 |
 UAE
UAE
|
27,421 |
| 118 |
 Georgia
|
26,830 |
| 119 |
 Ireland
|
26,599 |
| 120 |
 Lithuania
|
24,170 |
| * | West Virginia | 24,038 |
| 121 |
 Latvia
|
24,027 |
| 122 |
 Sri Lanka
|
23,884 |
| 123 |
 Croatia
|
21,606 |
| 124 |
 Togo
Togo
|
21,000 |
| 125 |
 Bosnia
|
19,768 |
| 126 |
 Costa Rica
|
19,714 |
| 127 |
 Dominican Republic
|
18,609 |
| 128 |
 Slovakia
|
18,564 |
| 129 |
 Estonia
|
16,498 |
| 130 |
 Denmark
|
15,444 |
| 131 |
 Switzerland
|
15,255 |
| 132 |
 Bhutan
|
14,726 |
| 133 |
 Taiwan
|
13,976 |
| 134 |
 Netherlands
|
13,000 |
| 135 |
 Moldova
|
12,714 |
| 136 |
 Belgium
|
11,774 |
| 137 |
 Lesotho
|
11,722 |
| 138 |
 Armenia
|
10,888 |
| 139 |
 Guinea-Bissau
|
10,857 |
| 140 |
 Equatorial Guinea
|
10,830 |
| 141 |
 Solomon Islands
|
10,807 |
| 142 |
 Haiti
Haiti
|
10,641 |
| 143 |
 Albania
|
10,579 |
| 144 |
 Burundi
|
9,915 |
| 145 |
 North Macedonia
|
9,737 |
| * | Maryland | 9,707 |
| 146 |
 Rwanda
|
9,525 |
| * | Vermont | 9,217 |
| * | New Hampshire | 8,953 |
| 147 |
 Djibouti
|
8,950 |
| 148 |
 Belize
|
8,807 |
| 149 |
 Israel
|
8,355 |
| 150 |
 El Salvador
|
8,000 |
| * | Massachusetts | 7,800 |
| 151 |
 Slovenia
|
7,774 |
| * | New Jersey | 7,354 |
| 152 |
 Fiji
Fiji
|
7,054 |
| 153 |
 Kuwait
|
6,880 |
| 154 |
 Eswatini
|
6,641 |
| * | Hawaii | 6,423 |
| 155 |
 East Timor
|
5,741 |
| 156 |
 Montenegro
|
5,193 |
| * | Connecticut | 4,842 |
| 157 |
 Vanuatu
|
4,707 |
| 158 |
 Qatar
Qatar
|
4,436 |
| 159 |
 Jamaica
|
4,181 |
| 160 |
 Lebanon
|
3,950 |
| 161 |
 Gambia
|
3,907 |
| 162 |
 Bahamas
|
3,865 |
| 163 |
 Cyprus
|
3,568 |
| * | Puerto Rico | 3,459 |
| 164 |
 Palestine
|
2,326 |
| 165 |
 Brunei
|
2,035 |
| 166 |
 Trinidad
|
1,981 |
| * | Delaware | 1,949 |
| 167 |
 Cape Verde
|
1,556 |
| 168 |
 Samoa
Samoa
|
1,073 |
| * | Rhode Island | 1,045 |
| 169 |
 Luxembourg
|
994 |
| 170 |
 Mauritius
|
771 |
| 171 |
 Comoros
|
719 |
| 172 |
 Sao Tome
|
371 |
| 173 |
 Kiribati
|
313 |
| 174 |
 Bahrain
|
309 |
| 175 |
 Dominica
|
289.6 |
| 176 |
 Tonga
Tonga
|
278 |
| 177 |
 Singapore
|
277.2 |
| 178 |
 Saint Lucia
|
235.5 |
| * | Guam | 209.7 |
| 179 |
 Andorra
|
181.5 |
| * | Northern Mariana Islands | 179.2 |
| 180 |
 Palau
Palau
|
177.6 |
| 181 |
 Seychelles
|
177.6 |
| 182 |
 Curacao
|
171.4 |
| 183 |
 Antigua
|
169.9 |
| 184 |
 Barbados
|
166 |
| 185 |
 Saint Vincent
|
150.6 |
| * | US Virgin Islands | 133.7 |
| 186 |
 Grenada
|
131.3 |
| 187 |
 Malta
Malta
|
123.6 |
| 188 |
 Maldives
|
115.1 |
| 189 |
 Saint Kitts
|
100.4 |
| 190 |
 Cayman Islands
|
92.7 |
| * | American Samoa | 76.4 |
| 191 |
 Marshall Islands
|
69.5 |
| 192 |
 Liechtenstein
|
61.8 |
| * | District of Columbia | 61 |
| 193 |
 San Marino
|
23.2 |
| 194 |
 Tuvalu
|
11.6 |
| 195 |
 Nauru
Nauru
|
7.72 |
| 196 |
 Monaco
|
0.8 |
| 197 |
 Vatican
|
0.17 |
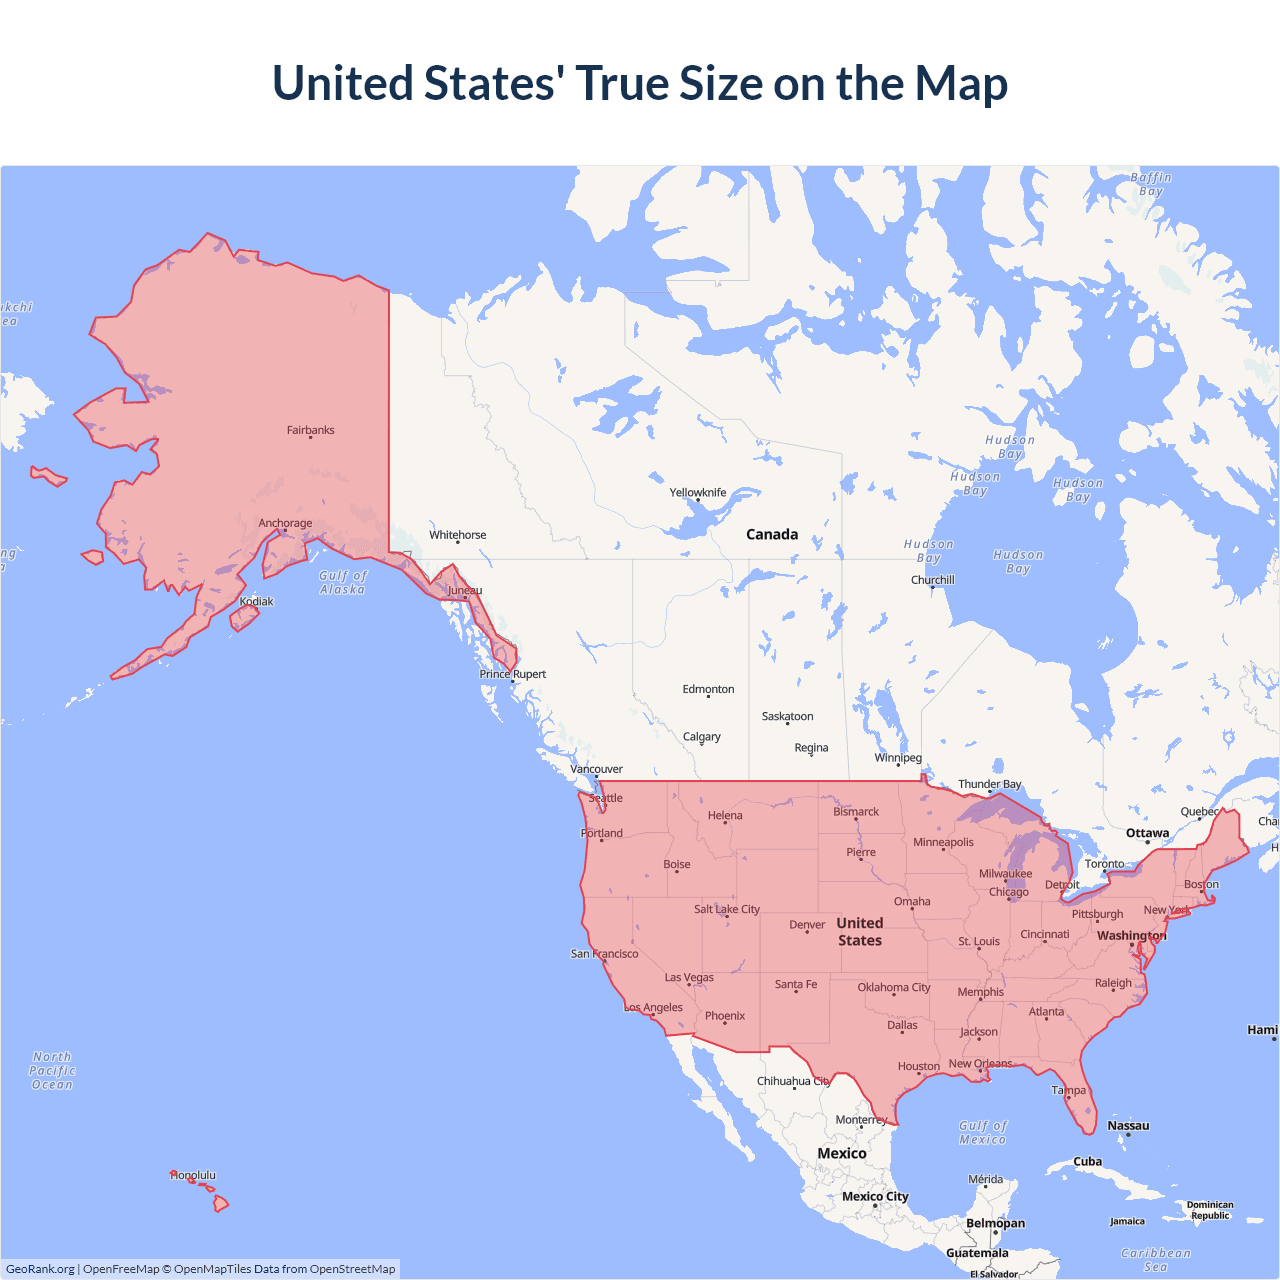
United States' size on the map
Data sources: World Bank | Agriculture & Rural Development (2026, retrieved 2026-07-08).
GeoRank.org/size/united-states | CC BY
The map above outlines the borders of the United States but is not accurate for size comparison because it's a 2d map with Mercator projection that distorts territories near the poles. The farther a country is from the equator, the more magnified it appears. More about country size projections.
Compare countries by 7 more topics
Help us show the world through your eyes
Share a photo of your city and help others discover what it looks like to live there. Your contribution makes our data come alive.
Data sources:
- World Bank | Agriculture & Rural Development (2023–2026, retrieved 2026-07-08)
- Wikidata (2026, retrieved 2026-07-08)
- Central Intelligence Agency (CIA) (2025, retrieved 2026-07-08)
- U.S. Census Bureau (2025, retrieved 2026-07-08)
- United Nations | World Population Prospects (2026, retrieved 2026-07-08)
Total agricultural land encompasses all areas used for agriculture: territories under permanent and temporary crops and pastures. It includes land under flowering shrubs, fruit and nut trees, and vineyards, but excludes sites utilized for timber production.
Arable land encompasses fields utilized for temporary crop production, pastures, market or kitchen gardens, and temporarily fallowed land. Land abandoned due to shifting cultivation practices is not included.
Permanent cropland refers to farmland for the long-term cultivation of crops, such as coffee, cocoa, and rubber, which do not require replanting after each harvest. This category encompasses land with permanent crops like flowering shrubs, fruit and nut trees, and vines, but does not include land under trees for timber production.
Inland areas under water, such as large rivers, lakes, and some coastal waterways.
Creative Commons Attribution (CC BY) — you’re free to copy, share, remix, adapt, and use even commercially as long as you give appropriate credit and clearly indicate if you made changes. Other sources may be subject to different license terms.