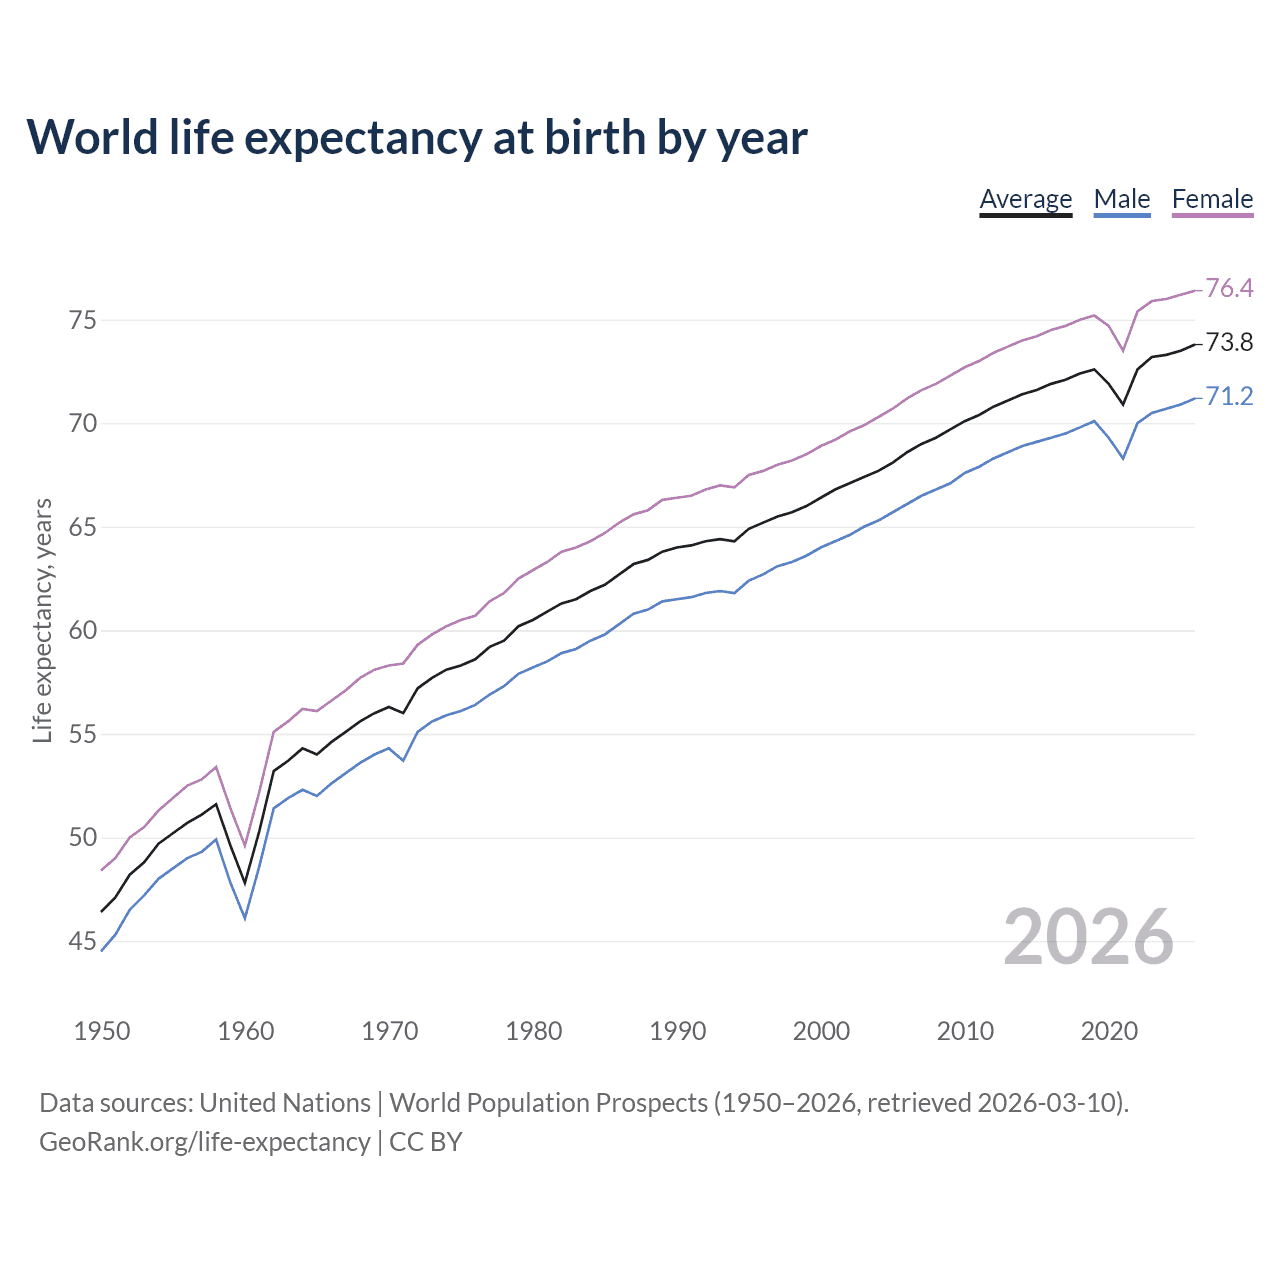
In 2026, the world's average life expectancy at birth is 73.8 years — 71.2 for men and 76.4 for women.
The dip in global life expectancy around 1960 was due to China’s Great Famine (1959–1961), triggered by the Great Leap Forward policies, poor weather, and agricultural mismanagement. The famine caused 15–30 million deaths, dragging down the global average despite continued improvements elsewhere.
World life expectancy at birth by year
| Year | Life expectancy, years | ||
|---|---|---|---|
| Total | Male | Female | |
| 2026 | 73.8 | 71.2 | 76.4 |
| 2025 | 73.5 | 70.9 | 76.2 |
| 2024 | 73.3 | 70.7 | 76 |
| 2023 | 73.2 | 70.5 | 75.9 |
| 2022 | 72.6 | 70 | 75.4 |
| 2021 | 70.9 | 68.3 | 73.5 |
| 2020 | 71.9 | 69.3 | 74.7 |
| 2019 | 72.6 | 70.1 | 75.2 |
| 2018 | 72.4 | 69.8 | 75 |
| 2017 | 72.1 | 69.5 | 74.7 |
| 2016 | 71.9 | 69.3 | 74.5 |
| 2015 | 71.6 | 69.1 | 74.2 |
| 2014 | 71.4 | 68.9 | 74 |
| 2013 | 71.1 | 68.6 | 73.7 |
| 2012 | 70.8 | 68.3 | 73.4 |
| 2011 | 70.4 | 67.9 | 73 |
| 2010 | 70.1 | 67.6 | 72.7 |
| 2009 | 69.7 | 67.1 | 72.3 |
| 2008 | 69.3 | 66.8 | 71.9 |
| 2007 | 69 | 66.5 | 71.6 |
| 2006 | 68.6 | 66.1 | 71.2 |
| 2005 | 68.1 | 65.7 | 70.7 |
| 2004 | 67.7 | 65.3 | 70.3 |
| 2003 | 67.4 | 65 | 69.9 |
| 2002 | 67.1 | 64.6 | 69.6 |
| 2001 | 66.8 | 64.3 | 69.2 |
| 2000 | 66.4 | 64 | 68.9 |
| 1999 | 66 | 63.6 | 68.5 |
| 1998 | 65.7 | 63.3 | 68.2 |
| 1997 | 65.5 | 63.1 | 68 |
| 1996 | 65.2 | 62.7 | 67.7 |
| 1995 | 64.9 | 62.4 | 67.5 |
| 1994 | 64.3 | 61.8 | 66.9 |
| 1993 | 64.4 | 61.9 | 67 |
| 1992 | 64.3 | 61.8 | 66.8 |
| 1991 | 64.1 | 61.6 | 66.5 |
| 1990 | 64 | 61.5 | 66.4 |
| 1989 | 63.8 | 61.4 | 66.3 |
| 1988 | 63.4 | 61 | 65.8 |
| 1987 | 63.2 | 60.8 | 65.6 |
| 1986 | 62.7 | 60.3 | 65.2 |
| 1985 | 62.2 | 59.8 | 64.7 |
| 1984 | 61.9 | 59.5 | 64.3 |
| 1983 | 61.5 | 59.1 | 64 |
| 1982 | 61.3 | 58.9 | 63.8 |
| 1981 | 60.9 | 58.5 | 63.3 |
| 1980 | 60.5 | 58.2 | 62.9 |
| 1979 | 60.2 | 57.9 | 62.5 |
| 1978 | 59.5 | 57.3 | 61.8 |
| 1977 | 59.2 | 56.9 | 61.4 |
| 1976 | 58.6 | 56.4 | 60.7 |
| 1975 | 58.3 | 56.1 | 60.5 |
| 1974 | 58.1 | 55.9 | 60.2 |
| 1973 | 57.7 | 55.6 | 59.8 |
| 1972 | 57.2 | 55.1 | 59.3 |
| 1971 | 56 | 53.7 | 58.4 |
| 1970 | 56.3 | 54.3 | 58.3 |
| 1969 | 56 | 54 | 58.1 |
| 1968 | 55.6 | 53.6 | 57.7 |
| 1967 | 55.1 | 53.1 | 57.1 |
| 1966 | 54.6 | 52.6 | 56.6 |
| 1965 | 54 | 52 | 56.1 |
| 1964 | 54.3 | 52.3 | 56.2 |
| 1963 | 53.7 | 51.9 | 55.6 |
| 1962 | 53.2 | 51.4 | 55.1 |
| 1961 | 50.3 | 48.6 | 52.2 |
| 1960 | 47.8 | 46.1 | 49.6 |
| 1959 | 49.6 | 47.8 | 51.4 |
| 1958 | 51.6 | 49.9 | 53.4 |
| 1957 | 51.1 | 49.3 | 52.8 |
| 1956 | 50.7 | 49 | 52.5 |
| 1955 | 50.2 | 48.5 | 51.9 |
| 1954 | 49.7 | 48 | 51.3 |
| 1953 | 48.8 | 47.2 | 50.5 |
| 1952 | 48.2 | 46.5 | 50 |
| 1951 | 47.1 | 45.3 | 49 |
| 1950 | 46.4 | 44.5 | 48.4 |
Data sources: United Nations | World Population Prospects (1950–2026, retrieved 2026-07-08).
GeoRank.org/life-expectancy | CC BY 
Life expectancy is the average age of death for a hypothetical cohort of newborns if they experienced the age-specific mortality rates of one particular year throughout their entire lives. It's a snapshot reflecting mortality rates in a given year that does not account for any future changes in those rates.
Healthy life expectancy at birth, defined by the World Health Organization as the average number of years a person can expect to live in full health, is 61.2 years for men and 63 for women, with a combined average of 62.1 years. People who reach 60 can expect an additional 14 healthy years, 13.3 for males and 14.7 for females.
World life expectancy calculator
This life expectancy calculator shows the odds of living to 100, 95, 90, and below based on the current age for both males and females on average across the globe, along with mean and median age of death. The calculations are based on the 2026 life tables (actuarial tables) from the UN World Population Prospects.
Mean remaining life expectancy: 48.0 Years
Mean expected age of death: 78.0 Years
Median expected age of death: 80.7 Years
Odds of living to
| Target age | Survival probability | ||
|---|---|---|---|
| Average | Male | Female | |
| 40 | 98.1% | 97.7% | 98.6% |
| 50 | 94.9% | 93.8% | 96.1% |
| 60 | 88.6% | 85.9% | 91.3% |
| 65 | 83.2% | 79.3% | 87.2% |
| 70 | 75.6% | 70.4% | 81.0% |
| 75 | 65.4% | 58.8% | 72.1% |
| 80 | 52.2% | 44.8% | 59.7% |
| 85 | 36.0% | 28.8% | 43.2% |
| 90 | 19.5% | 14.0% | 25.0% |
| 95 | 7.2% | 4.4% | 9.9% |
| 100 | 1.5% | 0.7% | 2.2% |
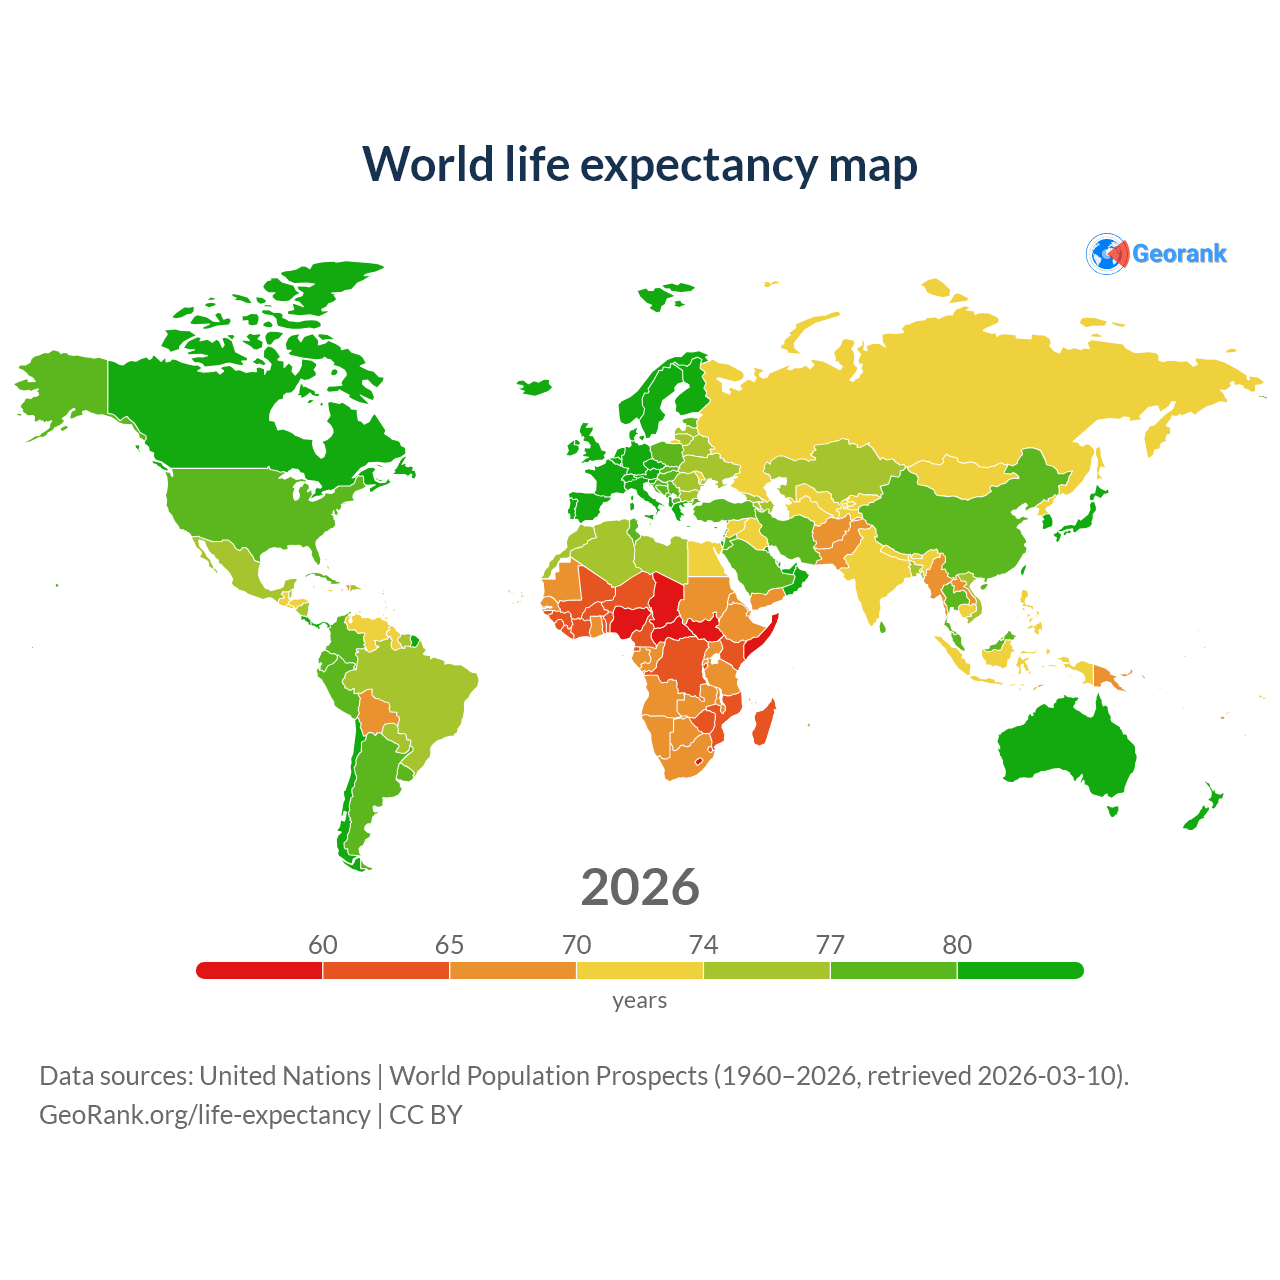
Life expectancy varies significantly. Select a country for life expectancy calculators and comparisons.
List of countries ranked by life expectancy
The table below ranks 197 countries by life expectancy at birth for both sexes. The last column shows the total life expectancy calculated from age 30 to exclude the influence of early-age mortality.
| Rank | Country | Life expectancy | Male | Female | Life expectancy at age 30 | Population |
|---|---|---|---|---|---|---|
| 1 |
 Monaco
|
86.7 | 84.8 | 88.8 | 87.3 | 38.3K |
| 2 |
 San Marino
|
86 | 84.5 | 87.4 | 86.3 | 34.1K |
| 3 |
 Japan
Japan
|
85.1 | 82.1 | 88.2 | 85.6 | 123M |
| 4 |
 South Korea
|
84.6 | 81.6 | 87.5 | 85 | 51.7M |
| 5 |
 Andorra
|
84.5 | 82.6 | 86.5 | 85.2 | 82.9K |
| 6 |
 Switzerland
|
84.4 | 82.5 | 86.2 | 84.9 | 9.09M |
| 7 |
 Australia
|
84.3 | 82.6 | 86.1 | 84.9 | 27.6M |
| 8 |
 Italy
Italy
|
84.2 | 82.1 | 86.1 | 84.6 | 58.9M |
| 9 |
 Singapore
|
84.1 | 81.7 | 86.6 | 84.5 | 6.11M |
| 10 |
 Spain
Spain
|
84.1 | 81.4 | 86.7 | 84.5 | 49.4M |
| 11 |
 Liechtenstein
|
84.1 | 82.4 | 85.6 | 84.8 | 41K |
| 12 |
 Malta
Malta
|
83.8 | 81.9 | 85.6 | 84.6 | 580K |
| 13 |
 Norway
|
83.8 | 82.3 | 85.2 | 84.2 | 5.61M |
| 14 |
 Sweden
|
83.7 | 82 | 85.5 | 84.3 | 10.6M |
| 15 |
 France
|
83.7 | 80.9 | 86.4 | 84.3 | 68.7M |
| 16 |
 Vatican
|
83.4 | 81.3 | 85.4 | 84.2 | 1K |
| 17 |
 UAE
UAE
|
83.4 | 82.6 | 84.6 | 84.2 | 11.5M |
| 18 |
 Iceland
|
83.3 | 82 | 84.7 | 83.7 | 392K |
| 19 |
 Canada
|
83.1 | 80.9 | 85.2 | 83.9 | 41.7M |
| 20 |
 Ireland
|
82.9 | 81 | 84.9 | 83.5 | 5.48M |
| 21 |
 Israel
|
82.9 | 80.8 | 84.9 | 83.5 | 10.1M |
| 22 |
 Portugal
|
82.9 | 80.1 | 85.5 | 83.4 | 10.8M |
| 23 |
 Qatar
Qatar
|
82.8 | 82.1 | 83.7 | 83.8 | 2.97M |
| 24 |
 Luxembourg
|
82.6 | 81.1 | 84.2 | 83.4 | 687K |
| 25 |
 Netherlands
|
82.6 | 81.1 | 84.1 | 83.1 | 18.1M |
| 26 |
 Belgium
|
82.6 | 80.5 | 84.7 | 83.2 | 11.9M |
| 27 |
 New Zealand
|
82.5 | 80.9 | 84.1 | 83.4 | 5.32M |
| 28 |
 Austria
|
82.5 | 80.2 | 84.7 | 83 | 9.21M |
| 29 |
 Finland
|
82.4 | 79.8 | 85 | 83 | 5.65M |
| 30 |
 Greece
|
82.4 | 79.9 | 84.7 | 82.8 | 10.4M |
| 31 |
 Denmark
|
82.4 | 80.6 | 84.2 | 82.9 | 6.01M |
| 32 |
 Cyprus
|
82.2 | 80.2 | 84.1 | 82.6 | 1.37M |
| 33 |
 Slovenia
|
82.1 | 79.5 | 84.7 | 82.5 | 2.13M |
| 34 |
 Germany
|
81.9 | 79.6 | 84.1 | 82.4 | 83.5M |
| 35 |
 United Kingdom
|
81.7 | 79.9 | 83.6 | 82.4 | 69.5M |
| 36 |
 Bahrain
|
81.7 | 81.2 | 82.4 | 82.7 | 1.6M |
| 37 |
 Maldives
|
81.7 | 80.4 | 83.3 | 82.4 | 530K |
| 38 |
 Chile
Chile
|
81.7 | 79.9 | 83.5 | 82.7 | 19.9M |
| 39 |
 Costa Rica
|
81.4 | 78.8 | 83.9 | 82.8 | 5.15M |
| 40 |
 Taiwan
|
81.1 | 78.3 | 84 | 81.9 | 23.3M |
| 41 |
 Kuwait
|
81 | 79.8 | 82.3 | 82.2 | 4.87M |
| 42 |
 Cayman Islands
|
80.9 | 78.6 | 83.3 | 81.8 | 75.8K |
| 43 |
 Oman
Oman
|
80.7 | 79.2 | 82.4 | 82 | 5.49M |
| 44 |
 Czech Republic
|
80.3 | 77.5 | 83 | 80.8 | 10.9M |
| 45 |
 Panama
|
80.1 | 77.3 | 83 | 82.1 | 4.57M |
| 46 |
 Albania
|
80.1 | 78.3 | 81.9 | 81.3 | 2.35M |
| 47 |
 United States
|
79.8 | 77.4 | 82.2 | 81 | 342M |
| 48 |
 Estonia
|
79.6 | 75.6 | 83.4 | 80.3 | 1.37M |
| 49 |
 Saudi Arabia
|
79.4 | 77.8 | 81.7 | 80.8 | 37M |
| 50 |
 Poland
|
79.2 | 75.5 | 82.7 | 79.9 | 36.4M |
| 51 |
 Croatia
|
79.1 | 76 | 82.1 | 79.7 | 3.88M |
| 52 |
 China
China
|
79 | 76.4 | 81.8 | 80.2 | 1.41B |
| 53 |
 Slovakia
|
78.8 | 75.6 | 82 | 79.6 | 5.41M |
| 54 |
 Cuba
Cuba
|
78.6 | 76.3 | 81 | 79.6 | 10.9M |
| 55 |
 Uruguay
|
78.6 | 74.8 | 82.3 | 80 | 3.38M |
| 56 |
 Bosnia
|
78.4 | 75.1 | 81.4 | 79.2 | 3.14M |
| 57 |
 Turkey
|
78.4 | 75.5 | 81.3 | 79.4 | 85.9M |
| 58 |
 Jordan
|
78.3 | 76.2 | 80.6 | 79.8 | 11.5M |
| 59 |
 Peru
Peru
|
78.3 | 76 | 80.6 | 80.3 | 34.6M |
| 60 |
 Colombia
|
78.3 | 75.6 | 80.9 | 80.3 | 53.4M |
| 61 |
 Iran
Iran
|
78.2 | 76.4 | 80.2 | 80 | 92.4M |
| 62 |
 Lebanon
|
78.2 | 76.2 | 80.1 | 80.1 | 5.85M |
| 63 |
 Antigua
|
78.1 | 75.1 | 80.7 | 79.6 | 94.2K |
| 64 |
 Sri Lanka
|
78 | 74.9 | 81 | 78.9 | 21.8M |
| 65 |
 Ecuador
|
77.9 | 75.3 | 80.6 | 80 | 18.3M |
| 66 |
 Argentina
|
77.8 | 75.3 | 80.3 | 79.4 | 45.9M |
| 67 |
 North Macedonia
|
77.8 | 75.6 | 80 | 78.7 | 1.82M |
| 68 |
 Montenegro
|
77.6 | 74.3 | 80.7 | 78.4 | 623K |
| 69 |
 Hungary
|
77.5 | 74.3 | 80.6 | 78.1 | 9.51M |
| 70 |
 Palestine
|
77.4 | 75 | 79.8 | 79 | 5.41M |
| 71 |
 Curacao
|
77.3 | 73.1 | 81.2 | 78.7 | 156K |
| 72 |
 Serbia
|
77.3 | 74.1 | 80.5 | 78 | 6.55M |
| 73 |
 Malaysia
|
77.2 | 74.8 | 79.8 | 78.3 | 36M |
| 74 |
 Tunisia
|
77.1 | 74.6 | 79.7 | 78.6 | 12.3M |
| 75 |
 Thailand
|
77.1 | 72.9 | 81.4 | 79.1 | 71.6M |
| 76 |
 Algeria
|
76.9 | 75.5 | 78.3 | 79.1 | 47.4M |
| 77 |
 Barbados
|
76.6 | 74.1 | 79 | 78.2 | 283K |
| 78 |
 Latvia
|
76.6 | 72.1 | 80.9 | 77.5 | 1.85M |
| 79 |
 Cape Verde
|
76.6 | 73.4 | 79.7 | 78 | 527K |
| 80 |
 Lithuania
|
76.5 | 71.8 | 81.1 | 77.4 | 2.89M |
| 81 |
 Romania
|
76.4 | 72.9 | 79.9 | 77.4 | 19M |
| 82 |
 Brazil
|
76.4 | 73.3 | 79.5 | 78.6 | 213M |
| 83 |
 Armenia
|
76.2 | 72 | 79.9 | 77.4 | 3.09M |
| 84 |
 Bulgaria
|
76.1 | 72.7 | 79.7 | 77.1 | 6.43M |
| 85 |
 Morocco
|
75.9 | 73.7 | 78.1 | 77.7 | 38.4M |
| 86 |
 Brunei
|
75.8 | 73.8 | 78.1 | 77.2 | 466K |
| 87 |
 Grenada
|
75.7 | 72.8 | 78.8 | 77.5 | 117K |
| 88 |
 Mexico
|
75.6 | 72.8 | 78.4 | 77.7 | 132M |
| 89 |
 Bangladesh
|
75.5 | 73.8 | 77.2 | 78 | 176M |
| 90 |
 Mauritius
|
75.4 | 72.5 | 78.6 | 77.2 | 1.24M |
| 91 |
 Nicaragua
|
75.4 | 72.8 | 77.9 | 77.2 | 7.01M |
| 92 |
 Libya
Libya
|
75.2 | 72.7 | 77.8 | 76.8 | 7.46M |
| 93 |
 Vietnam
|
75 | 70.4 | 79.6 | 78.1 | 102M |
| 94 |
 Ukraine
|
75 | 70.2 | 79.7 | 76.1 | 39M |
| 95 |
 Bahamas
|
75 | 71.4 | 78.6 | 77.2 | 403K |
| 96 |
 Georgia
|
75 | 70.1 | 79.5 | 76.2 | 3.94M |
| 97 |
 Belarus
|
75 | 70.1 | 79.5 | 75.7 | 9.09M |
| 98 |
 Azerbaijan
|
74.9 | 72 | 77.6 | 76.7 | 10.2M |
| 99 |
 Kazakhstan
|
74.8 | 70.6 | 78.8 | 76.2 | 20.8M |
| 100 |
 Paraguay
|
74.2 | 71.3 | 77.4 | 76.7 | 7.01M |
| 101 |
 Dominican Republic
|
74.1 | 70.9 | 77.4 | 77.6 | 11.5M |
| 102 |
 Belize
|
74.1 | 71.4 | 77 | 75.6 | 423K |
| 103 |
 Suriname
|
74 | 70.9 | 77.3 | 76 | 640K |
| 104 |
 North Korea
|
74 | 71.8 | 76.2 | 76.6 | 26.6M |
| 105 |
 Trinidad
|
73.9 | 70.8 | 77.1 | 76.2 | 1.37M |
| 106 |
 Bhutan
|
73.8 | 72.1 | 75.8 | 76 | 797K |
| 107 |
 Russia
|
73.7 | 67.9 | 79.5 | 74.9 | 144M |
| 108 |
 Syria
Syria
|
73.4 | 71 | 75.9 | 76 | 25.6M |
| 109 |
 Tonga
Tonga
|
73.4 | 69.8 | 76.8 | 75.1 | 104K |
| 110 |
 Honduras
|
73.4 | 70.8 | 76 | 75.4 | 11M |
| 111 |
 Seychelles
|
73.3 | 70.4 | 77 | 75.1 | 123K |
| 112 |
 Saint Lucia
|
73.2 | 69.7 | 76.7 | 75.2 | 180K |
| 113 |
 Guatemala
|
73 | 70.7 | 75.4 | 75.9 | 18.7M |
| 114 |
 Venezuela
|
73 | 69.2 | 77 | 76.5 | 28.5M |
| 115 |
 Uzbekistan
|
72.8 | 69.8 | 75.8 | 74.7 | 37.1M |
| 116 |
 El Salvador
|
72.7 | 68.2 | 76.9 | 75.1 | 6.37M |
| 117 |
 India
India
|
72.7 | 71.2 | 74.4 | 75.6 | 1.46B |
| 118 |
 Iraq
Iraq
|
72.6 | 70.7 | 74.4 | 75.2 | 47M |
| 119 |
 Saint Kitts
|
72.6 | 69 | 76.4 | 74.6 | 46.9K |
| 120 |
 Mongolia
|
72.5 | 68 | 77.1 | 74 | 3.57M |
| 121 |
 Tajikistan
|
72.2 | 69.9 | 74.5 | 74.6 | 10.8M |
| 122 |
 Egypt
Egypt
|
72.2 | 70 | 74.4 | 73.9 | 118M |
| 123 |
 Kyrgyzstan
|
72.1 | 68.6 | 75.7 | 73.8 | 7.34M |
| 124 |
 Samoa
Samoa
|
72.1 | 70.2 | 74.1 | 74.3 | 219K |
| 125 |
 Vanuatu
|
72 | 69.9 | 74.5 | 74.2 | 335K |
| 126 |
 Jamaica
|
71.9 | 69.3 | 74.4 | 74.1 | 2.84M |
| 127 |
 Saint Vincent
|
71.7 | 69 | 74.8 | 73.8 | 99.9K |
| 128 |
 Dominica
|
71.6 | 68.6 | 75.1 | 74.7 | 65.9K |
| 129 |
 Moldova
|
71.6 | 67 | 75.9 | 73.1 | 2.36M |
| 130 |
 Indonesia
|
71.6 | 69.4 | 73.8 | 74.1 | 286M |
| 131 |
 Nepal
Nepal
|
71.2 | 69.6 | 72.7 | 73.9 | 29.6M |
| 132 |
 Cambodia
|
71.1 | 68.4 | 73.7 | 74.8 | 17.8M |
| 133 |
 Solomon Islands
|
71 | 69.6 | 72.5 | 73.4 | 839K |
| 134 |
 Guyana
|
70.6 | 66.8 | 74.4 | 73.2 | 836K |
| 135 |
 Turkmenistan
|
70.5 | 67.2 | 73.3 | 73.8 | 7.62M |
| 136 |
 Sao Tome
|
70.3 | 66.7 | 74.3 | 72.6 | 240K |
| 137 |
 Philippines
|
70.2 | 67.2 | 73.2 | 73.1 | 117M |
| 138 |
 Yemen
Yemen
|
69.7 | 67.6 | 71.9 | 73.7 | 41.8M |
| 139 |
 Laos
Laos
|
69.7 | 67.5 | 72 | 73.5 | 7.87M |
| 140 |
 Palau
Palau
|
69.6 | 67.4 | 72.2 | 72.5 | 17.7K |
| 141 |
 Botswana
|
69.6 | 67 | 72.2 | 73.5 | 2.56M |
| 142 |
 Eritrea
|
69.4 | 67.2 | 71.5 | 74 | 3.61M |
| 143 |
 Senegal
|
69.4 | 67.4 | 71.5 | 73.3 | 18.9M |
| 144 |
 Mauritania
|
69.2 | 67.1 | 71.2 | 73 | 5.32M |
| 145 |
 Bolivia
|
69.1 | 66.6 | 71.7 | 73.7 | 12.6M |
| 146 |
 Uganda
|
68.9 | 65.9 | 71.8 | 73.1 | 51.4M |
| 147 |
 Gabon
Gabon
|
68.9 | 66.4 | 71.6 | 72.8 | 2.59M |
| 148 |
 Rwanda
|
68.5 | 66.1 | 70.6 | 72.3 | 14.6M |
| 149 |
 East Timor
|
68.3 | 66.7 | 70.1 | 72.8 | 1.42M |
| 150 |
 Ethiopia
|
68.1 | 64.9 | 71.6 | 73.6 | 135M |
| 151 |
 Pakistan
|
68.1 | 65.7 | 70.6 | 73.4 | 255M |
| 152 |
 Malawi
|
67.9 | 64.6 | 71.1 | 72.1 | 22.2M |
| 153 |
 Namibia
|
67.8 | 63.7 | 71.8 | 72 | 3.09M |
| 154 |
 Fiji
Fiji
|
67.8 | 65.7 | 69.9 | 69.9 | 933K |
| 155 |
 Tanzania
|
67.6 | 64.8 | 70.4 | 71.9 | 70.5M |
| 156 |
 Tuvalu
|
67.6 | 64.2 | 71.2 | 70.7 | 9.49K |
| 157 |
 Myanmar
|
67.5 | 64.4 | 70.8 | 72.1 | 54.9M |
| 158 |
 Comoros
|
67.5 | 65.4 | 69.7 | 72 | 883K |
| 159 |
 Marshall Islands
|
67.3 | 65.2 | 69.8 | 71 | 36.3K |
| 160 |
 Sudan
Sudan
|
66.9 | 63.8 | 70.2 | 73.2 | 51.7M |
| 161 |
 Zambia
|
66.9 | 64.4 | 69.3 | 71.9 | 21.9M |
| 162 |
 Kiribati
|
66.9 | 64.9 | 68.6 | 72.3 | 136K |
| 163 |
 Afghanistan
|
66.8 | 65.2 | 68.3 | 72.2 | 43.8M |
| 164 |
 South Africa
|
66.7 | 63.1 | 70.2 | 70.6 | 64.7M |
| 165 |
 Djibouti
|
66.6 | 64.1 | 69.2 | 72.8 | 1.18M |
| 166 |
 Papua New Guinea
|
66.5 | 64 | 69.5 | 71 | 10.8M |
| 167 |
 Gambia
|
66.5 | 64.7 | 68.2 | 72.4 | 2.82M |
| 168 |
 Congo
Congo
|
66.4 | 64.7 | 68.2 | 70.7 | 6.48M |
| 169 |
 Ghana
Ghana
|
66.1 | 63.7 | 68.6 | 72 | 35.1M |
| 170 |
 Haiti
Haiti
|
65.5 | 62.2 | 68.8 | 71.3 | 11.9M |
| 171 |
 Angola
|
65.2 | 62.6 | 67.7 | 71.4 | 39M |
| 172 |
 Guinea-Bissau
|
64.6 | 62.1 | 66.9 | 71.4 | 2.25M |
| 173 |
 Eswatini
|
64.5 | 61.6 | 67.4 | 69.8 | 1.26M |
| 174 |
 Cameroon
|
64.5 | 62.3 | 66.8 | 71 | 29.9M |
| 175 |
 Equatorial Guinea
|
64.3 | 62.6 | 66.3 | 71 | 1.94M |
| 176 |
 Madagascar
|
64.3 | 62.5 | 66.1 | 71.8 | 32.7M |
| 177 |
 Kenya
Kenya
|
64.2 | 62 | 66.5 | 68.9 | 57.5M |
| 178 |
 Mozambique
|
64.1 | 60.8 | 67.1 | 70.3 | 35.6M |
| 179 |
 Burundi
|
64.1 | 62 | 66.2 | 71.1 | 14.4M |
| 180 |
 Zimbabwe
|
63.6 | 61 | 65.9 | 68.5 | 17M |
| 181 |
 Togo
Togo
|
63.3 | 63 | 63.6 | 70.2 | 8.59M |
| 182 |
 Liberia
|
62.6 | 61.3 | 64 | 69.4 | 5.73M |
| 183 |
 Nauru
Nauru
|
62.6 | 60.7 | 64.6 | 67.3 | 12K |
| 184 |
 Ivory Coast
|
62.4 | 60.5 | 64.7 | 69.1 | 32.7M |
| 185 |
 DR Congo
|
62.4 | 60.2 | 64.6 | 71 | 113M |
| 186 |
 Sierra Leone
|
62.3 | 60.6 | 64.1 | 71 | 8.82M |
| 187 |
 Niger
Niger
|
61.9 | 60.9 | 62.9 | 71.8 | 27.9M |
| 188 |
 Burkina Faso
|
61.6 | 59.4 | 63.8 | 70.2 | 24.1M |
| 189 |
 Benin
Benin
|
61.3 | 59.8 | 62.8 | 70.5 | 14.8M |
| 190 |
 Guinea
|
61.2 | 59.9 | 62.4 | 71.1 | 15.1M |
| 191 |
 Mali
Mali
|
61.1 | 59.7 | 62.6 | 70.2 | 25.2M |
| 192 |
 Somalia
|
59.3 | 56.8 | 61.9 | 70.2 | 19.7M |
| 193 |
 Lesotho
|
58.6 | 55.8 | 61.3 | 65.4 | 2.36M |
| 194 |
 CAR
CAR
|
58.2 | 56 | 60.1 | 67.2 | 5.51M |
| 195 |
 South Sudan
|
58 | 55 | 61 | 69.1 | 12.2M |
| 196 |
 Chad
Chad
|
55.6 | 53.7 | 57.6 | 67.4 | 21M |
| 197 |
 Nigeria
|
55 | 54.6 | 55.3 | 67.2 | 238M |
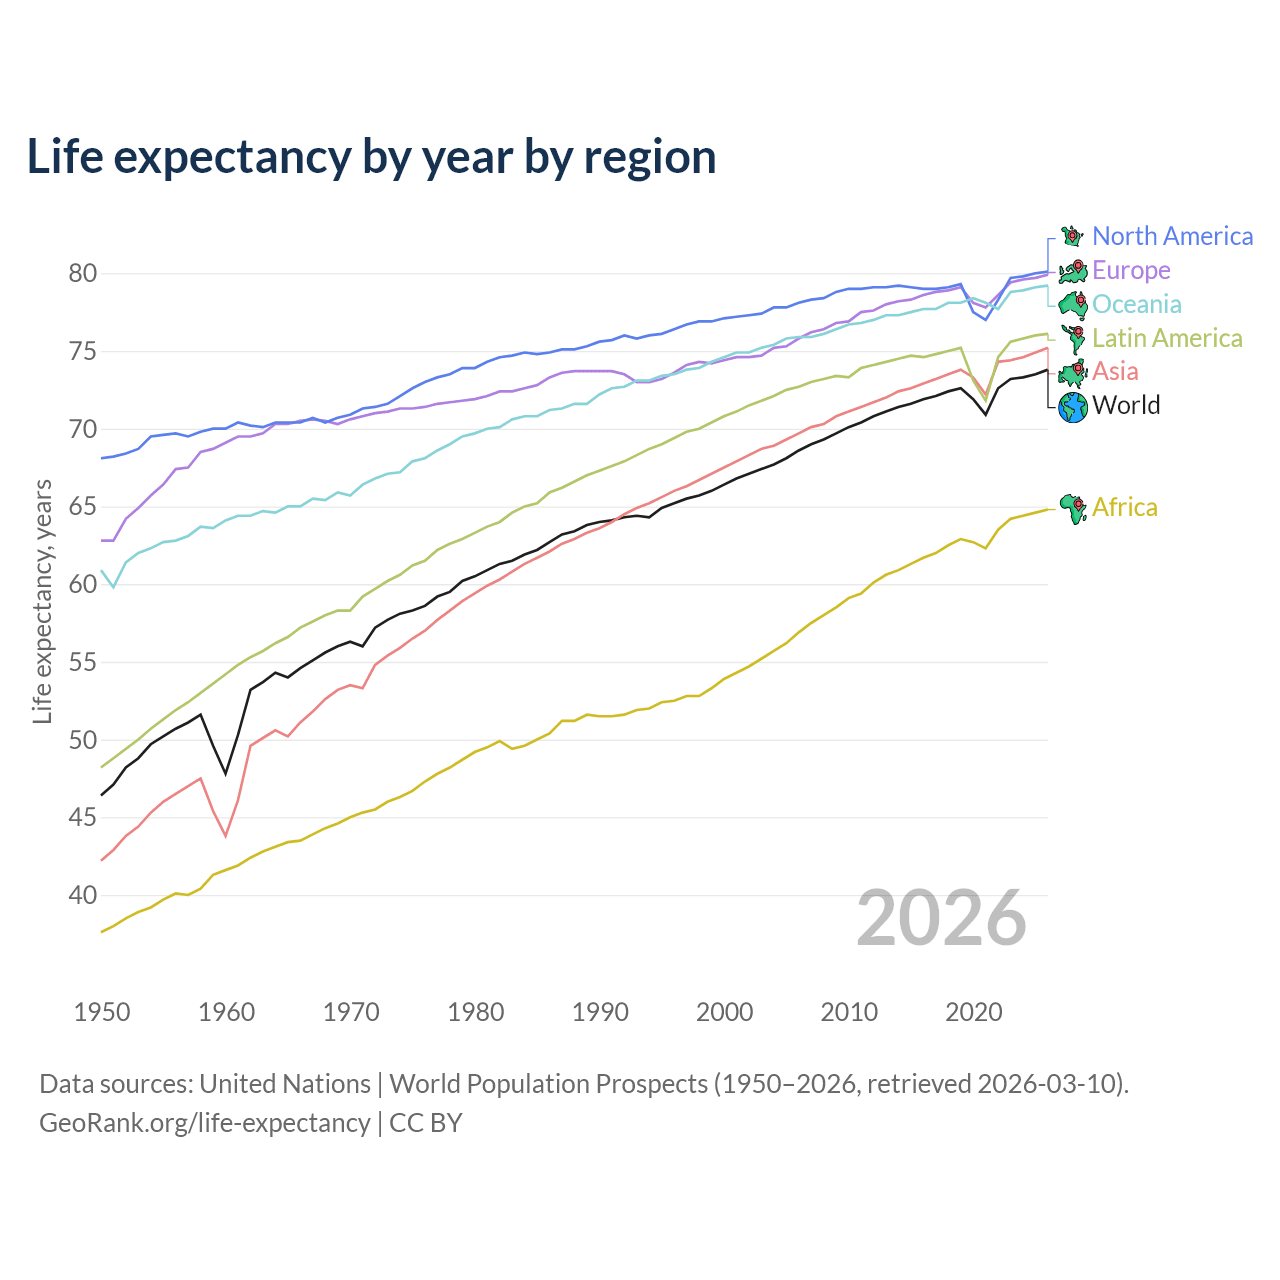
Life expectancy by year by region
| Year | Life expectancy, years | ||||||
|---|---|---|---|---|---|---|---|
| World | Asia | Africa | Europe | Latin America | North America | Oceania | |
| 2026 | 73.8 | 75.2 | 64.8 | 79.9 | 76.1 | 80.1 | 79.2 |
| 2025 | 73.5 | 74.8 | 64.6 | 79.8 | 76 | 80 | 79 |
| 2024 | 73.3 | 74.6 | 64.4 | 79.6 | 75.8 | 79.8 | 78.9 |
| 2023 | 73.2 | 74.4 | 64.2 | 79.4 | 75.6 | 79.7 | 78.8 |
| 2022 | 72.6 | 74.2 | 63.5 | 78.6 | 74.6 | 78.3 | 77.7 |
| 2021 | 70.9 | 72.2 | 62.3 | 77.8 | 71.7 | 77 | 78.1 |
| 2020 | 71.9 | 73.3 | 62.7 | 78.1 | 73.1 | 77.5 | 78.4 |
| 2019 | 72.6 | 73.7 | 62.9 | 79.1 | 75.2 | 79.3 | 78.1 |
| 2018 | 72.4 | 73.5 | 62.5 | 78.9 | 75 | 79.1 | 78.1 |
| 2017 | 72.1 | 73.1 | 62 | 78.8 | 74.8 | 79 | 77.7 |
| 2016 | 71.9 | 72.9 | 61.6 | 78.6 | 74.6 | 79 | 77.7 |
| 2015 | 71.6 | 72.6 | 61.3 | 78.3 | 74.7 | 79.1 | 77.5 |
| 2014 | 71.4 | 72.3 | 60.9 | 78.2 | 74.5 | 79.2 | 77.3 |
| 2013 | 71.1 | 72 | 60.6 | 78 | 74.3 | 79.1 | 77.3 |
| 2012 | 70.8 | 71.7 | 60.1 | 77.6 | 74.1 | 79.1 | 77 |
| 2011 | 70.4 | 71.4 | 59.4 | 77.5 | 73.8 | 79 | 76.8 |
| 2010 | 70.1 | 71.1 | 59.1 | 76.9 | 73.3 | 79 | 76.7 |
| 2009 | 69.7 | 70.7 | 58.5 | 76.8 | 73.4 | 78.8 | 76.4 |
| 2008 | 69.3 | 70.3 | 58 | 76.4 | 73.2 | 78.4 | 76.1 |
| 2007 | 69 | 70.1 | 57.4 | 76.1 | 73 | 78.3 | 75.9 |
| 2006 | 68.6 | 69.7 | 56.8 | 75.8 | 72.7 | 78.1 | 75.9 |
| 2005 | 68.1 | 69.3 | 56.2 | 75.3 | 72.5 | 77.8 | 75.7 |
| 2004 | 67.7 | 68.9 | 55.7 | 75.2 | 72.1 | 77.8 | 75.4 |
| 2003 | 67.4 | 68.6 | 55.2 | 74.7 | 71.8 | 77.4 | 75.2 |
| 2002 | 67.1 | 68.3 | 54.7 | 74.6 | 71.5 | 77.3 | 74.9 |
| 2001 | 66.8 | 67.9 | 54.3 | 74.6 | 71 | 77.2 | 74.9 |
| 2000 | 66.4 | 67.5 | 53.9 | 74.4 | 70.8 | 77.1 | 74.6 |
| 1999 | 66 | 67 | 53.2 | 74.2 | 70.4 | 76.9 | 74.3 |
| 1998 | 65.7 | 66.7 | 52.8 | 74.3 | 70 | 76.9 | 73.9 |
| 1997 | 65.5 | 66.3 | 52.7 | 74.1 | 69.8 | 76.7 | 73.8 |
| 1996 | 65.2 | 65.9 | 52.5 | 73.6 | 69.4 | 76.4 | 73.5 |
| 1995 | 64.9 | 65.5 | 52.4 | 73.2 | 69 | 76.1 | 73.4 |
| 1994 | 64.3 | 65.2 | 52 | 73.1 | 68.6 | 76 | 73.1 |
| 1993 | 64.4 | 64.9 | 51.9 | 73 | 68.3 | 75.8 | 73.1 |
| 1992 | 64.3 | 64.5 | 51.5 | 73.5 | 67.9 | 76 | 72.7 |
| 1991 | 64.1 | 64 | 51.5 | 73.7 | 67.6 | 75.7 | 72.6 |
| 1990 | 64 | 63.6 | 51.5 | 73.7 | 67.3 | 75.6 | 72.2 |
| 1989 | 63.8 | 63.3 | 51.5 | 73.7 | 67 | 75.3 | 71.6 |
| 1988 | 63.4 | 62.9 | 51.2 | 73.7 | 66.6 | 75.1 | 71.6 |
| 1987 | 63.2 | 62.5 | 51.1 | 73.6 | 66.2 | 75.1 | 71.3 |
| 1986 | 62.7 | 62.1 | 50.4 | 73.3 | 65.9 | 74.9 | 71.2 |
| 1985 | 62.2 | 61.7 | 49.9 | 72.8 | 65.2 | 74.8 | 70.8 |
| 1984 | 61.9 | 61.2 | 49.6 | 72.6 | 65 | 74.9 | 70.8 |
| 1983 | 61.5 | 60.8 | 49.3 | 72.4 | 64.6 | 74.7 | 70.6 |
| 1982 | 61.3 | 60.3 | 49.9 | 72.4 | 64 | 74.6 | 70.1 |
| 1981 | 60.9 | 59.8 | 49.5 | 72.1 | 63.7 | 74.3 | 70 |
| 1980 | 60.5 | 59.4 | 49.1 | 71.9 | 63.3 | 73.9 | 69.7 |
| 1979 | 60.2 | 58.9 | 48.7 | 71.8 | 62.9 | 73.9 | 69.5 |
| 1978 | 59.5 | 58.2 | 48.2 | 71.7 | 62.6 | 73.5 | 69 |
| 1977 | 59.2 | 57.7 | 47.8 | 71.6 | 62.2 | 73.3 | 68.6 |
| 1976 | 58.6 | 57 | 47.3 | 71.4 | 61.5 | 73 | 68.1 |
| 1975 | 58.3 | 56.5 | 46.6 | 71.3 | 61.2 | 72.6 | 67.9 |
| 1974 | 58.1 | 55.9 | 46.2 | 71.3 | 60.6 | 72.1 | 67.2 |
| 1973 | 57.7 | 55.4 | 46 | 71.1 | 60.2 | 71.6 | 67.1 |
| 1972 | 57.2 | 54.8 | 45.5 | 71 | 59.7 | 71.4 | 66.8 |
| 1971 | 56 | 53.3 | 45.3 | 70.8 | 59.2 | 71.3 | 66.4 |
| 1970 | 56.3 | 53.5 | 45 | 70.6 | 58.3 | 70.9 | 65.7 |
| 1969 | 56 | 53.2 | 44.6 | 70.3 | 58.3 | 70.7 | 65.8 |
| 1968 | 55.6 | 52.6 | 44.3 | 70.5 | 58 | 70.4 | 65.4 |
| 1967 | 55.1 | 51.7 | 43.8 | 70.6 | 57.6 | 70.7 | 65.5 |
| 1966 | 54.6 | 51 | 43.5 | 70.5 | 57.2 | 70.4 | 65 |
| 1965 | 54 | 50.2 | 43.4 | 70.3 | 56.6 | 70.4 | 64.9 |
| 1964 | 54.3 | 50.6 | 43.1 | 70.3 | 56.2 | 70.4 | 64.6 |
| 1963 | 53.7 | 50 | 42.8 | 69.7 | 55.7 | 70.1 | 64.7 |
| 1962 | 53.2 | 49.5 | 42.4 | 69.5 | 55.3 | 70.2 | 64.4 |
| 1961 | 50.3 | 46.1 | 41.9 | 69.5 | 54.8 | 70.4 | 64.4 |
| 1960 | 47.8 | 43.8 | 41.6 | 69.1 | 54.2 | 70 | 64.1 |
| 1959 | 49.6 | 45.4 | 41.3 | 68.7 | 53.6 | 70 | 63.6 |
| 1958 | 51.6 | 47.5 | 40.4 | 68.5 | 53 | 69.8 | 63.7 |
| 1957 | 51.1 | 47 | 40 | 67.5 | 52.4 | 69.5 | 63.1 |
| 1956 | 50.7 | 46.5 | 40.1 | 67.4 | 51.8 | 69.7 | 62.8 |
| 1955 | 50.2 | 46 | 39.7 | 66.4 | 51.3 | 69.6 | 62.7 |
| 1954 | 49.7 | 45.3 | 39.2 | 65.7 | 50.7 | 69.5 | 62.3 |
| 1953 | 48.8 | 44.4 | 38.9 | 64.9 | 50 | 68.7 | 62 |
| 1952 | 48.2 | 43.8 | 38.4 | 64.2 | 49.4 | 68.4 | 61.3 |
| 1951 | 47.1 | 42.9 | 38 | 62.8 | 48.7 | 68.2 | 59.8 |
| 1950 | 46.4 | 42.2 | 37.6 | 62.8 | 48.1 | 68.1 | 60.9 |
Data sources: United Nations | World Population Prospects (1950–2026, retrieved 2026-07-08).
GeoRank.org/life-expectancy | CC BY
This chart highlights how life expectancy differs across regions: 80 years in North America, Europe, and Oceania; 75 in Asia and Latin America; and only 65 in Africa as of 2026 — lower than the first group had in 1960.
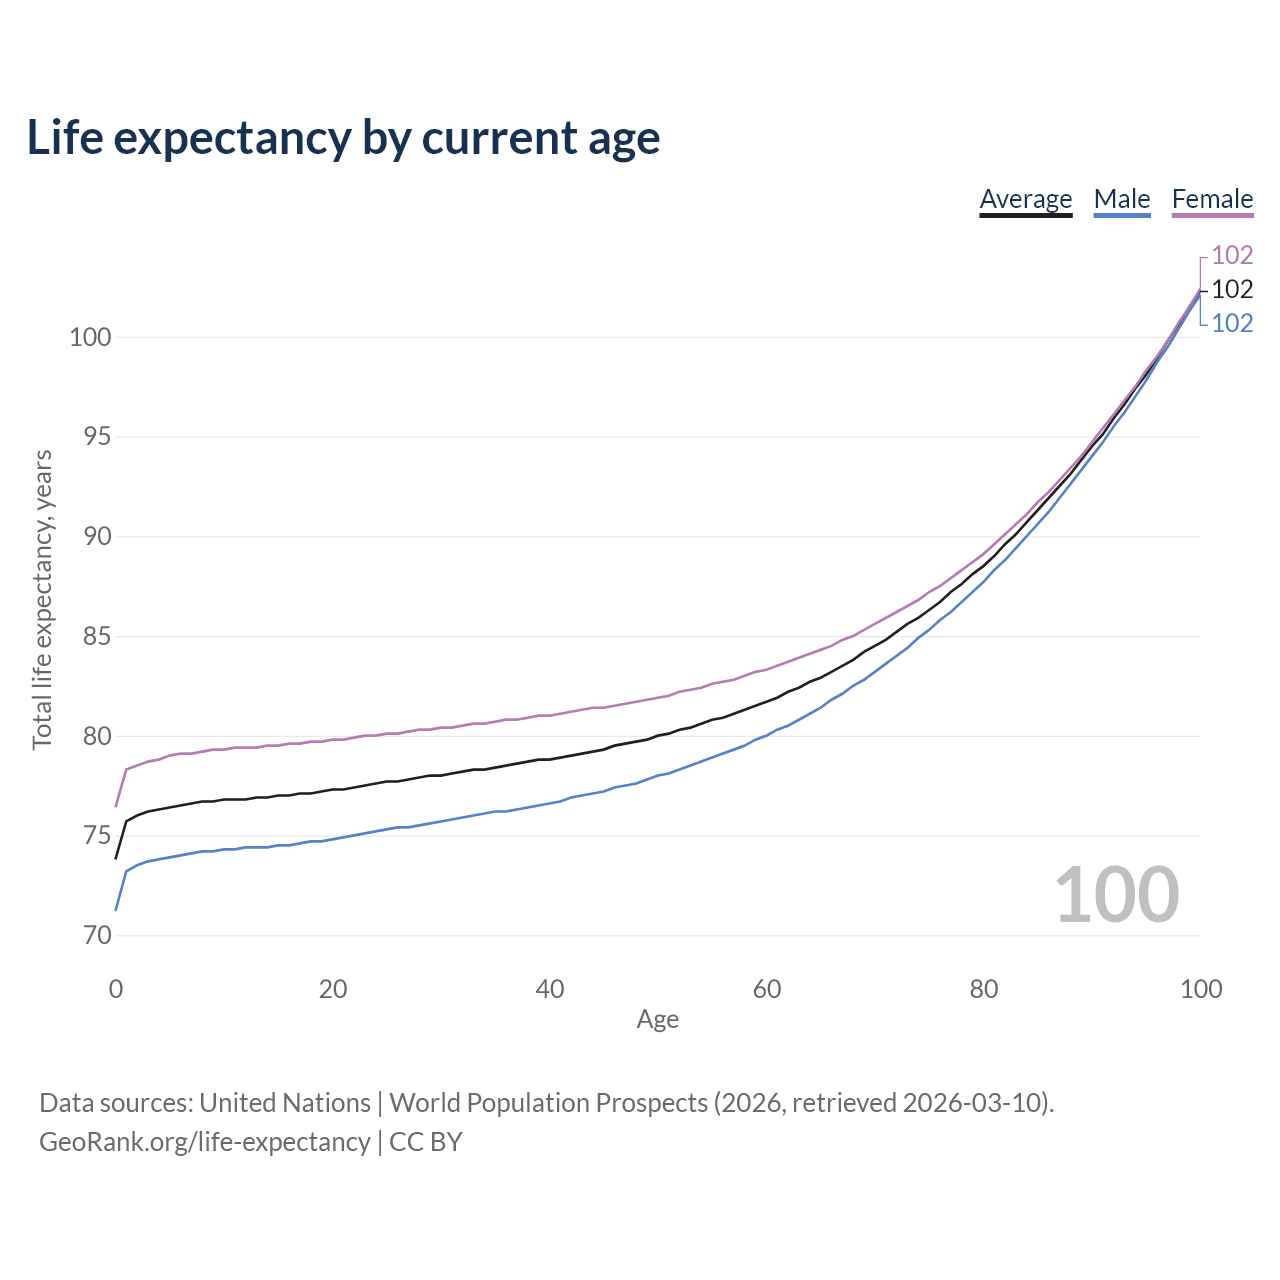
Life expectancy by current age
| Current age, years | Total life expectancy, years | ||
|---|---|---|---|
| Average | Male | Female | |
| 100 | 102.3 | 102.1 | 102.4 |
| 99 | 101.5 | 101.3 | 101.5 |
| 98 | 100.6 | 100.4 | 100.7 |
| 97 | 99.8 | 99.5 | 99.8 |
| 96 | 98.9 | 98.7 | 99 |
| 95 | 98.1 | 97.8 | 98.3 |
| 94 | 97.4 | 97 | 97.5 |
| 93 | 96.6 | 96.2 | 96.8 |
| 92 | 95.9 | 95.5 | 96.1 |
| 91 | 95.1 | 94.7 | 95.4 |
| 90 | 94.5 | 94 | 94.7 |
| 89 | 93.8 | 93.3 | 94 |
| 88 | 93.1 | 92.6 | 93.4 |
| 87 | 92.5 | 91.9 | 92.8 |
| 86 | 91.9 | 91.2 | 92.2 |
| 85 | 91.3 | 90.6 | 91.7 |
| 84 | 90.7 | 90 | 91.1 |
| 83 | 90.1 | 89.4 | 90.6 |
| 82 | 89.6 | 88.8 | 90.1 |
| 81 | 89 | 88.3 | 89.6 |
| 80 | 88.5 | 87.7 | 89.1 |
| 79 | 88.1 | 87.2 | 88.7 |
| 78 | 87.6 | 86.7 | 88.3 |
| 77 | 87.2 | 86.2 | 87.9 |
| 76 | 86.7 | 85.8 | 87.5 |
| 75 | 86.3 | 85.3 | 87.2 |
| 74 | 85.9 | 84.9 | 86.8 |
| 73 | 85.6 | 84.4 | 86.5 |
| 72 | 85.2 | 84 | 86.2 |
| 71 | 84.8 | 83.6 | 85.9 |
| 70 | 84.5 | 83.2 | 85.6 |
| 69 | 84.2 | 82.8 | 85.3 |
| 68 | 83.8 | 82.5 | 85 |
| 67 | 83.5 | 82.1 | 84.8 |
| 66 | 83.2 | 81.8 | 84.5 |
| 65 | 82.9 | 81.4 | 84.3 |
| 64 | 82.7 | 81.1 | 84.1 |
| 63 | 82.4 | 80.8 | 83.9 |
| 62 | 82.2 | 80.5 | 83.7 |
| 61 | 81.9 | 80.3 | 83.5 |
| 60 | 81.7 | 80 | 83.3 |
| 59 | 81.5 | 79.8 | 83.2 |
| 58 | 81.3 | 79.5 | 83 |
| 57 | 81.1 | 79.3 | 82.8 |
| 56 | 80.9 | 79.1 | 82.7 |
| 55 | 80.8 | 78.9 | 82.6 |
| 54 | 80.6 | 78.7 | 82.4 |
| 53 | 80.4 | 78.5 | 82.3 |
| 52 | 80.3 | 78.3 | 82.2 |
| 51 | 80.1 | 78.1 | 82 |
| 50 | 80 | 78 | 81.9 |
| 49 | 79.8 | 77.8 | 81.8 |
| 48 | 79.7 | 77.6 | 81.7 |
| 47 | 79.6 | 77.5 | 81.6 |
| 46 | 79.5 | 77.4 | 81.5 |
| 45 | 79.3 | 77.2 | 81.4 |
| 44 | 79.2 | 77.1 | 81.4 |
| 43 | 79.1 | 77 | 81.3 |
| 42 | 79 | 76.9 | 81.2 |
| 41 | 78.9 | 76.7 | 81.1 |
| 40 | 78.8 | 76.6 | 81 |
| 39 | 78.8 | 76.5 | 81 |
| 38 | 78.7 | 76.4 | 80.9 |
| 37 | 78.6 | 76.3 | 80.8 |
| 36 | 78.5 | 76.2 | 80.8 |
| 35 | 78.4 | 76.2 | 80.7 |
| 34 | 78.3 | 76.1 | 80.6 |
| 33 | 78.3 | 76 | 80.6 |
| 32 | 78.2 | 75.9 | 80.5 |
| 31 | 78.1 | 75.8 | 80.4 |
| 30 | 78 | 75.7 | 80.4 |
| 29 | 78 | 75.6 | 80.3 |
| 28 | 77.9 | 75.5 | 80.3 |
| 27 | 77.8 | 75.4 | 80.2 |
| 26 | 77.7 | 75.4 | 80.1 |
| 25 | 77.7 | 75.3 | 80.1 |
| 24 | 77.6 | 75.2 | 80 |
| 23 | 77.5 | 75.1 | 80 |
| 22 | 77.4 | 75 | 79.9 |
| 21 | 77.3 | 74.9 | 79.8 |
| 20 | 77.3 | 74.8 | 79.8 |
| 19 | 77.2 | 74.7 | 79.7 |
| 18 | 77.1 | 74.7 | 79.7 |
| 17 | 77.1 | 74.6 | 79.6 |
| 16 | 77 | 74.5 | 79.6 |
| 15 | 77 | 74.5 | 79.5 |
| 14 | 76.9 | 74.4 | 79.5 |
| 13 | 76.9 | 74.4 | 79.4 |
| 12 | 76.8 | 74.4 | 79.4 |
| 11 | 76.8 | 74.3 | 79.4 |
| 10 | 76.8 | 74.3 | 79.3 |
| 9 | 76.7 | 74.2 | 79.3 |
| 8 | 76.7 | 74.2 | 79.2 |
| 7 | 76.6 | 74.1 | 79.1 |
| 6 | 76.5 | 74 | 79.1 |
| 5 | 76.4 | 73.9 | 79 |
| 4 | 76.3 | 73.8 | 78.8 |
| 3 | 76.2 | 73.7 | 78.7 |
| 2 | 76 | 73.5 | 78.5 |
| 1 | 75.7 | 73.2 | 78.3 |
| 0 | 73.8 | 71.2 | 76.4 |
Data sources: United Nations | World Population Prospects (2026, retrieved 2026-07-08).
GeoRank.org/life-expectancy | CC BY
Life expectancy is often mistaken for the average lifespan of an adult. However, an adult has already survived the causes of early-age mortality and can expect to live longer than the figure calculated at birth.
Total world mean life expectancy at age 65 is 82.9 years, at 70 it's 84.5, at 75 it's 86.3, and at 80 it's 88.5 — higher than the 73.8 years calculated at birth.
The chart above accounts for remaining lifespan and displays the population-weighted mean life expectancy by age and gender.
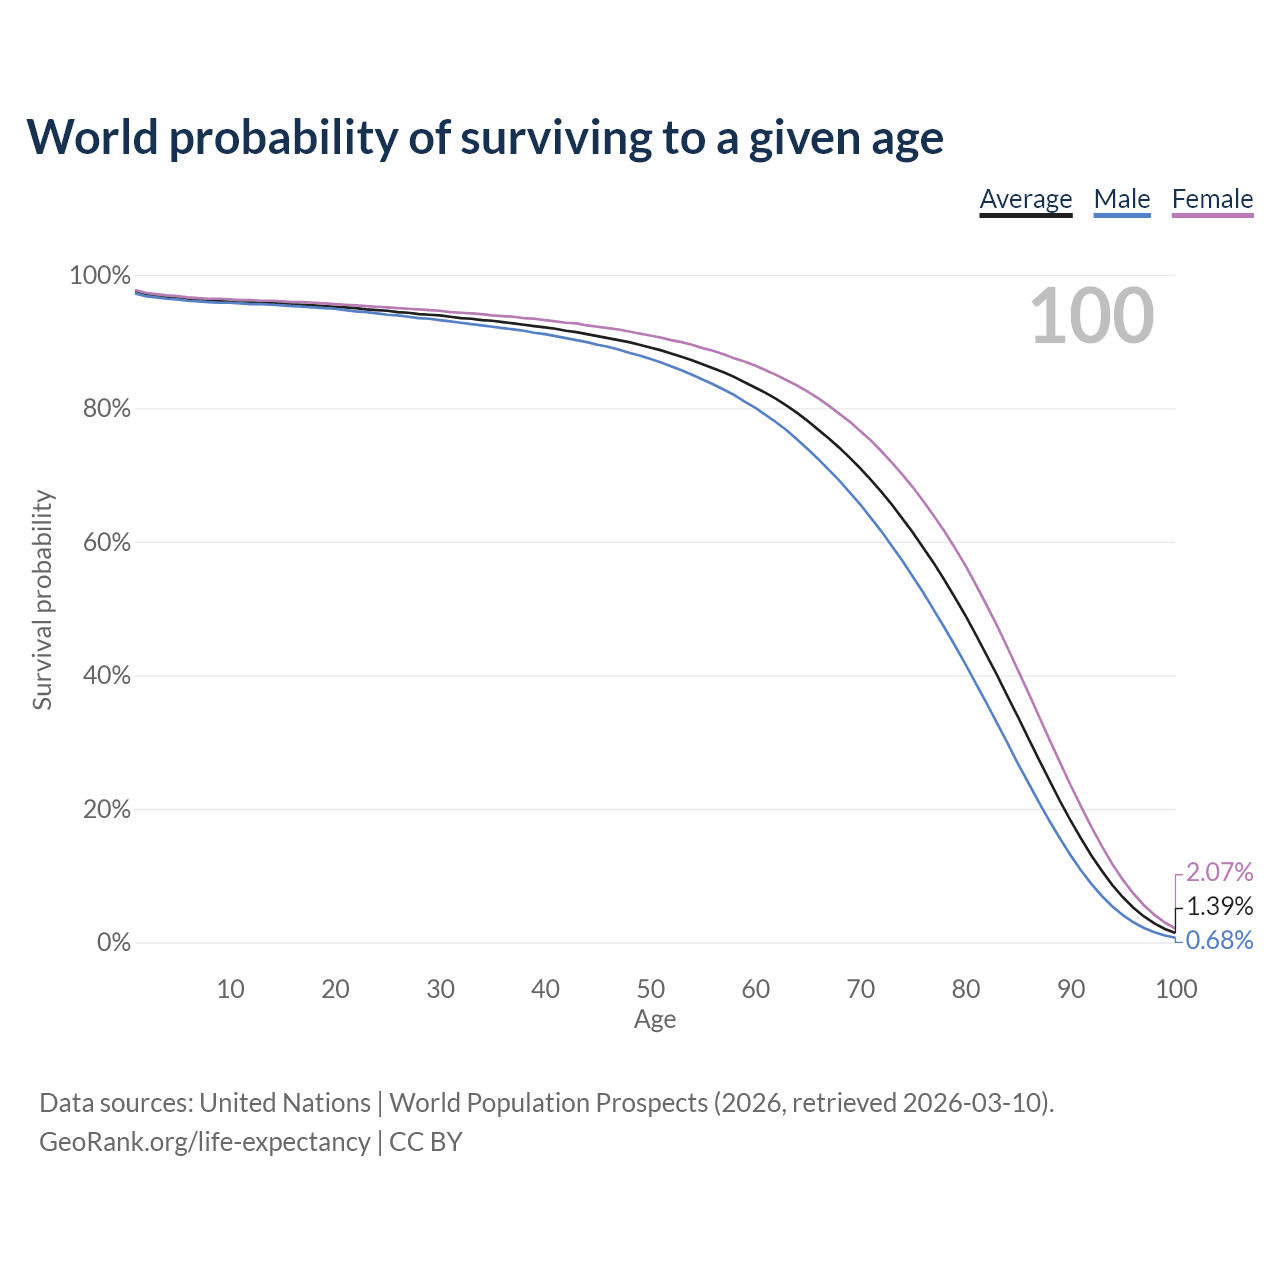
World probability of surviving to a given age
| Age | Survival probability | ||
|---|---|---|---|
| Average | Male | Female | |
| 100 | 1.39% | 0.68% | 2.07% |
| 99 | 2.01% | 1.03% | 2.97% |
| 98 | 2.84% | 1.51% | 4.12% |
| 97 | 3.88% | 2.16% | 5.56% |
| 96 | 5.18% | 3% | 7.31% |
| 95 | 6.74% | 4.07% | 9.36% |
| 94 | 8.57% | 5.37% | 11.7% |
| 93 | 10.7% | 6.94% | 14.4% |
| 92 | 13% | 8.75% | 17.3% |
| 91 | 15.6% | 10.8% | 20.4% |
| 90 | 18.3% | 13.1% | 23.6% |
| 89 | 21.2% | 15.6% | 27% |
| 88 | 24.3% | 18.2% | 30.4% |
| 87 | 27.4% | 21% | 33.9% |
| 86 | 30.6% | 23.9% | 37.4% |
| 85 | 33.8% | 26.8% | 40.8% |
| 84 | 36.9% | 29.9% | 44.2% |
| 83 | 40.1% | 32.9% | 47.5% |
| 82 | 43.1% | 35.9% | 50.6% |
| 81 | 46.1% | 38.8% | 53.6% |
| 80 | 49% | 41.7% | 56.5% |
| 79 | 51.7% | 44.5% | 59.1% |
| 78 | 54.3% | 47.2% | 61.6% |
| 77 | 56.8% | 49.8% | 63.9% |
| 76 | 59.1% | 52.4% | 66.1% |
| 75 | 61.4% | 54.8% | 68.2% |
| 74 | 63.5% | 57.2% | 70.1% |
| 73 | 65.6% | 59.4% | 71.9% |
| 72 | 67.5% | 61.6% | 73.6% |
| 71 | 69.3% | 63.6% | 75.2% |
| 70 | 71% | 65.6% | 76.6% |
| 69 | 72.6% | 67.4% | 78% |
| 68 | 74.1% | 69.2% | 79.2% |
| 67 | 75.5% | 70.8% | 80.4% |
| 66 | 76.8% | 72.4% | 81.5% |
| 65 | 78.1% | 73.9% | 82.5% |
| 64 | 79.3% | 75.3% | 83.4% |
| 63 | 80.4% | 76.7% | 84.2% |
| 62 | 81.4% | 77.9% | 85% |
| 61 | 82.3% | 79% | 85.7% |
| 60 | 83.1% | 80.1% | 86.4% |
| 59 | 83.9% | 81% | 87% |
| 58 | 84.7% | 82% | 87.5% |
| 57 | 85.4% | 82.8% | 88.1% |
| 56 | 86% | 83.6% | 88.6% |
| 55 | 86.6% | 84.3% | 89% |
| 54 | 87.2% | 85% | 89.5% |
| 53 | 87.7% | 85.7% | 89.9% |
| 52 | 88.2% | 86.3% | 90.2% |
| 51 | 88.7% | 86.9% | 90.6% |
| 50 | 89.1% | 87.4% | 90.9% |
| 49 | 89.5% | 87.9% | 91.2% |
| 48 | 89.9% | 88.3% | 91.5% |
| 47 | 90.2% | 88.8% | 91.8% |
| 46 | 90.5% | 89.2% | 92% |
| 45 | 90.8% | 89.5% | 92.2% |
| 44 | 91.1% | 89.9% | 92.4% |
| 43 | 91.4% | 90.2% | 92.7% |
| 42 | 91.6% | 90.5% | 92.8% |
| 41 | 91.9% | 90.8% | 93% |
| 40 | 92.1% | 91.1% | 93.2% |
| 39 | 92.3% | 91.3% | 93.4% |
| 38 | 92.5% | 91.6% | 93.5% |
| 37 | 92.7% | 91.8% | 93.7% |
| 36 | 92.9% | 92% | 93.8% |
| 35 | 93.1% | 92.2% | 93.9% |
| 34 | 93.2% | 92.4% | 94.1% |
| 33 | 93.4% | 92.6% | 94.2% |
| 32 | 93.5% | 92.8% | 94.3% |
| 31 | 93.7% | 93% | 94.4% |
| 30 | 93.9% | 93.2% | 94.6% |
| 29 | 94% | 93.4% | 94.7% |
| 28 | 94.1% | 93.5% | 94.8% |
| 27 | 94.3% | 93.7% | 94.9% |
| 26 | 94.4% | 93.9% | 95% |
| 25 | 94.6% | 94% | 95.1% |
| 24 | 94.7% | 94.2% | 95.2% |
| 23 | 94.8% | 94.4% | 95.3% |
| 22 | 95% | 94.5% | 95.4% |
| 21 | 95.1% | 94.7% | 95.5% |
| 20 | 95.2% | 94.9% | 95.6% |
| 19 | 95.3% | 95% | 95.7% |
| 18 | 95.4% | 95.1% | 95.8% |
| 17 | 95.5% | 95.2% | 95.9% |
| 16 | 95.6% | 95.3% | 95.9% |
| 15 | 95.7% | 95.4% | 96% |
| 14 | 95.8% | 95.5% | 96.1% |
| 13 | 95.8% | 95.6% | 96.1% |
| 12 | 95.9% | 95.6% | 96.2% |
| 11 | 96% | 95.7% | 96.2% |
| 10 | 96% | 95.8% | 96.3% |
| 9 | 96.1% | 95.8% | 96.4% |
| 8 | 96.2% | 95.9% | 96.4% |
| 7 | 96.3% | 96% | 96.5% |
| 6 | 96.4% | 96.1% | 96.6% |
| 5 | 96.5% | 96.3% | 96.8% |
| 4 | 96.7% | 96.4% | 96.9% |
| 3 | 96.9% | 96.6% | 97.1% |
| 2 | 97.1% | 96.8% | 97.3% |
| 1 | 97.4% | 97.2% | 97.7% |
Data sources: United Nations | World Population Prospects (2026, retrieved 2026-07-08).
GeoRank.org/life-expectancy | CC BY
This chart shows the odds of living to each age from birth. 83.1% of newborns are expected to live past 60 years, 71% past 70, 49% past 80, and 18.3% past 90.
For longevity rates starting from a different age, use the calculator provided above.
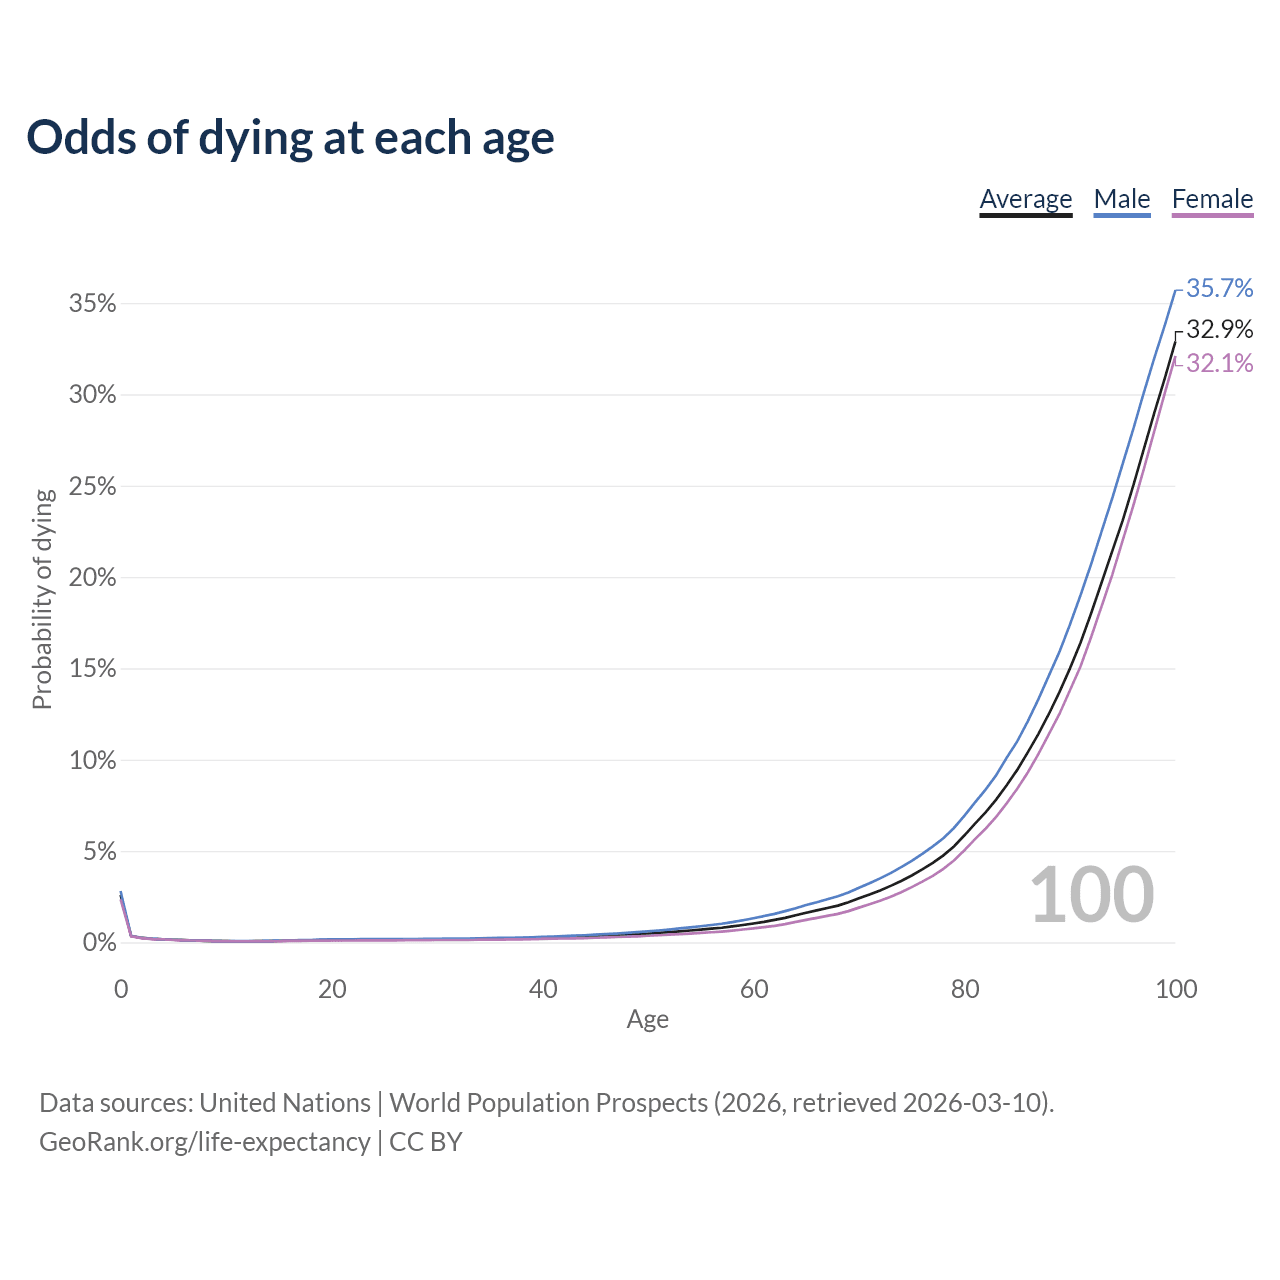
Odds of dying at each age
| Age | Probability of dying | ||
|---|---|---|---|
| Average | Male | Female | |
| 100 | 32.9% | 35.7% | 32.1% |
| 99 | 30.9% | 33.8% | 30.1% |
| 98 | 29% | 32% | 28% |
| 97 | 27% | 30.1% | 25.9% |
| 96 | 25% | 28.1% | 23.9% |
| 95 | 23.1% | 26.2% | 22% |
| 94 | 21.4% | 24.3% | 20.1% |
| 93 | 19.7% | 22.5% | 18.4% |
| 92 | 18% | 20.7% | 16.7% |
| 91 | 16.4% | 19% | 15.1% |
| 90 | 15% | 17.4% | 13.8% |
| 89 | 13.7% | 15.9% | 12.5% |
| 88 | 12.5% | 14.6% | 11.4% |
| 87 | 11.4% | 13.3% | 10.3% |
| 86 | 10.4% | 12.1% | 9.3% |
| 85 | 9.44% | 11% | 8.41% |
| 84 | 8.6% | 10.1% | 7.61% |
| 83 | 7.81% | 9.15% | 6.87% |
| 82 | 7.11% | 8.36% | 6.22% |
| 81 | 6.5% | 7.66% | 5.65% |
| 80 | 5.86% | 6.94% | 5.04% |
| 79 | 5.25% | 6.26% | 4.48% |
| 78 | 4.76% | 5.7% | 4.02% |
| 77 | 4.35% | 5.25% | 3.64% |
| 76 | 3.99% | 4.84% | 3.32% |
| 75 | 3.66% | 4.46% | 3.02% |
| 74 | 3.36% | 4.12% | 2.74% |
| 73 | 3.09% | 3.79% | 2.5% |
| 72 | 2.84% | 3.5% | 2.28% |
| 71 | 2.62% | 3.24% | 2.09% |
| 70 | 2.41% | 2.99% | 1.9% |
| 69 | 2.19% | 2.73% | 1.71% |
| 68 | 2.01% | 2.52% | 1.56% |
| 67 | 1.88% | 2.36% | 1.45% |
| 66 | 1.75% | 2.19% | 1.34% |
| 65 | 1.62% | 2.04% | 1.23% |
| 64 | 1.48% | 1.87% | 1.12% |
| 63 | 1.34% | 1.71% | 1% |
| 62 | 1.23% | 1.56% | 0.9% |
| 61 | 1.12% | 1.44% | 0.83% |
| 60 | 1.03% | 1.32% | 0.76% |
| 59 | 0.95% | 1.21% | 0.7% |
| 58 | 0.87% | 1.11% | 0.64% |
| 57 | 0.8% | 1.02% | 0.59% |
| 56 | 0.75% | 0.95% | 0.55% |
| 55 | 0.7% | 0.88% | 0.52% |
| 54 | 0.65% | 0.82% | 0.48% |
| 53 | 0.6% | 0.76% | 0.45% |
| 52 | 0.56% | 0.7% | 0.42% |
| 51 | 0.52% | 0.65% | 0.39% |
| 50 | 0.48% | 0.6% | 0.36% |
| 49 | 0.45% | 0.56% | 0.33% |
| 48 | 0.41% | 0.52% | 0.31% |
| 47 | 0.38% | 0.48% | 0.29% |
| 46 | 0.36% | 0.45% | 0.27% |
| 45 | 0.34% | 0.42% | 0.25% |
| 44 | 0.31% | 0.39% | 0.23% |
| 43 | 0.29% | 0.37% | 0.22% |
| 42 | 0.28% | 0.34% | 0.21% |
| 41 | 0.26% | 0.32% | 0.2% |
| 40 | 0.24% | 0.3% | 0.19% |
| 39 | 0.23% | 0.28% | 0.17% |
| 38 | 0.21% | 0.26% | 0.16% |
| 37 | 0.2% | 0.25% | 0.16% |
| 36 | 0.19% | 0.24% | 0.15% |
| 35 | 0.19% | 0.23% | 0.14% |
| 34 | 0.18% | 0.22% | 0.14% |
| 33 | 0.17% | 0.21% | 0.13% |
| 32 | 0.17% | 0.2% | 0.13% |
| 31 | 0.16% | 0.2% | 0.13% |
| 30 | 0.16% | 0.19% | 0.13% |
| 29 | 0.16% | 0.19% | 0.12% |
| 28 | 0.15% | 0.18% | 0.12% |
| 27 | 0.15% | 0.18% | 0.12% |
| 26 | 0.15% | 0.18% | 0.11% |
| 25 | 0.15% | 0.18% | 0.11% |
| 24 | 0.14% | 0.18% | 0.11% |
| 23 | 0.14% | 0.18% | 0.11% |
| 22 | 0.14% | 0.17% | 0.1% |
| 21 | 0.13% | 0.17% | 0.1% |
| 20 | 0.13% | 0.16% | 0.1% |
| 19 | 0.12% | 0.15% | 0.09% |
| 18 | 0.11% | 0.13% | 0.09% |
| 17 | 0.1% | 0.12% | 0.08% |
| 16 | 0.09% | 0.1% | 0.08% |
| 15 | 0.08% | 0.09% | 0.07% |
| 14 | 0.07% | 0.08% | 0.06% |
| 13 | 0.07% | 0.07% | 0.06% |
| 12 | 0.06% | 0.07% | 0.06% |
| 11 | 0.06% | 0.07% | 0.06% |
| 10 | 0.07% | 0.07% | 0.06% |
| 9 | 0.07% | 0.08% | 0.07% |
| 8 | 0.08% | 0.09% | 0.08% |
| 7 | 0.1% | 0.1% | 0.1% |
| 6 | 0.12% | 0.12% | 0.11% |
| 5 | 0.14% | 0.14% | 0.13% |
| 4 | 0.16% | 0.17% | 0.16% |
| 3 | 0.19% | 0.2% | 0.18% |
| 2 | 0.24% | 0.25% | 0.23% |
| 1 | 0.34% | 0.35% | 0.33% |
| 0 | 2.59% | 2.81% | 2.35% |
Data sources: United Nations | World Population Prospects (2026, retrieved 2026-07-08).
GeoRank.org/life-expectancy | CC BY
This chart displays the probability of dying at any given age, as mortality rates vary throughout a lifetime.
The world's average risk of dying is lowest at age 12 and increases afterward. The annual chance of dying is 2.59% in the birth year, 0.16% at age 30, 1.03% at 60, and 5.86% at 80.
Aging is often defined as the increasing probability of death with age. If a 20-year-old never aged and faced the same risk of dying every year, their life expectancy would be 772 years — 628 for males and 1,021 for females.
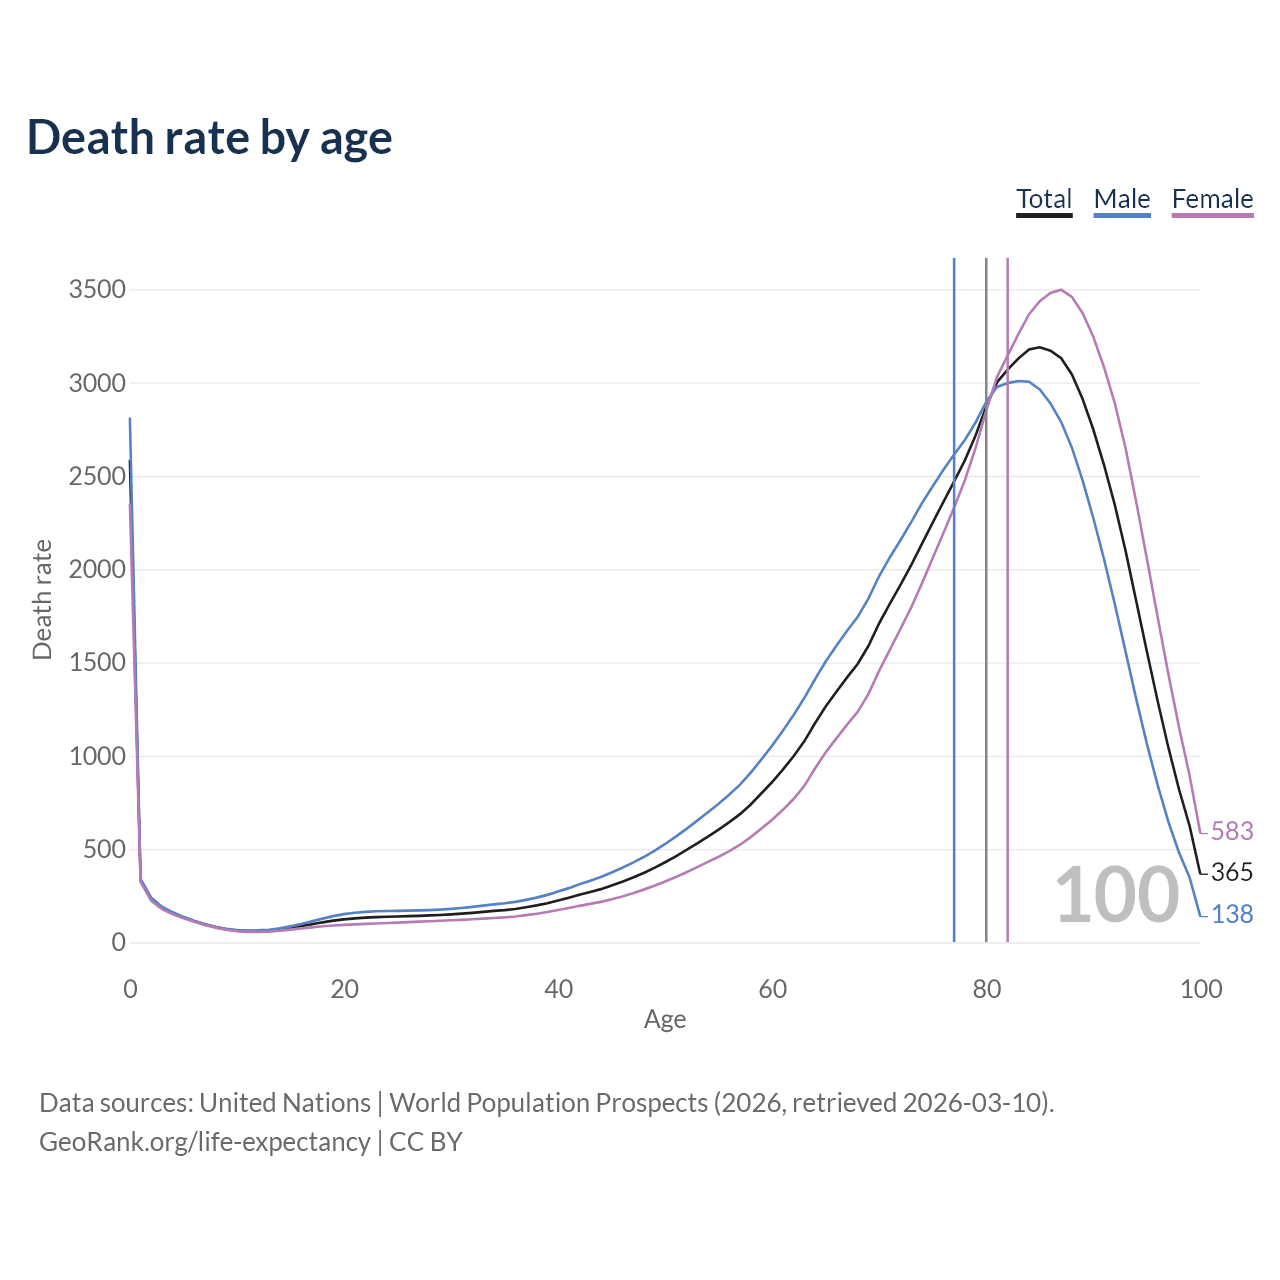
Death rate by age
| Age | Death rate | ||
|---|---|---|---|
| Total | Male | Female | |
| 100 | 365 | 137.7 | 583 |
| 99 | 623 | 347 | 893 |
| 98 | 821 | 482 | 1,154 |
| 97 | 1,047 | 649 | 1,441 |
| 96 | 1,296 | 845 | 1,746 |
| 95 | 1,560 | 1,065 | 2,057 |
| 94 | 1,831 | 1,306 | 2,363 |
| 93 | 2,102 | 1,562 | 2,652 |
| 92 | 2,346 | 1,815 | 2,891 |
| 91 | 2,558 | 2,054 | 3,082 |
| 90 | 2,748 | 2,274 | 3,245 |
| 89 | 2,912 | 2,476 | 3,371 |
| 88 | 3,043 | 2,651 | 3,459 |
| 87 | 3,130 | 2,788 | 3,497 |
| 86 | 3,171 | 2,888 | 3,480 |
| 85 | 3,189 | 2,963 | 3,436 |
| 84 | 3,177 | 3,004 | 3,366 |
| 83 | 3,129 | 3,008 | 3,259 |
| 82 | 3,069 | 2,997 | 3,146 |
| 81 | 3,001 | 2,976 | 3,029 |
| 80 | 2,871 | 2,896 | 2,849 |
| 79 | 2,716 | 2,786 | 2,648 |
| 78 | 2,583 | 2,692 | 2,476 |
| 77 | 2,470 | 2,614 | 2,330 |
| 76 | 2,361 | 2,533 | 2,194 |
| 75 | 2,249 | 2,444 | 2,060 |
| 74 | 2,137 | 2,354 | 1,925 |
| 73 | 2,023 | 2,253 | 1,796 |
| 72 | 1,917 | 2,156 | 1,681 |
| 71 | 1,815 | 2,064 | 1,568 |
| 70 | 1,710 | 1,963 | 1,456 |
| 69 | 1,589 | 1,843 | 1,332 |
| 68 | 1,493 | 1,745 | 1,236 |
| 67 | 1,420 | 1,670 | 1,167 |
| 66 | 1,343 | 1,589 | 1,093 |
| 65 | 1,264 | 1,505 | 1,018 |
| 64 | 1,174 | 1,410 | 931 |
| 63 | 1,077 | 1,309 | 838 |
| 62 | 997 | 1,218 | 768 |
| 61 | 926 | 1,134 | 710 |
| 60 | 859 | 1,054 | 657 |
| 59 | 799 | 981 | 610 |
| 58 | 739 | 909 | 564 |
| 57 | 687 | 845 | 523 |
| 56 | 644 | 792 | 489 |
| 55 | 604 | 743 | 459 |
| 54 | 567 | 697 | 431 |
| 53 | 530 | 652 | 403 |
| 52 | 495 | 608 | 376 |
| 51 | 461 | 567 | 350 |
| 50 | 429 | 527 | 326 |
| 49 | 399 | 490 | 303 |
| 48 | 372 | 457 | 282.5 |
| 47 | 347 | 427 | 263.1 |
| 46 | 325 | 400 | 245.9 |
| 45 | 305 | 374 | 231 |
| 44 | 285 | 350 | 216.9 |
| 43 | 269.4 | 330 | 205.8 |
| 42 | 254.8 | 311 | 195.7 |
| 41 | 238.8 | 290.4 | 184.2 |
| 40 | 224.1 | 272 | 173.3 |
| 39 | 209.7 | 254.2 | 162.4 |
| 38 | 198 | 239.7 | 153.4 |
| 37 | 188.1 | 227.8 | 145.6 |
| 36 | 178.7 | 216.6 | 138.2 |
| 35 | 172.7 | 209.3 | 133.5 |
| 34 | 168.3 | 203.6 | 130.3 |
| 33 | 163 | 196.7 | 126.8 |
| 32 | 158 | 190.1 | 123.6 |
| 31 | 153.5 | 184.2 | 120.6 |
| 30 | 150 | 179.5 | 118.2 |
| 29 | 146.7 | 175.6 | 115.7 |
| 28 | 144.1 | 172.9 | 113.2 |
| 27 | 142.2 | 171.2 | 110.9 |
| 26 | 140.1 | 169.7 | 108.3 |
| 25 | 138.3 | 168.7 | 105.7 |
| 24 | 136.9 | 168 | 103.5 |
| 23 | 134.9 | 166.4 | 101 |
| 22 | 132.1 | 163.3 | 98.5 |
| 21 | 128.3 | 158.4 | 96.1 |
| 20 | 123.3 | 151 | 93.7 |
| 19 | 116.3 | 140.4 | 90.3 |
| 18 | 107.3 | 127.2 | 86 |
| 17 | 96.9 | 112.3 | 80.5 |
| 16 | 86.6 | 97.9 | 74.5 |
| 15 | 77.1 | 85.3 | 68.2 |
| 14 | 68.7 | 74.8 | 62.1 |
| 13 | 62.7 | 67.5 | 57.6 |
| 12 | 59.7 | 63.7 | 55.5 |
| 11 | 59.9 | 63.3 | 56.2 |
| 10 | 63.1 | 66 | 60 |
| 9 | 69.9 | 72.4 | 67.3 |
| 8 | 81.2 | 83.3 | 78.8 |
| 7 | 95.7 | 97.9 | 93.5 |
| 6 | 113 | 115.6 | 110.3 |
| 5 | 133 | 136.5 | 129.3 |
| 4 | 155.8 | 160.7 | 150.5 |
| 3 | 184.6 | 191.1 | 177.8 |
| 2 | 230.7 | 238.5 | 222.5 |
| 1 | 332 | 340 | 324 |
| 0 | 2,586 | 2,813 | 2,349 |
Data sources: United Nations | World Population Prospects (2026, retrieved 2026-07-08).
GeoRank.org/life-expectancy | CC BY
Most deaths in the World occur at age 85 for both sexes combined, at 83 for males and 87 for females. The median age of death as indicated by vertical lines: 76.9 for men, 82.2 for women, and 79.6 combined — only half of each cohort is expected to live past that age.
This chart shows the number of deaths by age up to 100 for 3 cohorts of 100,000 newborns each — male, female, and both combined — illustrating how expected mortality is distributed throughout life.
Note that this chart does not show rates per 100,000 population, as those would be skewed by age structure and reflect the World's demographics more than its death rate.
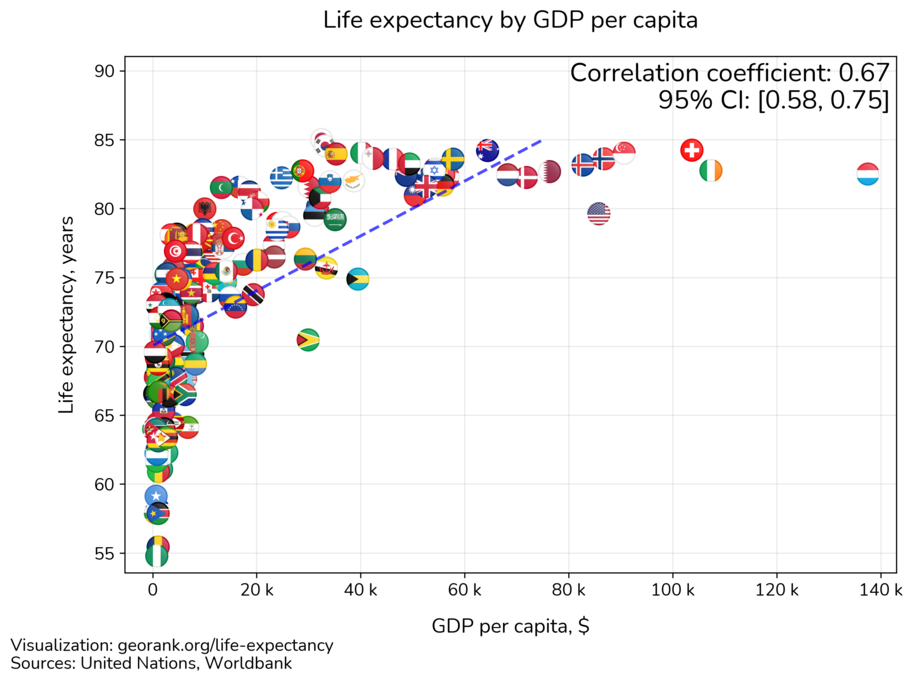
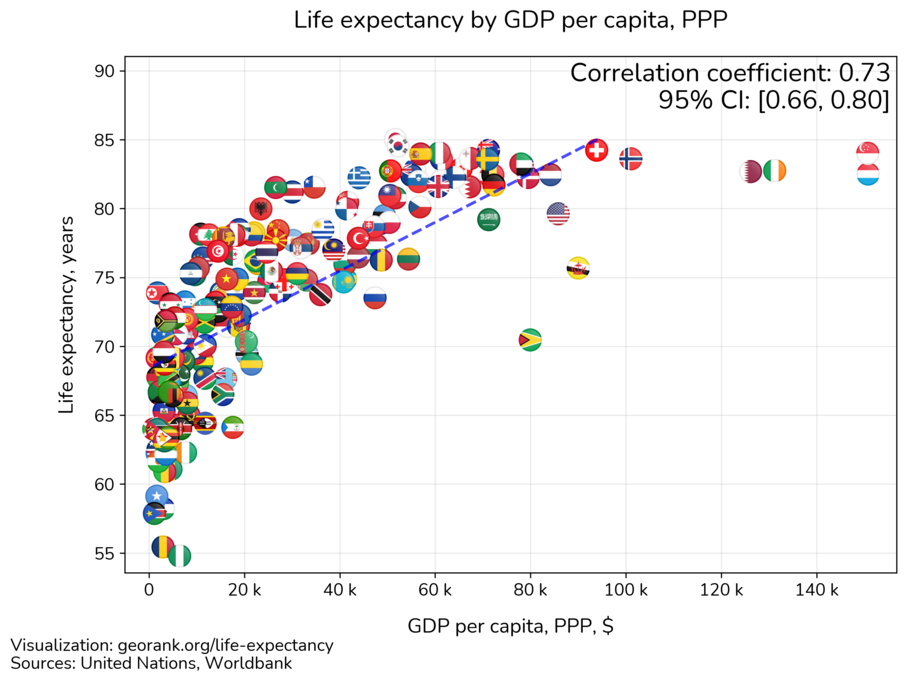
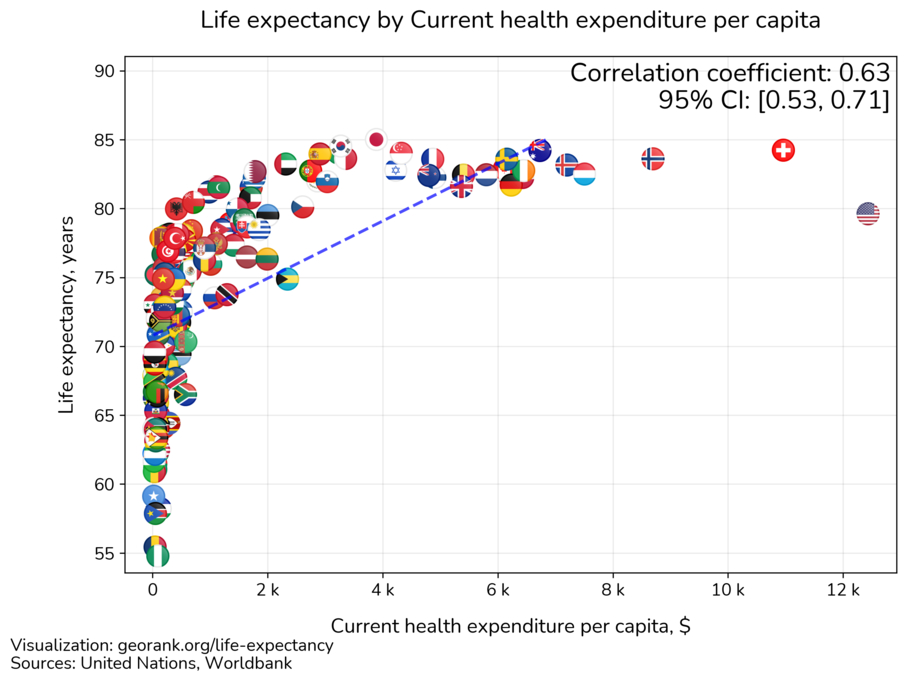
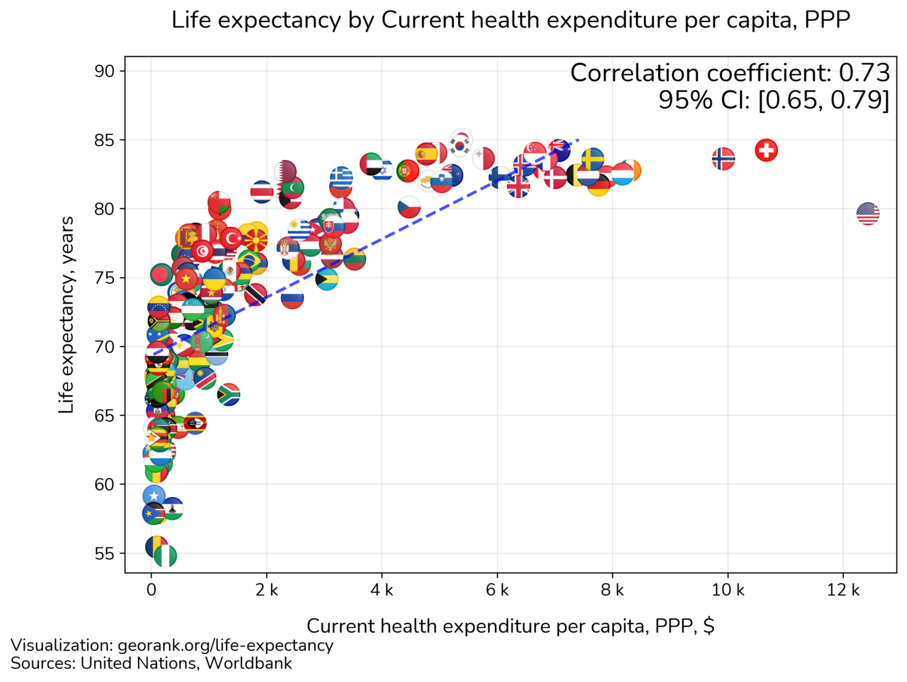
Life expectancy correlations: wealth and health expenditure
While correlation does not imply causation, the charts below show the relationship between life expectancy and GDP per capita, and between life expectancy and government health expenditure per person, both in nominal terms and adjusted for purchasing power parity. The closer the correlation coefficient is to ±1, the stronger the correlation.
Life expectancy and GDP per capita.
Correlation coefficient: 0.67 (95% Confidence Internal [CI] 0.57 to 0.74).
Life expectancy and GDP per capita adjusted for purchasing power parity.
Correlation coefficient: 0.73 (95% [CI] 0.65 to 0.79).
Life expectancy and Current health expenditure per capita.
Correlation coefficient: 0.62 (95% [CI] 0.52 to 0.71).
Life expectancy and Current health expenditure per capita adjusted for purchasing power parity.
Correlation coefficient: 0.72 (95% [CI] 0.64 to 0.79).
Help us show the world through your eyes
Share a photo of your city and help others discover what it looks like to live there. Your contribution makes our data come alive.
Data sources:
- United Nations | World Population Prospects (1950–2026, retrieved 2026-07-08)
- World Bank | Health (2025, retrieved 2026-07-08)
- World Health Organization (WHO) | Global Health Observatory (2021, retrieved 2026-07-08)
- Central Intelligence Agency (CIA) (2019, retrieved 2026-07-08)
- U.S. Census Bureau (2025, retrieved 2026-07-08)
- National Statistics, Taiwan (2025, retrieved 2026-07-08)
Creative Commons Attribution (CC BY) — you’re free to copy, share, remix, adapt, and use even commercially as long as you give appropriate credit and clearly indicate if you made changes. Other sources may be subject to different license terms.