Curacao is a high-income country with a population of 156K people. The capital and largest city is Willemstad, with 137K residents.
Curacao ranks 168/197 by GDP ($3.56B) and 56/197 by GDP per capita ($22,833). The top category for both exports and imports is transport & tourism services.
Main facts and rankings
 Curacao
|
Rank | |
|---|---|---|
| Population |
156236
|
179/197 |
| GDP |
$3.56B
2024 |
168/197 |
| GDP per capita |
$22,833
2024 |
56/197 |
| GDP per capita, PPP |
$32,693
2024 |
70/197 |
| Average annual personal income after taxes |
$15,072
2026 |
55/197 |
| Land area | 171.4 sq mi | 182/197 |
| Population density | 911 ppl/mi² | 26/197 |
| Fertility rate | 1.4 | 159/196 |
| Median age | 39.7 years | 49/196 |
| Life expectancy | 77.3 years | 71/197 |
Curacao trends dashboard: time-series charts
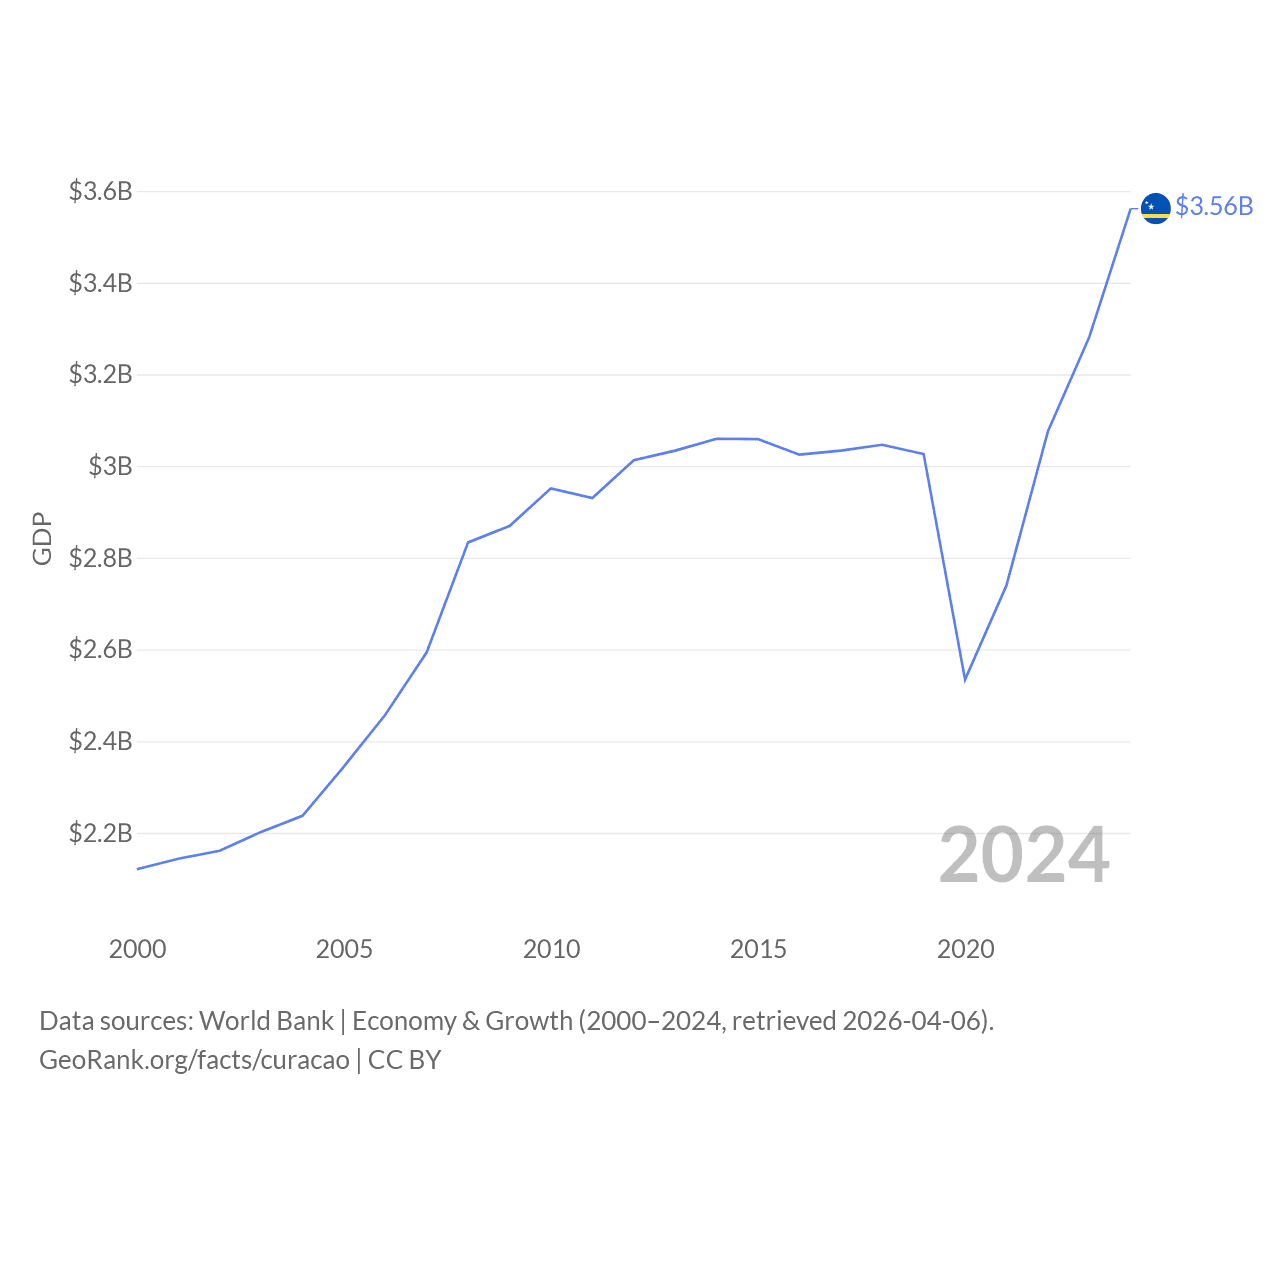
| Year | GDP |
|---|---|
| 2024 | $3,561,178,212 |
| 2023 | $3,281,419,330 |
| 2022 | $3,075,180,838 |
| 2021 | $2,739,594,358 |
| 2020 | $2,534,327,598 |
| 2019 | $3,026,124,134 |
| 2018 | $3,046,364,804 |
| 2017 | $3,033,433,240 |
| 2016 | $3,024,690,168 |
| 2015 | $3,058,779,218 |
| 2014 | $3,059,406,983 |
| 2013 | $3,033,568,603 |
| 2012 | $3,012,836,257 |
| 2011 | $2,930,092,235 |
| 2010 | $2,951,342,793 |
| 2009 | $2,869,153,184 |
| 2008 | $2,833,476,145 |
| 2007 | $2,593,831,508 |
| 2006 | $2,457,581,732 |
| 2005 | $2,344,637,263 |
| 2004 | $2,237,160,503 |
| 2003 | $2,202,117,374 |
| 2002 | $2,160,784,693 |
| 2001 | $2,143,450,726 |
| 2000 | $2,120,511,229 |
Data sources: World Bank | Economy & Growth (2000–2024, retrieved 2026-07-08).
GeoRank.org/facts/curacao | CC BY 
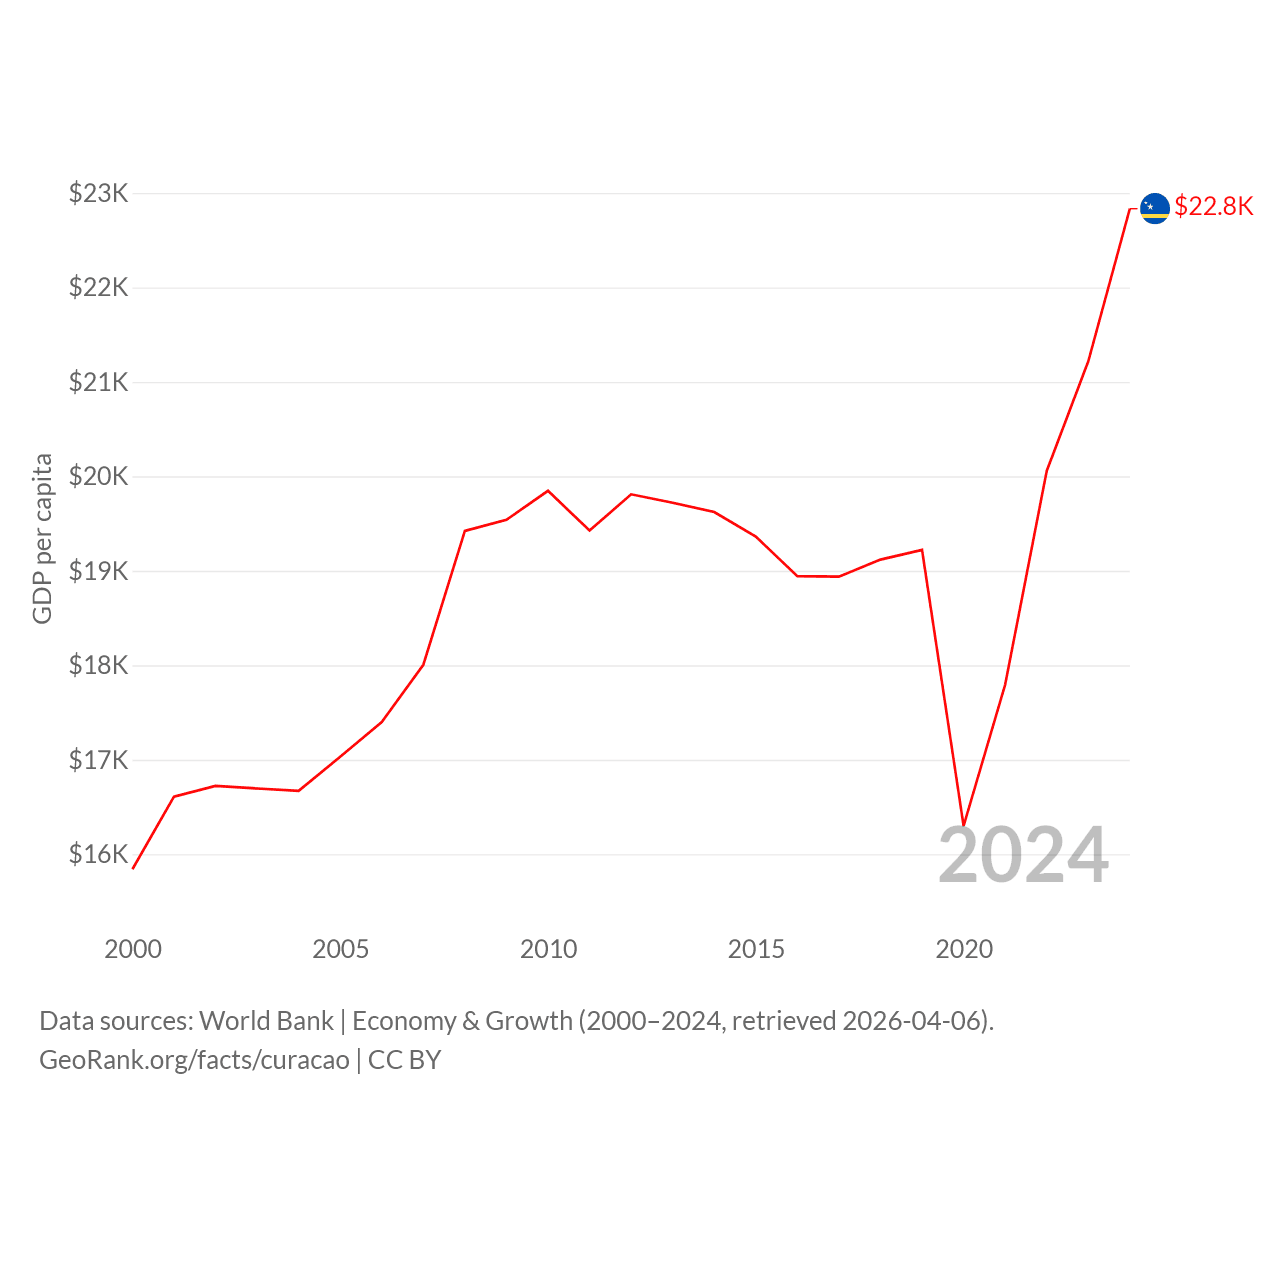
| Year | GDP per capita |
|---|---|
| 2024 | $22,833 |
| 2023 | $21,218 |
| 2022 | $20,057 |
| 2021 | $17,796 |
| 2020 | $16,300 |
| 2019 | $19,221 |
| 2018 | $19,119 |
| 2017 | $18,938 |
| 2016 | $18,944 |
| 2015 | $19,362 |
| 2014 | $19,623 |
| 2013 | $19,721 |
| 2012 | $19,810 |
| 2011 | $19,426 |
| 2010 | $19,847 |
| 2009 | $19,540 |
| 2008 | $19,423 |
| 2007 | $18,006 |
| 2006 | $17,400 |
| 2005 | $17,032 |
| 2004 | $16,671 |
| 2003 | $16,696 |
| 2002 | $16,724 |
| 2001 | $16,610 |
| 2000 | $15,841 |
Data sources: World Bank | Economy & Growth (2000–2024, retrieved 2026-07-08).
GeoRank.org/facts/curacao | CC BY
Curacao's life expectancy calculator
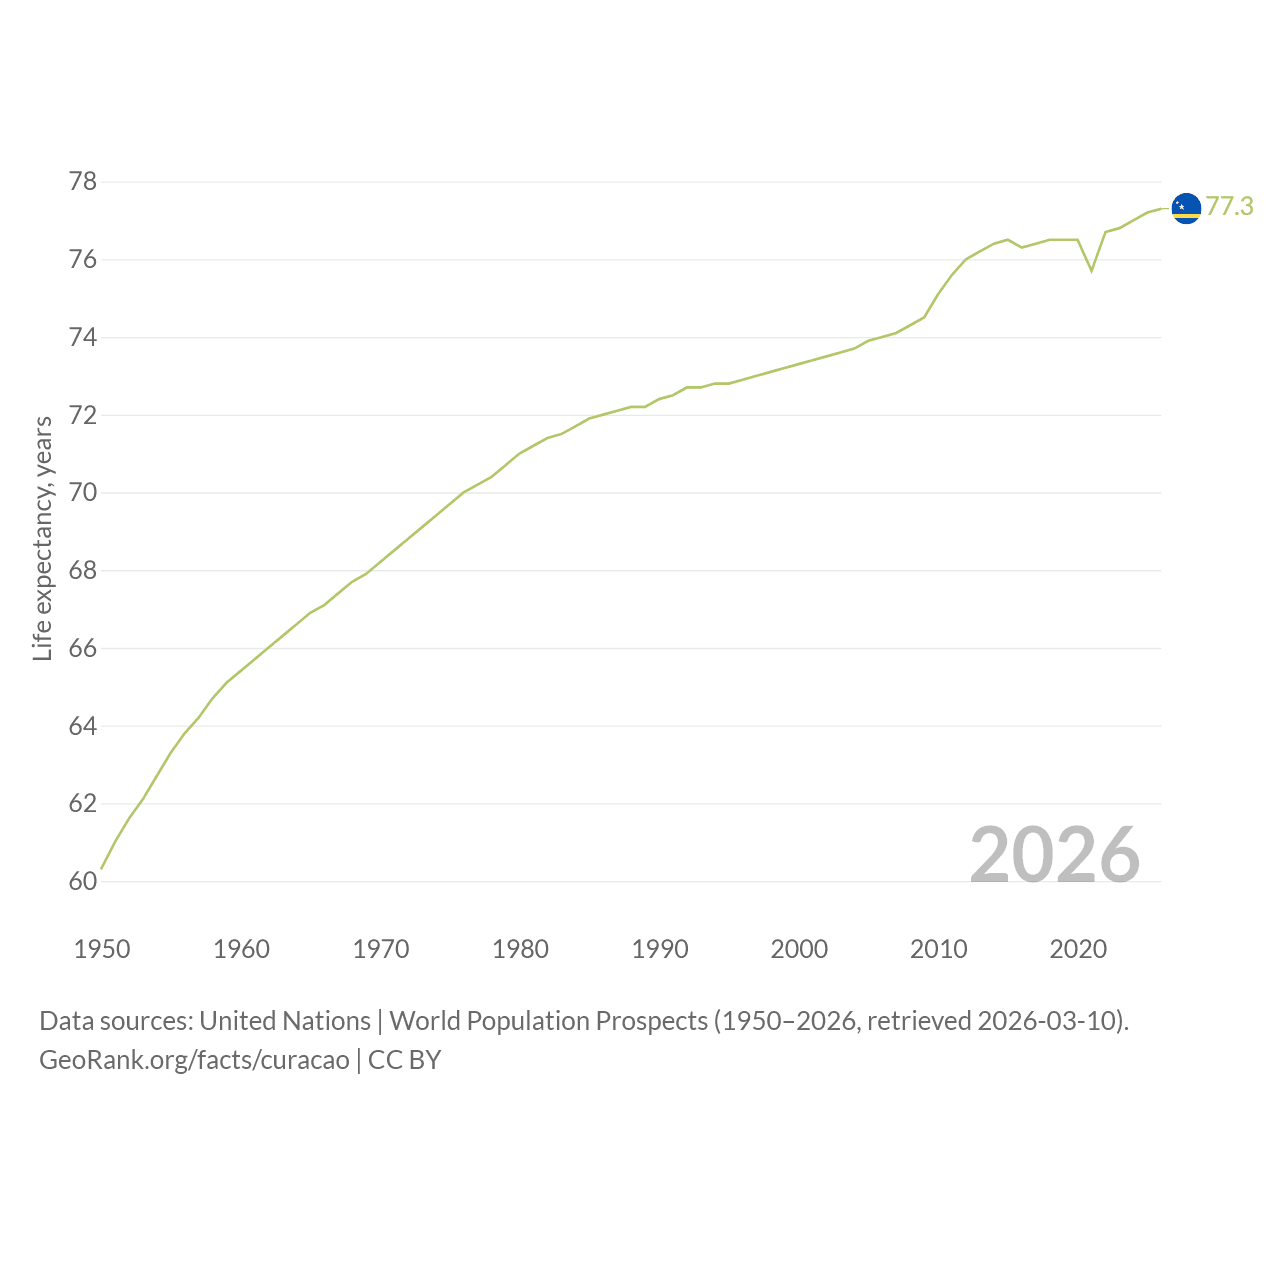
| Year | Life expectancy, years |
|---|---|
| 2026 | 77.3 |
| 2025 | 77.2 |
| 2024 | 77 |
| 2023 | 76.8 |
| 2022 | 76.7 |
| 2021 | 75.7 |
| 2020 | 76.5 |
| 2019 | 76.5 |
| 2018 | 76.5 |
| 2017 | 76.4 |
| 2016 | 76.3 |
| 2015 | 76.5 |
| 2014 | 76.4 |
| 2013 | 76.2 |
| 2012 | 76 |
| 2011 | 75.6 |
| 2010 | 75.1 |
| 2009 | 74.5 |
| 2008 | 74.3 |
| 2007 | 74.1 |
| 2006 | 74 |
| 2005 | 73.9 |
| 2004 | 73.7 |
| 2003 | 73.6 |
| 2002 | 73.5 |
| 2001 | 73.4 |
| 2000 | 73.3 |
| 1999 | 73.2 |
| 1998 | 73.1 |
| 1997 | 73 |
| 1996 | 72.9 |
| 1995 | 72.8 |
| 1994 | 72.8 |
| 1993 | 72.7 |
| 1992 | 72.7 |
| 1991 | 72.5 |
| 1990 | 72.4 |
| 1989 | 72.2 |
| 1988 | 72.2 |
| 1987 | 72.1 |
| 1986 | 72 |
| 1985 | 71.9 |
| 1984 | 71.7 |
| 1983 | 71.5 |
| 1982 | 71.4 |
| 1981 | 71.2 |
| 1980 | 71 |
| 1979 | 70.7 |
| 1978 | 70.4 |
| 1977 | 70.2 |
| 1976 | 70 |
| 1975 | 69.7 |
| 1974 | 69.4 |
| 1973 | 69.1 |
| 1972 | 68.8 |
| 1971 | 68.5 |
| 1970 | 68.2 |
| 1969 | 67.9 |
| 1968 | 67.7 |
| 1967 | 67.4 |
| 1966 | 67.1 |
| 1965 | 66.9 |
| 1964 | 66.6 |
| 1963 | 66.3 |
| 1962 | 66 |
| 1961 | 65.7 |
| 1960 | 65.4 |
| 1959 | 65.1 |
| 1958 | 64.7 |
| 1957 | 64.2 |
| 1956 | 63.8 |
| 1955 | 63.3 |
| 1954 | 62.7 |
| 1953 | 62.1 |
| 1952 | 61.6 |
| 1951 | 61 |
| 1950 | 60.3 |
Data sources: United Nations | World Population Prospects (1950–2026, retrieved 2026-07-08).
GeoRank.org/facts/curacao | CC BY
Curacao's population clock and projection
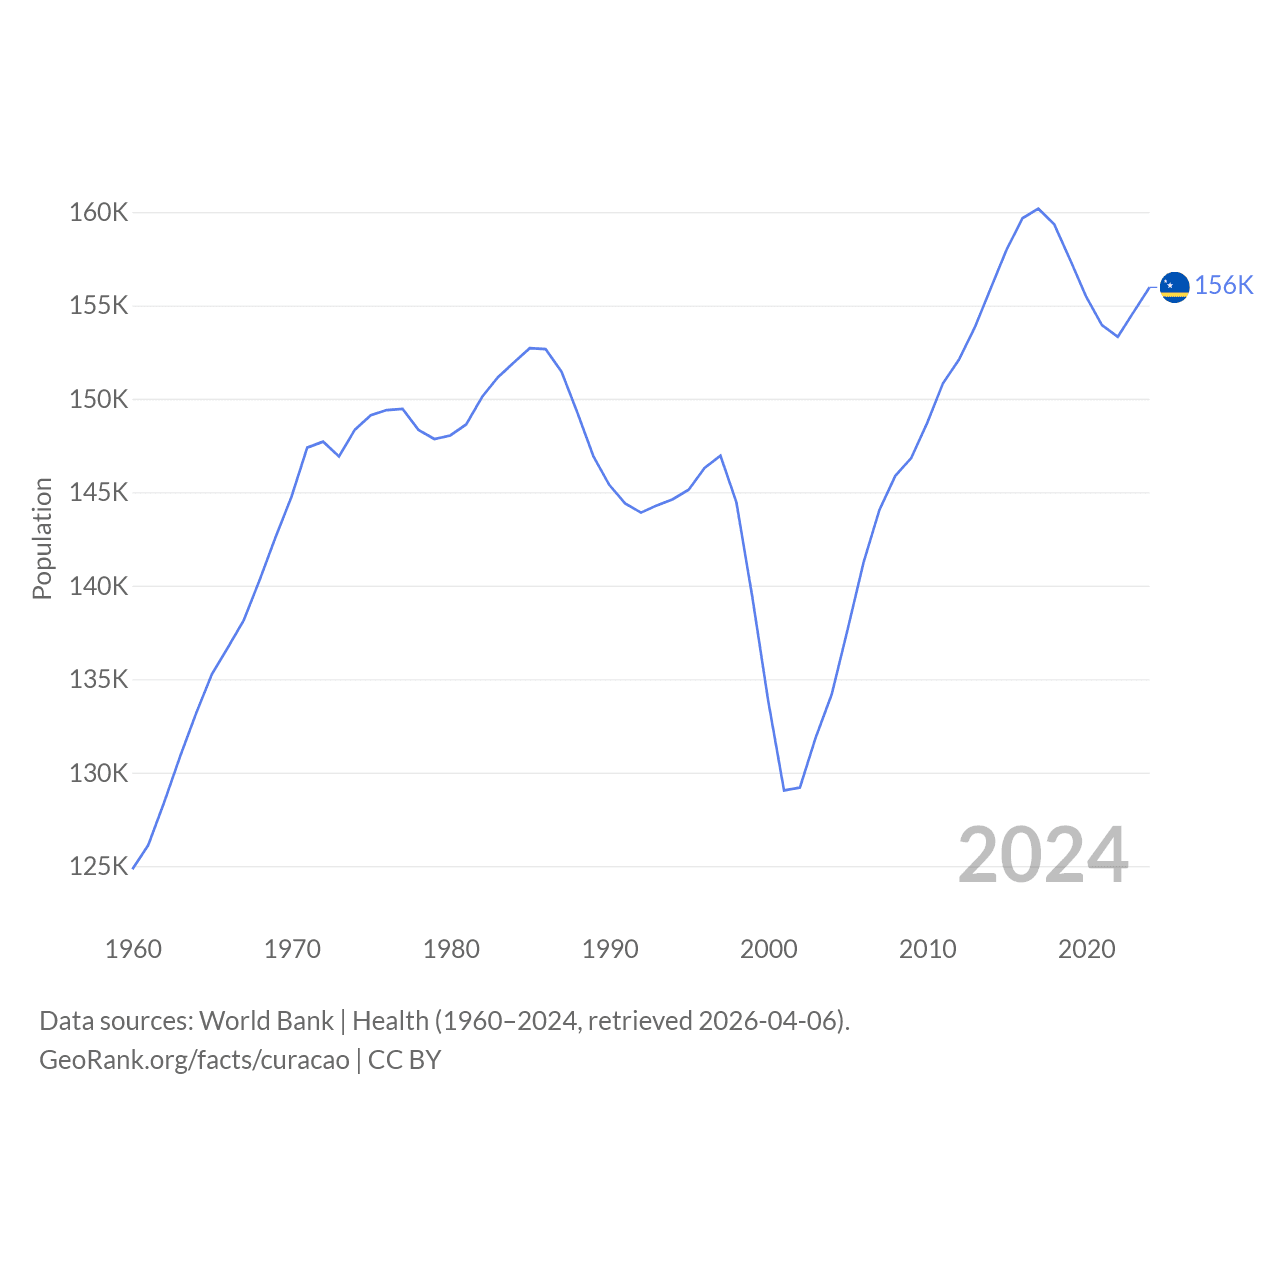
| Year | Population |
|---|---|
| 2025 | 156,263 |
| 2024 | 155,967 |
| 2023 | 154,654 |
| 2022 | 153,321 |
| 2021 | 153,948 |
| 2020 | 155,482 |
| 2019 | 157,441 |
| 2018 | 159,336 |
| 2017 | 160,175 |
| 2016 | 159,664 |
| 2015 | 157,980 |
| 2014 | 155,909 |
| 2013 | 153,822 |
| 2012 | 152,088 |
| 2011 | 150,831 |
| 2010 | 148,703 |
| 2009 | 146,833 |
| 2008 | 145,880 |
| 2007 | 144,056 |
| 2006 | 141,239 |
| 2005 | 137,658 |
| 2004 | 134,192 |
| 2003 | 131,897 |
| 2002 | 129,205 |
| 2001 | 129,047 |
| 2000 | 133,860 |
| 1999 | 139,428 |
| 1998 | 144,472 |
| 1997 | 146,956 |
| 1996 | 146,306 |
| 1995 | 145,139 |
| 1994 | 144,630 |
| 1993 | 144,299 |
| 1992 | 143,912 |
| 1991 | 144,403 |
| 1990 | 145,400 |
| 1989 | 146,937 |
| 1988 | 149,254 |
| 1987 | 151,456 |
| 1986 | 152,662 |
| 1985 | 152,711 |
| 1984 | 151,940 |
| 1983 | 151,159 |
| 1982 | 150,101 |
| 1981 | 148,629 |
| 1980 | 148,041 |
| 1979 | 147,851 |
| 1978 | 148,341 |
| 1977 | 149,459 |
| 1976 | 149,399 |
| 1975 | 149,129 |
| 1974 | 148,351 |
| 1973 | 146,912 |
| 1972 | 147,710 |
| 1971 | 147,389 |
| 1970 | 144,739 |
| 1969 | 142,581 |
| 1968 | 140,298 |
| 1967 | 138,140 |
| 1966 | 136,682 |
| 1965 | 135,266 |
| 1964 | 133,148 |
| 1963 | 130,860 |
| 1962 | 128,414 |
| 1961 | 126,125 |
| 1960 | 124,826 |
Data sources: World Bank | Health (1960–2025, retrieved 2026-07-08).
GeoRank.org/facts/curacao | CC BY
Curacao's birth and fertility rates
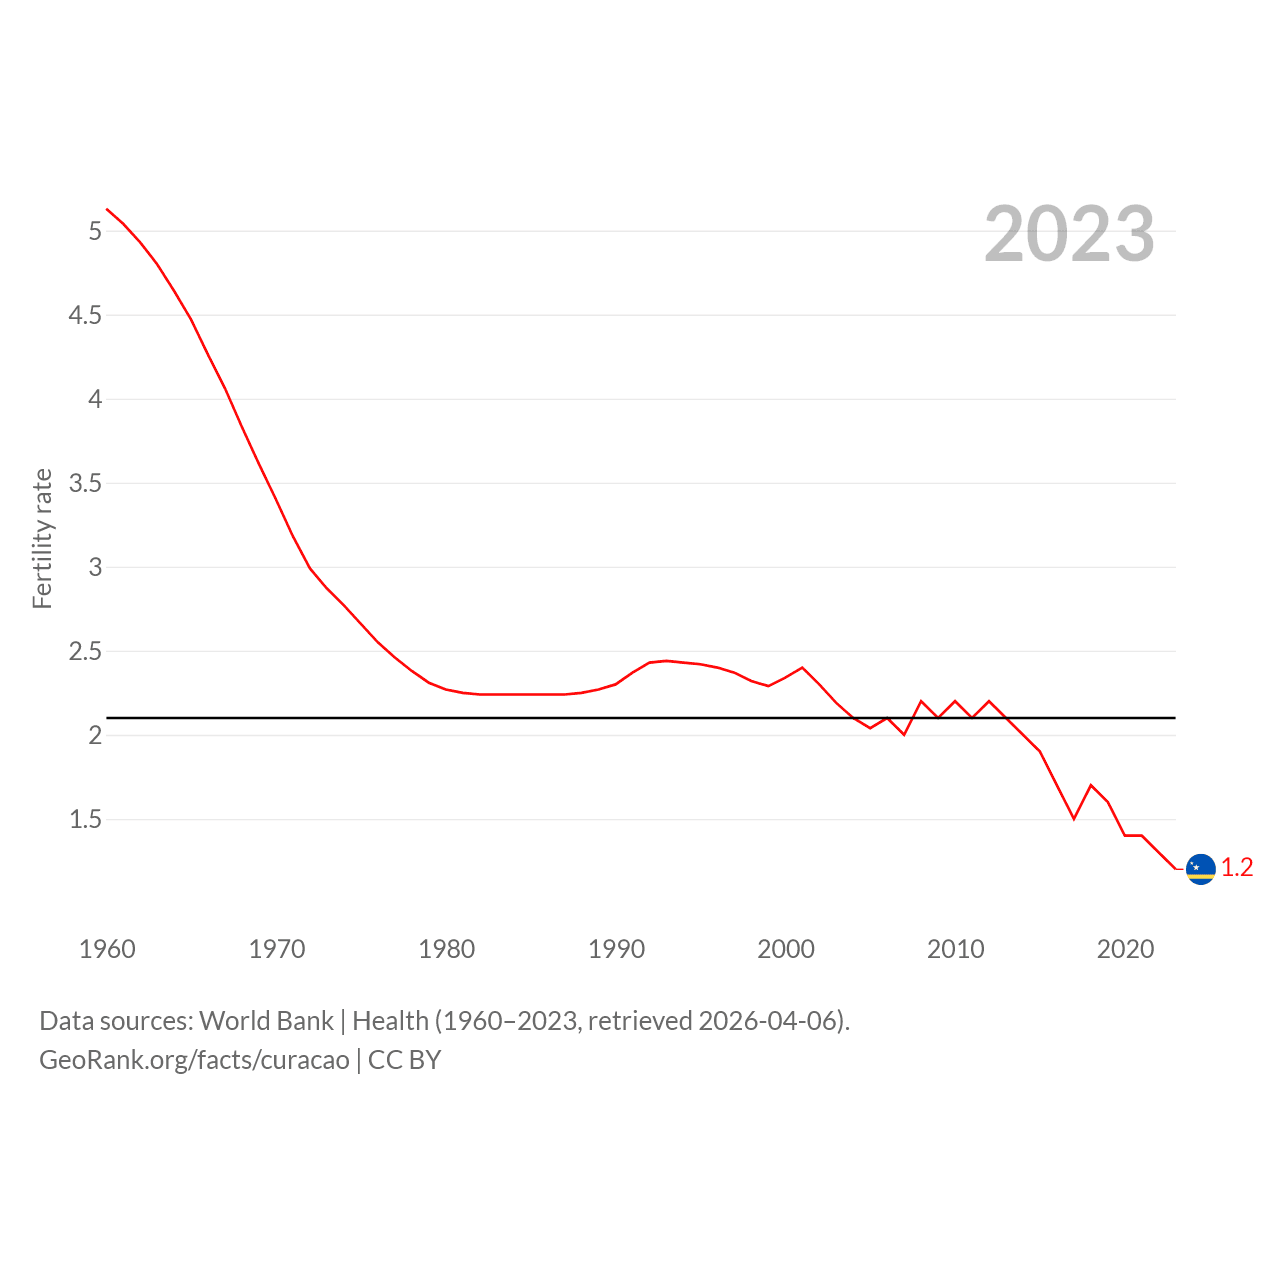
| Year | Fertility rate |
|---|---|
| 2024 | 1.4 |
| 2023 | 1.3 |
| 2022 | 1.4 |
| 2021 | 1.4 |
| 2020 | 1.4 |
| 2019 | 1.6 |
| 2018 | 1.7 |
| 2017 | 1.5 |
| 2016 | 1.7 |
| 2015 | 1.9 |
| 2014 | 2 |
| 2013 | 2.1 |
| 2012 | 2.2 |
| 2011 | 2.1 |
| 2010 | 2.2 |
| 2009 | 2.1 |
| 2008 | 2.2 |
| 2007 | 2 |
| 2006 | 2.1 |
| 2005 | 2.04 |
| 2004 | 2.1 |
| 2003 | 2.19 |
| 2002 | 2.3 |
| 2001 | 2.4 |
| 2000 | 2.34 |
| 1999 | 2.29 |
| 1998 | 2.32 |
| 1997 | 2.37 |
| 1996 | 2.4 |
| 1995 | 2.42 |
| 1994 | 2.43 |
| 1993 | 2.44 |
| 1992 | 2.43 |
| 1991 | 2.37 |
| 1990 | 2.3 |
| 1989 | 2.27 |
| 1988 | 2.25 |
| 1987 | 2.24 |
| 1986 | 2.24 |
| 1985 | 2.24 |
| 1984 | 2.24 |
| 1983 | 2.24 |
| 1982 | 2.24 |
| 1981 | 2.25 |
| 1980 | 2.27 |
| 1979 | 2.31 |
| 1978 | 2.38 |
| 1977 | 2.46 |
| 1976 | 2.55 |
| 1975 | 2.66 |
| 1974 | 2.77 |
| 1973 | 2.87 |
| 1972 | 2.99 |
| 1971 | 3.18 |
| 1970 | 3.4 |
| 1969 | 3.61 |
| 1968 | 3.83 |
| 1967 | 4.06 |
| 1966 | 4.26 |
| 1965 | 4.47 |
| 1964 | 4.64 |
| 1963 | 4.8 |
| 1962 | 4.93 |
| 1961 | 5.04 |
| 1960 | 5.13 |
Data sources: World Bank | Health (1960–2024, retrieved 2026-07-08).
GeoRank.org/facts/curacao | CC BY
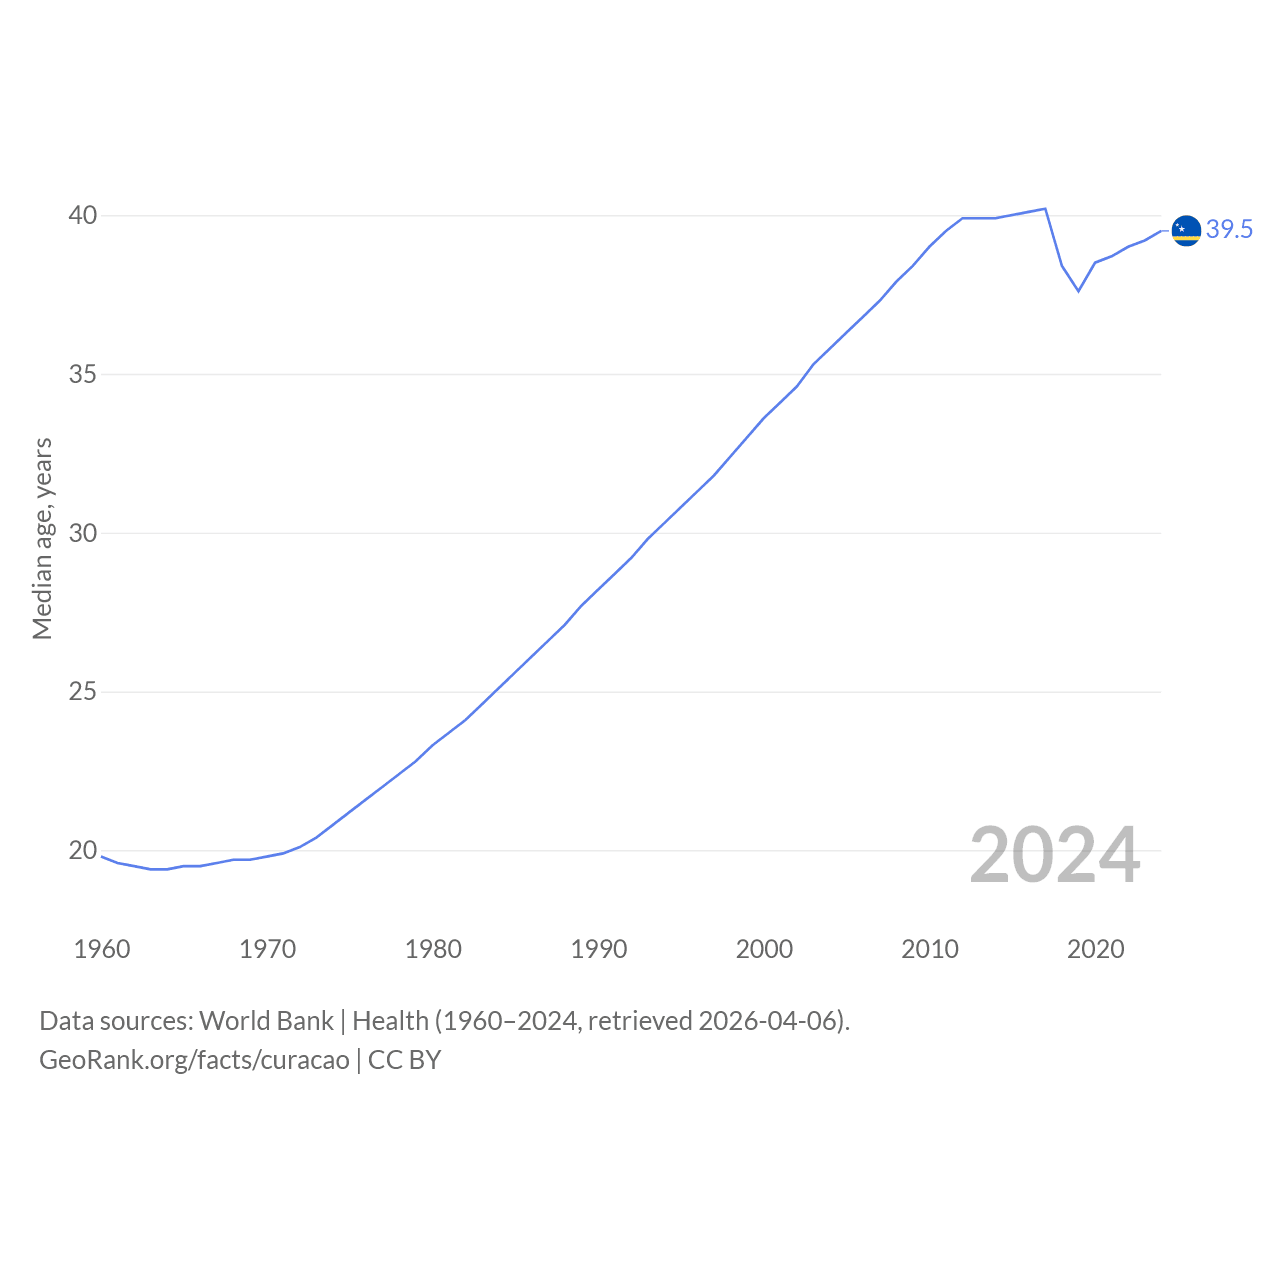
| Year | Median age, years |
|---|---|
| 2025 | 39.7 |
| 2024 | 39.5 |
| 2023 | 39.2 |
| 2022 | 39 |
| 2021 | 38.7 |
| 2020 | 38.5 |
| 2019 | 37.6 |
| 2018 | 38.4 |
| 2017 | 40.2 |
| 2016 | 40.1 |
| 2015 | 40 |
| 2014 | 39.9 |
| 2013 | 39.9 |
| 2012 | 39.9 |
| 2011 | 39.5 |
| 2010 | 39 |
| 2009 | 38.4 |
| 2008 | 37.9 |
| 2007 | 37.3 |
| 2006 | 36.8 |
| 2005 | 36.3 |
| 2004 | 35.8 |
| 2003 | 35.3 |
| 2002 | 34.6 |
| 2001 | 34.1 |
| 2000 | 33.6 |
| 1999 | 33 |
| 1998 | 32.4 |
| 1997 | 31.8 |
| 1996 | 31.3 |
| 1995 | 30.8 |
| 1994 | 30.3 |
| 1993 | 29.8 |
| 1992 | 29.2 |
| 1991 | 28.7 |
| 1990 | 28.2 |
| 1989 | 27.7 |
| 1988 | 27.1 |
| 1987 | 26.6 |
| 1986 | 26.1 |
| 1985 | 25.6 |
| 1984 | 25.1 |
| 1983 | 24.6 |
| 1982 | 24.1 |
| 1981 | 23.7 |
| 1980 | 23.3 |
| 1979 | 22.8 |
| 1978 | 22.4 |
| 1977 | 22 |
| 1976 | 21.6 |
| 1975 | 21.2 |
| 1974 | 20.8 |
| 1973 | 20.4 |
| 1972 | 20.1 |
| 1971 | 19.9 |
| 1970 | 19.8 |
| 1969 | 19.7 |
| 1968 | 19.7 |
| 1967 | 19.6 |
| 1966 | 19.5 |
| 1965 | 19.5 |
| 1964 | 19.4 |
| 1963 | 19.4 |
| 1962 | 19.5 |
| 1961 | 19.6 |
| 1960 | 19.8 |
Data sources: World Bank | Health (1960–2025, retrieved 2026-07-08).
GeoRank.org/facts/curacao | CC BY
Curacao vs. World: Interactive Maps
Use the buttons below to toggle between world maps that display different statistics comparing Curacao with other countries.
Curacao: National Statistics
Finance
|
Curacao
|
Rank | |
|---|---|---|
| GNI, Atlas method |
$3.52B
2024 |
165/194 |
| Government expenditure, % of GDP |
31%
2026 |
91/195 |
| Education expenditure, % of GDP |
5.44%
2024 |
37/193 |
| Unemployment rate |
19.1%
2020 |
10/196 |
| Services, % of GDP |
72.3%
2024 |
17/191 |
| Industry, % of GDP |
12.2%
2024 |
174/194 |
| Economic freedom index |
78
2026 |
12/197 |
| Personal remittances received |
$116M
2024 |
149/191 |
| International tourist arrivals |
1,293,000
2019 |
81/188 |
| International tourism as share of exports |
27.8%
2020 |
27/184 |
Energy
|
Curacao
|
Rank | |
|---|---|---|
| Energy use, kg of oil equivalent per capita |
3,589 kg
2023 |
24/177 |
| GDP PPP per kg equivalent of energy use |
$8.54
2023 |
145/173 |
| Fossil fuel energy use share |
0%
2023 |
147/176 |
| Renewable energy use share |
2.8%
2021 |
167/193 |
| Alternative and nuclear energy use share |
2.93%
2023 |
97/147 |
| Net energy imports use share |
236.1%
2018 |
3/144 |
| Electric power consumption per capita |
5,276 kWh
2023 |
37/147 |
| Renewable electricity output share |
18.3%
2021 |
120/192 |
| Hydroelectric share |
0%
2021 |
159/192 |
| Nuclear share |
0%
2021 |
68/192 |
| Electricity access |
100%
2023 |
26/195 |
Society
|
Curacao
|
Rank | |
|---|---|---|
| % of world population |
0.002%
2025 |
179/197 |
| Annual migration change |
+470
2025 |
68/196 |
| Urban population |
91.5%
2025 |
18/195 |
| Male:Female ratio |
47.6:52.4
2025 |
N/A |
| Quality of life index |
64.7
2026 |
62/197 |
| Corruption Perceptions Index |
72
2026 |
22/197 |
| Higher education index |
8
2026 |
171/183 |
| Homicides per 100K people |
16.9
2007 |
21/197 |
| Road traffic mortality per 100K people |
17
2026 |
77/197 |
| English speaking |
60%
2026 |
49/197 |
| People using the Internet |
68.1%
2017 |
127/195 |
Health
|
Curacao
|
Rank | |
|---|---|---|
| Life expectancy |
77.3 years
2026 |
71/197 |
| Diabetes prevalence |
13.4%
2024 |
38/195 |
| Air quality index |
81
2026 |
40/197 |
Territory
|
Curacao
|
Rank | |
|---|---|---|
| % of world land |
0.0003%
2026 |
182/197 |
| Land area per capita |
1,097 sq mi
2025 |
173/197 |
| Forest area |
0.27 sq mi
2026 |
193/196 |
| Roads length |
342 mi
2026 |
167/176 |
Compare Curacao with other countries
Help us show the world through your eyes
Share a photo of your city and help others discover what it looks like to live there. Your contribution makes our data come alive.
Data sources:
- World Bank | Health (1960–2025, retrieved 2026-07-08)
- United Nations | World Population Prospects (1950–2026, retrieved 2026-07-08)
- U.S. Census Bureau (1960–2025, retrieved 2026-07-08)
- Central Intelligence Agency (CIA) (2000–2019, retrieved 2026-07-08)
- LivingCost (2026, retrieved 2026-07-08)
- Wikidata (2011, retrieved 2026-07-08)
- EduRank (2026, retrieved 2026-07-08)
Creative Commons Attribution (CC BY) — you’re free to copy, share, remix, adapt, and use even commercially as long as you give appropriate credit and clearly indicate if you made changes. Other sources may be subject to different license terms.