Niger is a low-income country with a population of 27.9M people. The capital and largest city is Niamey, with 1.5M residents. Niger shares land borders with Nigeria, Chad, Algeria, Mali, Burkina Faso, Libya and Benin.
Niger ranks 129/197 by GDP ($21.6B) and 188/197 by GDP per capita ($775). The top export category is raw materials & minerals, while the top import is transport & tourism services.
Main facts and rankings
 Niger
Niger
|
Rank | |
|---|---|---|
| Population |
29294628
|
53/197 |
| GDP |
$21.6B
2025 |
129/197 |
| GDP per capita |
$775
2025 |
188/197 |
| GDP per capita, PPP |
$2,050
2024 |
186/197 |
| Government debt |
$9.82B
2025 |
131/185 |
| Debt-to-GDP ratio |
45.4%
2025 |
114/185 |
| Government debt per person |
$352
2025 |
175/185 |
| Average annual personal income after taxes |
$1,418
2026 |
182/197 |
| Land area | 489,076 sq mi | 20/197 |
| Population density | 58.9 ppl/mi² | 166/197 |
| Fertility rate | 5.94 | 5/196 |
| Median age | 16.7 years | 194/196 |
| Life expectancy | 61.9 years | 187/197 |
Niger trends dashboard: time-series charts
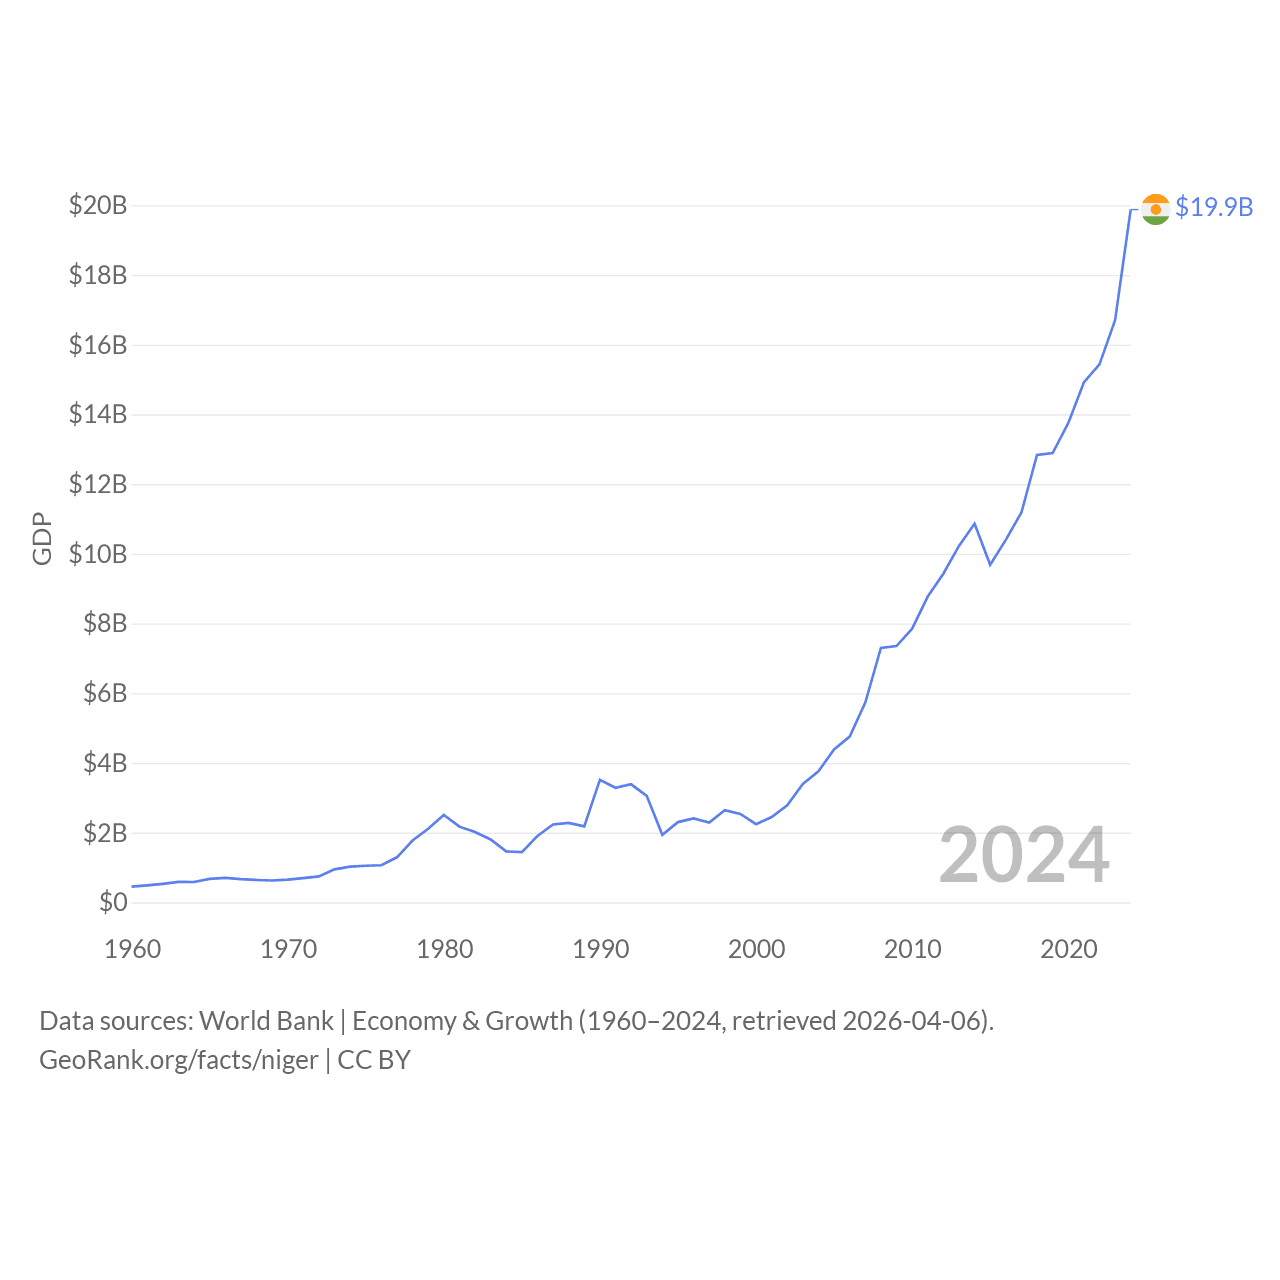
| Year | GDP |
|---|---|
| 2025 | $21,646,191,388 |
| 2024 | $19,729,786,047 |
| 2023 | $16,949,765,464 |
| 2022 | $15,531,799,641 |
| 2021 | $14,936,154,253 |
| 2020 | $13,648,332,190 |
| 2019 | $12,420,836,507 |
| 2018 | $12,800,907,986 |
| 2017 | $11,359,273,443 |
| 2016 | $10,341,025,540 |
| 2015 | $9,683,867,926 |
| 2014 | $10,862,943,544 |
| 2013 | $10,224,897,438 |
| 2012 | $9,426,912,648 |
| 2011 | $8,772,950,778 |
| 2010 | $7,851,192,502 |
| 2009 | $7,352,131,310 |
| 2008 | $7,297,600,226 |
| 2007 | $5,731,485,052 |
| 2006 | $4,756,361,252 |
| 2005 | $4,383,315,965 |
| 2004 | $3,760,443,738 |
| 2003 | $3,394,084,732 |
| 2002 | $2,782,192,879 |
| 2001 | $2,448,714,704 |
| 2000 | $2,241,753,193 |
| 1999 | $2,537,789,821 |
| 1998 | $2,643,363,519 |
| 1997 | $2,290,318,910 |
| 1996 | $2,405,686,940 |
| 1995 | $2,302,537,562 |
| 1994 | $1,938,058,175 |
| 1993 | $3,052,673,849 |
| 1992 | $3,386,232,579 |
| 1991 | $3,285,796,875 |
| 1990 | $3,512,356,508 |
| 1989 | $2,179,567,114 |
| 1988 | $2,280,356,193 |
| 1987 | $2,233,006,105 |
| 1986 | $1,904,096,998 |
| 1985 | $1,440,581,652 |
| 1984 | $1,461,243,326 |
| 1983 | $1,803,099,561 |
| 1982 | $2,017,612,216 |
| 1981 | $2,170,893,414 |
| 1980 | $2,508,524,721 |
| 1979 | $2,109,277,666 |
| 1978 | $1,774,365,590 |
| 1977 | $1,291,458,041 |
| 1976 | $1,064,517,601 |
| 1975 | $1,048,690,933 |
| 1974 | $1,026,137,111 |
| 1973 | $946,385,105 |
| 1972 | $742,779,661 |
| 1971 | $693,573,704 |
| 1970 | $649,916,621 |
| 1969 | $625,867,985 |
| 1968 | $641,214,226 |
| 1967 | $665,586,872 |
| 1966 | $702,296,079 |
| 1965 | $673,383,511 |
| 1964 | $582,816,396 |
| 1963 | $586,294,879 |
| 1962 | $531,736,599 |
| 1961 | $485,785,231 |
| 1960 | $449,526,873 |
Data sources: World Bank | Economy & Growth (1960–2025, retrieved 2026-07-08).
GeoRank.org/facts/niger | CC BY 
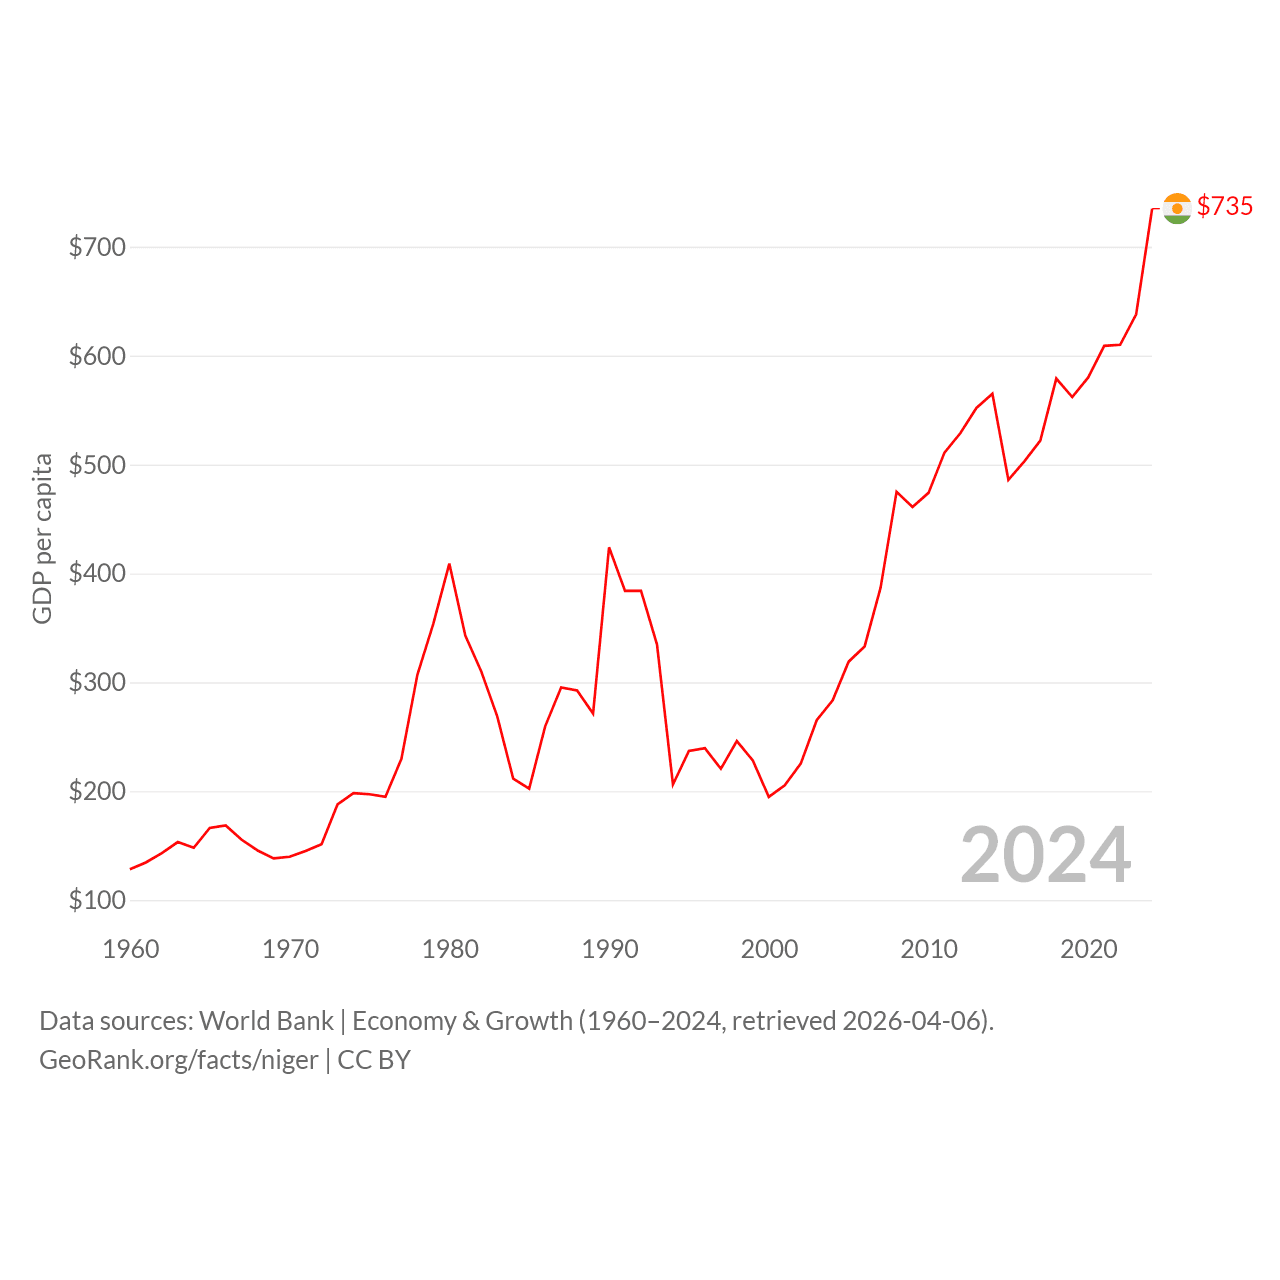
| Year | GDP per capita |
|---|---|
| 2025 | $775 |
| 2024 | $730 |
| 2023 | $648 |
| 2022 | $614 |
| 2021 | $610 |
| 2020 | $575 |
| 2019 | $541 |
| 2018 | $577 |
| 2017 | $530 |
| 2016 | $500 |
| 2015 | $486 |
| 2014 | $565 |
| 2013 | $552 |
| 2012 | $529 |
| 2011 | $511 |
| 2010 | $474 |
| 2009 | $461 |
| 2008 | $475 |
| 2007 | $387 |
| 2006 | $333 |
| 2005 | $319 |
| 2004 | $283.5 |
| 2003 | $265.2 |
| 2002 | $225.3 |
| 2001 | $205.4 |
| 2000 | $194.8 |
| 1999 | $228.3 |
| 1998 | $246.1 |
| 1997 | $220.6 |
| 1996 | $239.5 |
| 1995 | $237 |
| 1994 | $206.2 |
| 1993 | $335 |
| 1992 | $384 |
| 1991 | $384 |
| 1990 | $424 |
| 1989 | $271.3 |
| 1988 | $292.6 |
| 1987 | $295.3 |
| 1986 | $259.6 |
| 1985 | $202.4 |
| 1984 | $211.5 |
| 1983 | $268.8 |
| 1982 | $310 |
| 1981 | $343 |
| 1980 | $409 |
| 1979 | $354 |
| 1978 | $307 |
| 1977 | $229.8 |
| 1976 | $194.8 |
| 1975 | $197.2 |
| 1974 | $198.3 |
| 1973 | $187.9 |
| 1972 | $151.4 |
| 1971 | $145.2 |
| 1970 | $139.8 |
| 1969 | $138.3 |
| 1968 | $145.6 |
| 1967 | $155.4 |
| 1966 | $168.6 |
| 1965 | $166.3 |
| 1964 | $148.1 |
| 1963 | $153.3 |
| 1962 | $143.2 |
| 1961 | $134.6 |
| 1960 | $128.3 |
Data sources: World Bank | Economy & Growth (1960–2025, retrieved 2026-07-08).
GeoRank.org/facts/niger | CC BY
Niger's life expectancy calculator
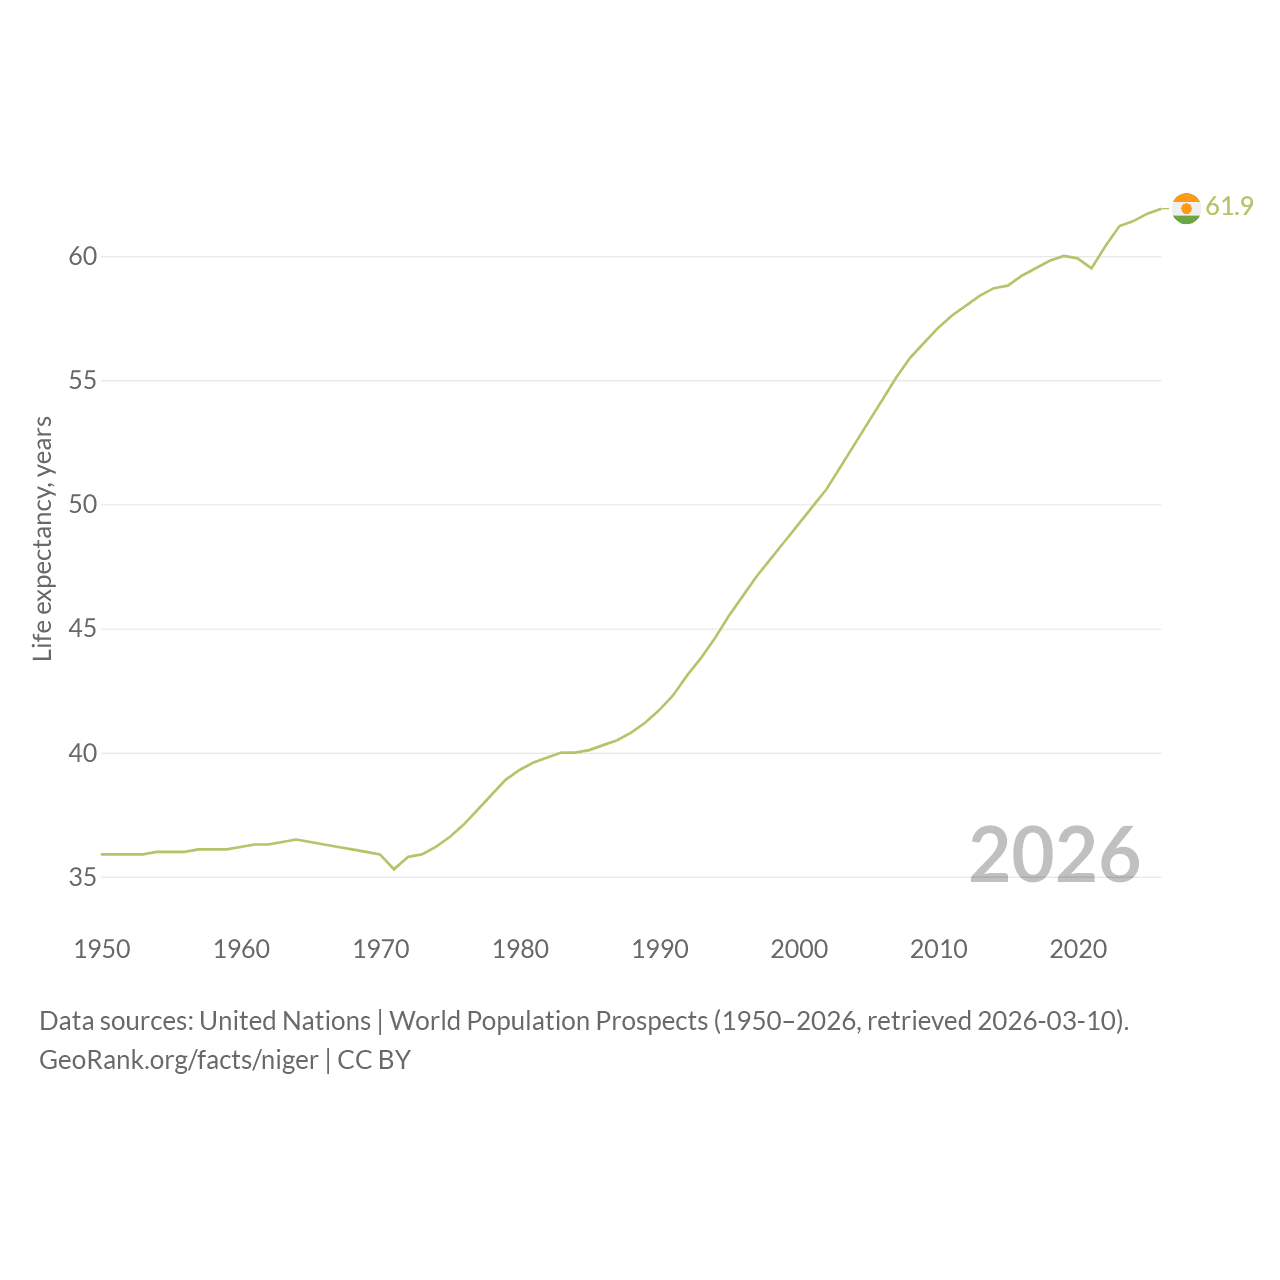
| Year | Life expectancy, years |
|---|---|
| 2026 | 61.9 |
| 2025 | 61.7 |
| 2024 | 61.4 |
| 2023 | 61.2 |
| 2022 | 60.4 |
| 2021 | 59.5 |
| 2020 | 59.9 |
| 2019 | 60 |
| 2018 | 59.8 |
| 2017 | 59.5 |
| 2016 | 59.2 |
| 2015 | 58.8 |
| 2014 | 58.7 |
| 2013 | 58.4 |
| 2012 | 58 |
| 2011 | 57.6 |
| 2010 | 57.1 |
| 2009 | 56.5 |
| 2008 | 55.9 |
| 2007 | 55.1 |
| 2006 | 54.2 |
| 2005 | 53.3 |
| 2004 | 52.4 |
| 2003 | 51.5 |
| 2002 | 50.6 |
| 2001 | 49.9 |
| 2000 | 49.2 |
| 1999 | 48.5 |
| 1998 | 47.8 |
| 1997 | 47.1 |
| 1996 | 46.3 |
| 1995 | 45.5 |
| 1994 | 44.6 |
| 1993 | 43.8 |
| 1992 | 43.1 |
| 1991 | 42.3 |
| 1990 | 41.7 |
| 1989 | 41.2 |
| 1988 | 40.8 |
| 1987 | 40.5 |
| 1986 | 40.3 |
| 1985 | 40.1 |
| 1984 | 40 |
| 1983 | 40 |
| 1982 | 39.8 |
| 1981 | 39.6 |
| 1980 | 39.3 |
| 1979 | 38.9 |
| 1978 | 38.3 |
| 1977 | 37.7 |
| 1976 | 37.1 |
| 1975 | 36.6 |
| 1974 | 36.2 |
| 1973 | 35.9 |
| 1972 | 35.8 |
| 1971 | 35.3 |
| 1970 | 35.9 |
| 1969 | 36 |
| 1968 | 36.1 |
| 1967 | 36.2 |
| 1966 | 36.3 |
| 1965 | 36.4 |
| 1964 | 36.5 |
| 1963 | 36.4 |
| 1962 | 36.3 |
| 1961 | 36.3 |
| 1960 | 36.2 |
| 1959 | 36.1 |
| 1958 | 36.1 |
| 1957 | 36.1 |
| 1956 | 36 |
| 1955 | 36 |
| 1954 | 36 |
| 1953 | 35.9 |
| 1952 | 35.9 |
| 1951 | 35.9 |
| 1950 | 35.9 |
Data sources: United Nations | World Population Prospects (1950–2026, retrieved 2026-07-08).
GeoRank.org/facts/niger | CC BY
Niger's population clock and projection
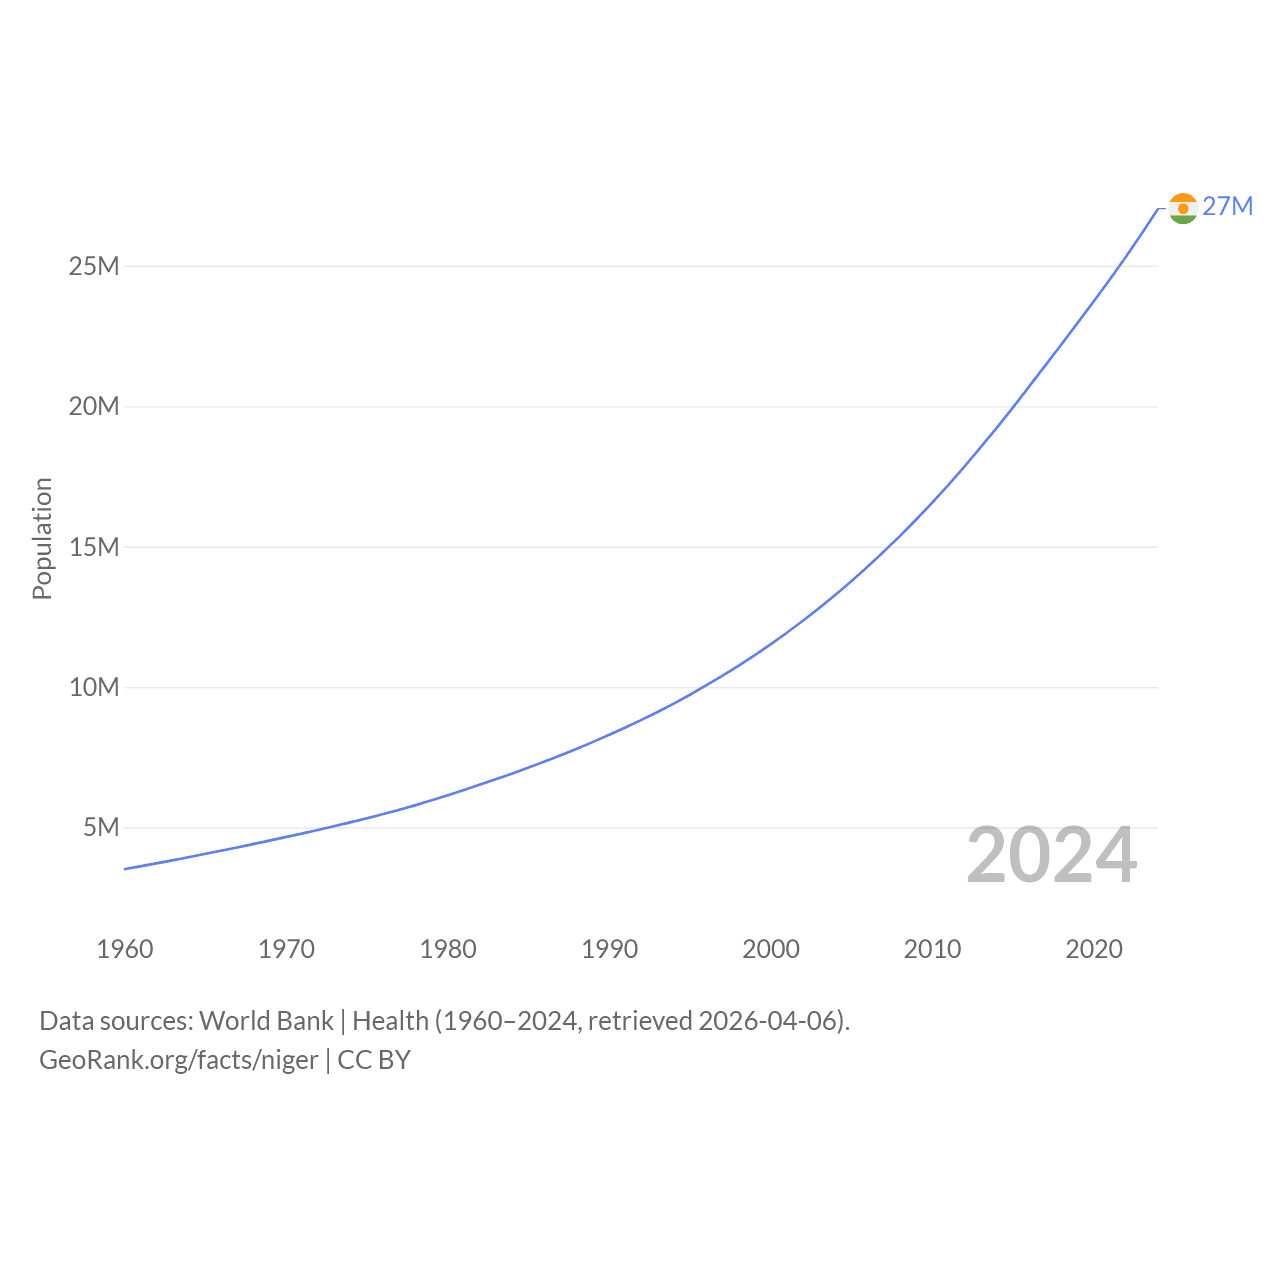
| Year | Population |
|---|---|
| 2025 | 27,917,831 |
| 2024 | 27,032,412 |
| 2023 | 26,159,867 |
| 2022 | 25,311,973 |
| 2021 | 24,502,140 |
| 2020 | 23,717,613 |
| 2019 | 22,947,757 |
| 2018 | 22,188,069 |
| 2017 | 21,435,446 |
| 2016 | 20,685,753 |
| 2015 | 19,939,498 |
| 2014 | 19,215,909 |
| 2013 | 18,519,898 |
| 2012 | 17,836,769 |
| 2011 | 17,176,283 |
| 2010 | 16,548,835 |
| 2009 | 15,943,675 |
| 2008 | 15,361,915 |
| 2007 | 14,803,610 |
| 2006 | 14,268,581 |
| 2005 | 13,756,192 |
| 2004 | 13,265,836 |
| 2003 | 12,796,984 |
| 2002 | 12,349,144 |
| 2001 | 11,920,647 |
| 2000 | 11,509,630 |
| 1999 | 11,117,411 |
| 1998 | 10,741,413 |
| 1997 | 10,383,969 |
| 1996 | 10,044,852 |
| 1995 | 9,714,529 |
| 1994 | 9,398,258 |
| 1993 | 9,100,789 |
| 1992 | 8,817,633 |
| 1991 | 8,546,900 |
| 1990 | 8,286,059 |
| 1989 | 8,034,780 |
| 1988 | 7,793,748 |
| 1987 | 7,561,150 |
| 1986 | 7,335,811 |
| 1985 | 7,118,457 |
| 1984 | 6,909,971 |
| 1983 | 6,708,644 |
| 1982 | 6,512,732 |
| 1981 | 6,322,006 |
| 1980 | 6,135,971 |
| 1979 | 5,955,556 |
| 1978 | 5,782,932 |
| 1977 | 5,619,716 |
| 1976 | 5,464,962 |
| 1975 | 5,317,019 |
| 1974 | 5,174,953 |
| 1973 | 5,037,865 |
| 1972 | 4,904,845 |
| 1971 | 4,776,225 |
| 1970 | 4,650,275 |
| 1969 | 4,525,725 |
| 1968 | 4,403,637 |
| 1967 | 4,283,590 |
| 1966 | 4,165,544 |
| 1965 | 4,049,695 |
| 1964 | 3,935,814 |
| 1963 | 3,823,873 |
| 1962 | 3,714,520 |
| 1961 | 3,608,162 |
| 1960 | 3,505,050 |
Data sources: World Bank | Health (1960–2025, retrieved 2026-07-08).
GeoRank.org/facts/niger | CC BY
Niger's birth and fertility rates
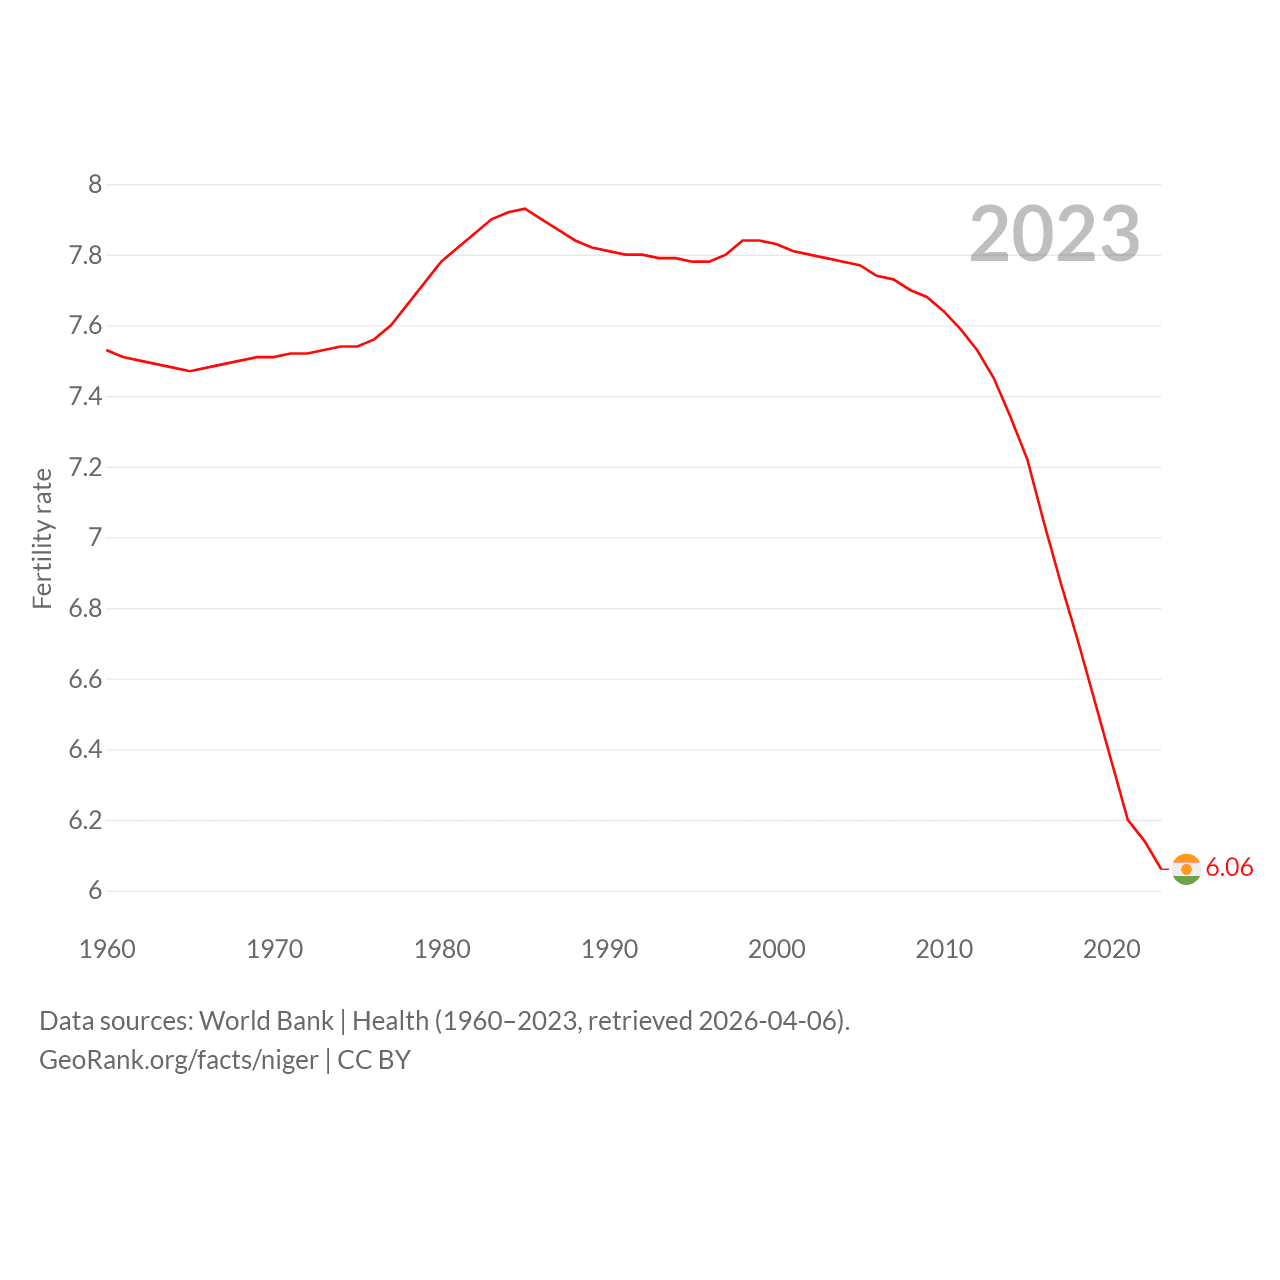
| Year | Fertility rate |
|---|---|
| 2024 | 5.94 |
| 2023 | 6.06 |
| 2022 | 6.14 |
| 2021 | 6.2 |
| 2020 | 6.37 |
| 2019 | 6.54 |
| 2018 | 6.71 |
| 2017 | 6.87 |
| 2016 | 7.04 |
| 2015 | 7.22 |
| 2014 | 7.34 |
| 2013 | 7.45 |
| 2012 | 7.53 |
| 2011 | 7.59 |
| 2010 | 7.64 |
| 2009 | 7.68 |
| 2008 | 7.7 |
| 2007 | 7.73 |
| 2006 | 7.74 |
| 2005 | 7.77 |
| 2004 | 7.78 |
| 2003 | 7.79 |
| 2002 | 7.8 |
| 2001 | 7.81 |
| 2000 | 7.83 |
| 1999 | 7.84 |
| 1998 | 7.84 |
| 1997 | 7.8 |
| 1996 | 7.78 |
| 1995 | 7.78 |
| 1994 | 7.79 |
| 1993 | 7.79 |
| 1992 | 7.8 |
| 1991 | 7.8 |
| 1990 | 7.81 |
| 1989 | 7.82 |
| 1988 | 7.84 |
| 1987 | 7.87 |
| 1986 | 7.9 |
| 1985 | 7.93 |
| 1984 | 7.92 |
| 1983 | 7.9 |
| 1982 | 7.86 |
| 1981 | 7.82 |
| 1980 | 7.78 |
| 1979 | 7.72 |
| 1978 | 7.66 |
| 1977 | 7.6 |
| 1976 | 7.56 |
| 1975 | 7.54 |
| 1974 | 7.54 |
| 1973 | 7.53 |
| 1972 | 7.52 |
| 1971 | 7.52 |
| 1970 | 7.51 |
| 1969 | 7.51 |
| 1968 | 7.5 |
| 1967 | 7.49 |
| 1966 | 7.48 |
| 1965 | 7.47 |
| 1964 | 7.48 |
| 1963 | 7.49 |
| 1962 | 7.5 |
| 1961 | 7.51 |
| 1960 | 7.53 |
Data sources: World Bank | Health (1960–2024, retrieved 2026-07-08).
GeoRank.org/facts/niger | CC BY
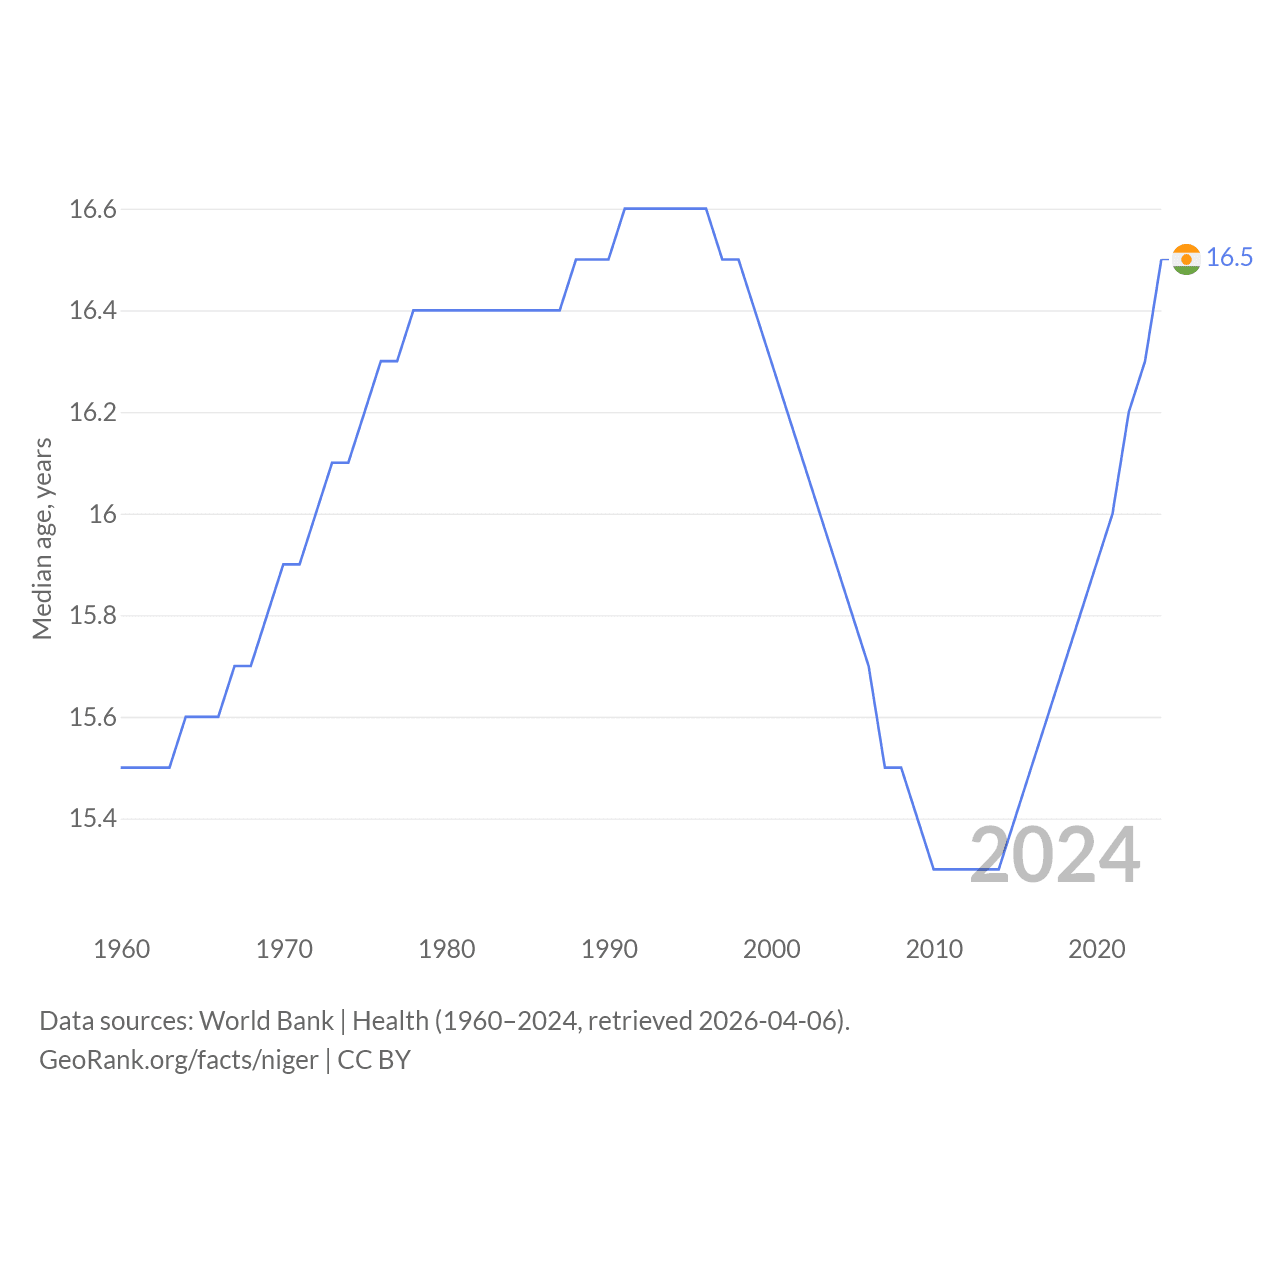
| Year | Median age, years |
|---|---|
| 2025 | 16.7 |
| 2024 | 16.5 |
| 2023 | 16.3 |
| 2022 | 16.2 |
| 2021 | 16 |
| 2020 | 15.9 |
| 2019 | 15.8 |
| 2018 | 15.7 |
| 2017 | 15.6 |
| 2016 | 15.5 |
| 2015 | 15.4 |
| 2014 | 15.3 |
| 2013 | 15.3 |
| 2012 | 15.3 |
| 2011 | 15.3 |
| 2010 | 15.3 |
| 2009 | 15.4 |
| 2008 | 15.5 |
| 2007 | 15.5 |
| 2006 | 15.7 |
| 2005 | 15.8 |
| 2004 | 15.9 |
| 2003 | 16 |
| 2002 | 16.1 |
| 2001 | 16.2 |
| 2000 | 16.3 |
| 1999 | 16.4 |
| 1998 | 16.5 |
| 1997 | 16.5 |
| 1996 | 16.6 |
| 1995 | 16.6 |
| 1994 | 16.6 |
| 1993 | 16.6 |
| 1992 | 16.6 |
| 1991 | 16.6 |
| 1990 | 16.5 |
| 1989 | 16.5 |
| 1988 | 16.5 |
| 1987 | 16.4 |
| 1986 | 16.4 |
| 1985 | 16.4 |
| 1984 | 16.4 |
| 1983 | 16.4 |
| 1982 | 16.4 |
| 1981 | 16.4 |
| 1980 | 16.4 |
| 1979 | 16.4 |
| 1978 | 16.4 |
| 1977 | 16.3 |
| 1976 | 16.3 |
| 1975 | 16.2 |
| 1974 | 16.1 |
| 1973 | 16.1 |
| 1972 | 16 |
| 1971 | 15.9 |
| 1970 | 15.9 |
| 1969 | 15.8 |
| 1968 | 15.7 |
| 1967 | 15.7 |
| 1966 | 15.6 |
| 1965 | 15.6 |
| 1964 | 15.6 |
| 1963 | 15.5 |
| 1962 | 15.5 |
| 1961 | 15.5 |
| 1960 | 15.5 |
Data sources: World Bank | Health (1960–2025, retrieved 2026-07-08).
GeoRank.org/facts/niger | CC BY
Niger vs. World: Interactive Maps
Use the buttons below to toggle between world maps that display different statistics comparing Niger with other countries.
Niger: National Statistics
Finance
|
Niger
|
Rank | |
|---|---|---|
| GNI, Atlas method |
$20.9B
2025 |
127/194 |
| Government expenditure, % of GDP |
14.8%
2025 |
184/195 |
| Education expenditure, % of GDP |
4.07%
2023 |
100/193 |
| Military expenditure, % of GDP |
2.24%
2024 |
54/163 |
| Armed forces personnel |
10,000
2020 |
134/174 |
| Deficit/surplus, % of GDP |
-3.28%
2025 |
110/188 |
| Unemployment rate |
0.4%
2022 |
193/196 |
| Services, % of GDP |
31.1%
2025 |
188/191 |
| Industry, % of GDP |
18.7%
2025 |
135/194 |
| Economic freedom index |
51
2026 |
156/197 |
| Income share by richest 10% |
27.8%
2021 |
81/169 |
| Income share by poorest 10% |
3.8%
2021 |
18/169 |
| Personal remittances received |
$650M
2024 |
108/191 |
| International tourist arrivals |
85,000
2020 |
167/188 |
| International tourism as share of exports |
9.38%
2019 |
66/184 |
| Banked people share |
14.8%
2024 |
152/158 |
Energy
|
Niger
|
Rank | |
|---|---|---|
| Energy use, kg of oil equivalent per capita |
161.3 kg
2023 |
167/177 |
| GDP PPP per kg equivalent of energy use |
$11.6
2023 |
123/173 |
| Carbon dioxide (CO2) emissions |
3.21 megatons
2024 |
144/187 |
| CO2 emissions per capita |
0.12 tons
2024 |
180/187 |
| Fossil fuel energy use share |
0%
2023 |
164/176 |
| Renewable energy use share |
79.6%
2021 |
18/193 |
| Alternative and nuclear energy use share |
0.07%
2023 |
141/147 |
| Net energy imports use share |
5.41%
2022 |
96/144 |
| Electric power consumption per capita |
67.7 kWh
2023 |
145/147 |
| Renewable electricity output share |
7.83%
2021 |
143/192 |
| Hydroelectric share |
0%
2021 |
175/192 |
| Nuclear share |
0%
2021 |
139/192 |
| Electricity access |
20.1%
2023 |
190/195 |
Society
|
Niger
|
Rank | |
|---|---|---|
| % of world population |
0.34%
2025 |
54/197 |
| Annual migration change |
-7,704
2025 |
126/196 |
| Urban population |
18.4%
2025 |
191/195 |
| Male:Female ratio |
50.8:49.2
2025 |
N/A |
| Average male height |
5.59 ft
2026 |
121/190 |
| Average female height |
5.24 ft
2026 |
96/190 |
| Quality of life index |
14.3
2026 |
186/197 |
| Corruption Perceptions Index |
31
2025 |
141/197 |
| Higher education index |
10
2026 |
167/183 |
| Homicides per 100K people |
4.42
2012 |
79/197 |
| Road traffic mortality per 100K people |
25.5
2019 |
48/197 |
| Visa free countries |
63
2026 |
158/195 |
| Adult literacy rate |
35.6%
2022 |
194/196 |
| English speaking |
1%
2026 |
184/197 |
| People using the Internet |
15.6%
2024 |
188/195 |
Health
|
Niger
|
Rank | |
|---|---|---|
| Government health expenditure per capita |
$26
2023 |
187/192 |
| Out-of-pocket health expenditure per capita |
$13.4
2023 |
172/192 |
| Life expectancy |
61.9 years
2026 |
187/197 |
| Foreign aid share of health expenditure |
14.6%
2023 |
49/181 |
| Physicians per 1,000 people |
0.04
2023 |
193/193 |
| Age at first childbirth |
18.5 years
2025 |
136/137 |
| Maternal mortality per 100K births |
350
2023 |
21/193 |
| Mortality rate before reaching 5 years of age |
110.7
2024 |
2/192 |
| Obesity rate |
6.21%
2022 |
179/189 |
| Diabetes prevalence |
4.1%
2024 |
183/195 |
| Air quality index |
12
2026 |
175/197 |
| Tobacco use prevalence |
7.4%
2024 |
158/170 |
| Pure alcohol consumption per capita |
0.13 liters
2020 |
174/186 |
Territory
|
Niger
|
Rank | |
|---|---|---|
| % of world land |
0.85%
2026 |
20/197 |
| Land area per capita |
17,518 sq mi
2025 |
32/197 |
| Agricultural land area |
179,918 sq mi
2026 |
19/194 |
| Forest area |
4,025 sq mi
2026 |
124/196 |
| Roads length |
11,774 mi
2010 |
102/176 |
Compare Niger with other countries
Help us show the world through your eyes
Share a photo of your city and help others discover what it looks like to live there. Your contribution makes our data come alive.
Data sources:
- World Bank | Health (1960–2025, retrieved 2026-07-08)
- United Nations | World Population Prospects (1950–2026, retrieved 2026-07-08)
- U.S. Census Bureau (1960–2025, retrieved 2026-07-08)
- Central Intelligence Agency (CIA) (2000–2025, retrieved 2026-07-08)
- International Monetary Fund (IMF) | Fiscal Monitor (2025, retrieved 2026-07-08)
- LivingCost (2026, retrieved 2026-07-08)
- World Obesity Federation (2022, retrieved 2026-07-08)
- Wikidata (2024, retrieved 2026-07-08)
- Transparency International (2025, retrieved 2026-07-08)
- The Heritage Foundation | Economic Freedom Index (2026, retrieved 2026-07-08)
- Passport Index (2026, retrieved 2026-07-08)
- EduRank (2026, retrieved 2026-07-08)
Creative Commons Attribution (CC BY) — you’re free to copy, share, remix, adapt, and use even commercially as long as you give appropriate credit and clearly indicate if you made changes. Other sources may be subject to different license terms.