Monaco ranked 154/197 by economy size with a GDP of $11.1B and 1/197 by GDP per capita at $288,002.
In 2024, Monaco made up 0.01% of the world's economy, compared to 0.01% in 1970.
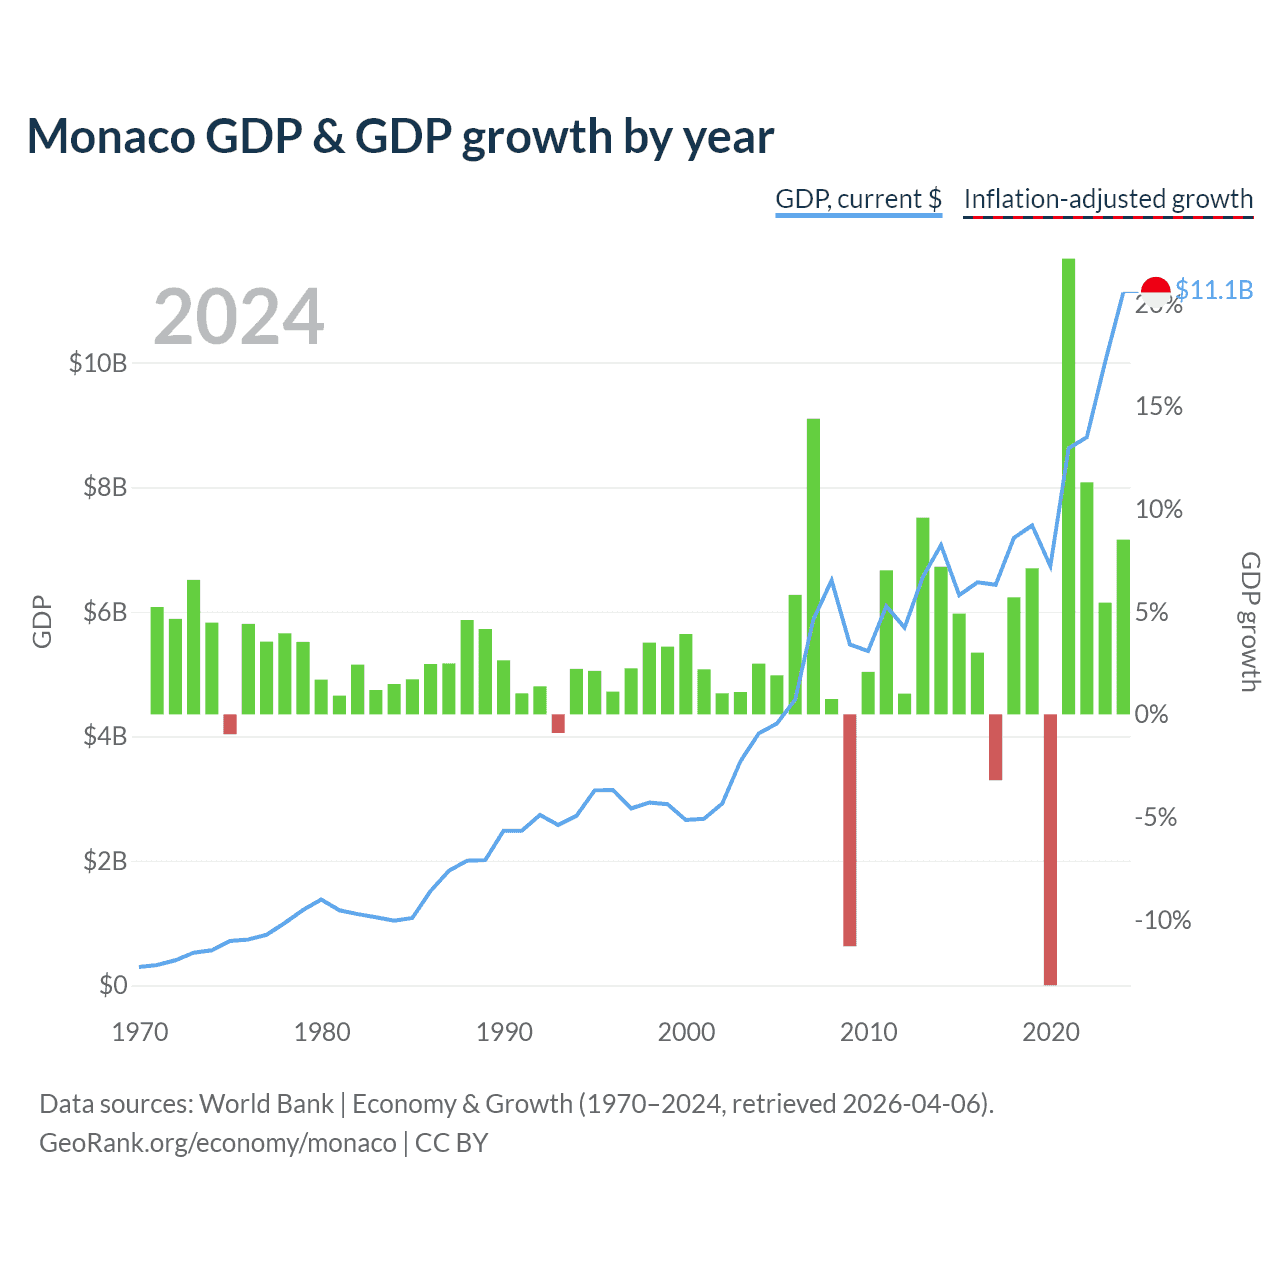
Monaco GDP & GDP growth by year
| Year | GDP | GDP growth |
|---|---|---|
| 2024 | $11,125,788,838 | 8.51% |
| 2023 | $10,003,897,341 | 5.44% |
| 2022 | $8,800,432,774 | 11.3% |
| 2021 | $8,623,241,327 | 22.2% |
| 2020 | $6,730,733,231 | -13.2% |
| 2019 | $7,383,494,129 | 7.12% |
| 2018 | $7,184,336,760 | 5.7% |
| 2017 | $6,430,258,225 | -3.21% |
| 2016 | $6,471,287,669 | 3.01% |
| 2015 | $6,264,753,586 | 4.91% |
| 2014 | $7,070,015,474 | 7.19% |
| 2013 | $6,555,590,642 | 9.58% |
| 2012 | $5,742,748,406 | 1.01% |
| 2011 | $6,088,690,667 | 7.02% |
| 2010 | $5,367,561,640 | 2.07% |
| 2009 | $5,474,381,528 | -11.3% |
| 2008 | $6,502,945,305 | 0.75% |
| 2007 | $5,875,787,545 | 14.4% |
| 2006 | $4,586,828,062 | 5.82% |
| 2005 | $4,204,651,894 | 1.9% |
| 2004 | $4,043,553,261 | 2.47% |
| 2003 | $3,597,090,047 | 1.09% |
| 2002 | $2,919,647,992 | 1.03% |
| 2001 | $2,673,722,829 | 2.19% |
| 2000 | $2,654,462,466 | 3.91% |
| 1999 | $2,907,118,417 | 3.3% |
| 1998 | $2,934,593,468 | 3.5% |
| 1997 | $2,840,195,190 | 2.24% |
| 1996 | $3,137,886,995 | 1.11% |
| 1995 | $3,130,309,995 | 2.12% |
| 1994 | $2,720,332,135 | 2.22% |
| 1993 | $2,574,494,356 | -0.91% |
| 1992 | $2,737,049,231 | 1.37% |
| 1991 | $2,480,540,845 | 1.02% |
| 1990 | $2,481,307,077 | 2.64% |
| 1989 | $2,010,083,833 | 4.16% |
| 1988 | $2,000,704,745 | 4.6% |
| 1987 | $1,839,081,463 | 2.48% |
| 1986 | $1,515,234,743 | 2.45% |
| 1985 | $1,082,867,507 | 1.71% |
| 1984 | $1,037,329,604 | 1.48% |
| 1983 | $1,092,560,365 | 1.19% |
| 1982 | $1,143,216,457 | 2.43% |
| 1981 | $1,205,188,648 | 0.92% |
| 1980 | $1,378,175,524 | 1.69% |
| 1979 | $1,209,870,147 | 3.53% |
| 1978 | $1,000,555,218 | 3.95% |
| 1977 | $811,191,392 | 3.55% |
| 1976 | $735,324,245 | 4.41% |
| 1975 | $711,978,962 | -0.97% |
| 1974 | $563,949,254 | 4.47% |
| 1973 | $523,554,039 | 6.55% |
| 1972 | $402,451,901 | 4.65% |
| 1971 | $327,706,210 | 5.23% |
| 1970 | $293,127,333 | - |
Data sources: World Bank | Economy & Growth (1970–2024, retrieved 2026-07-08).
GeoRank.org/economy/monaco | CC BY 
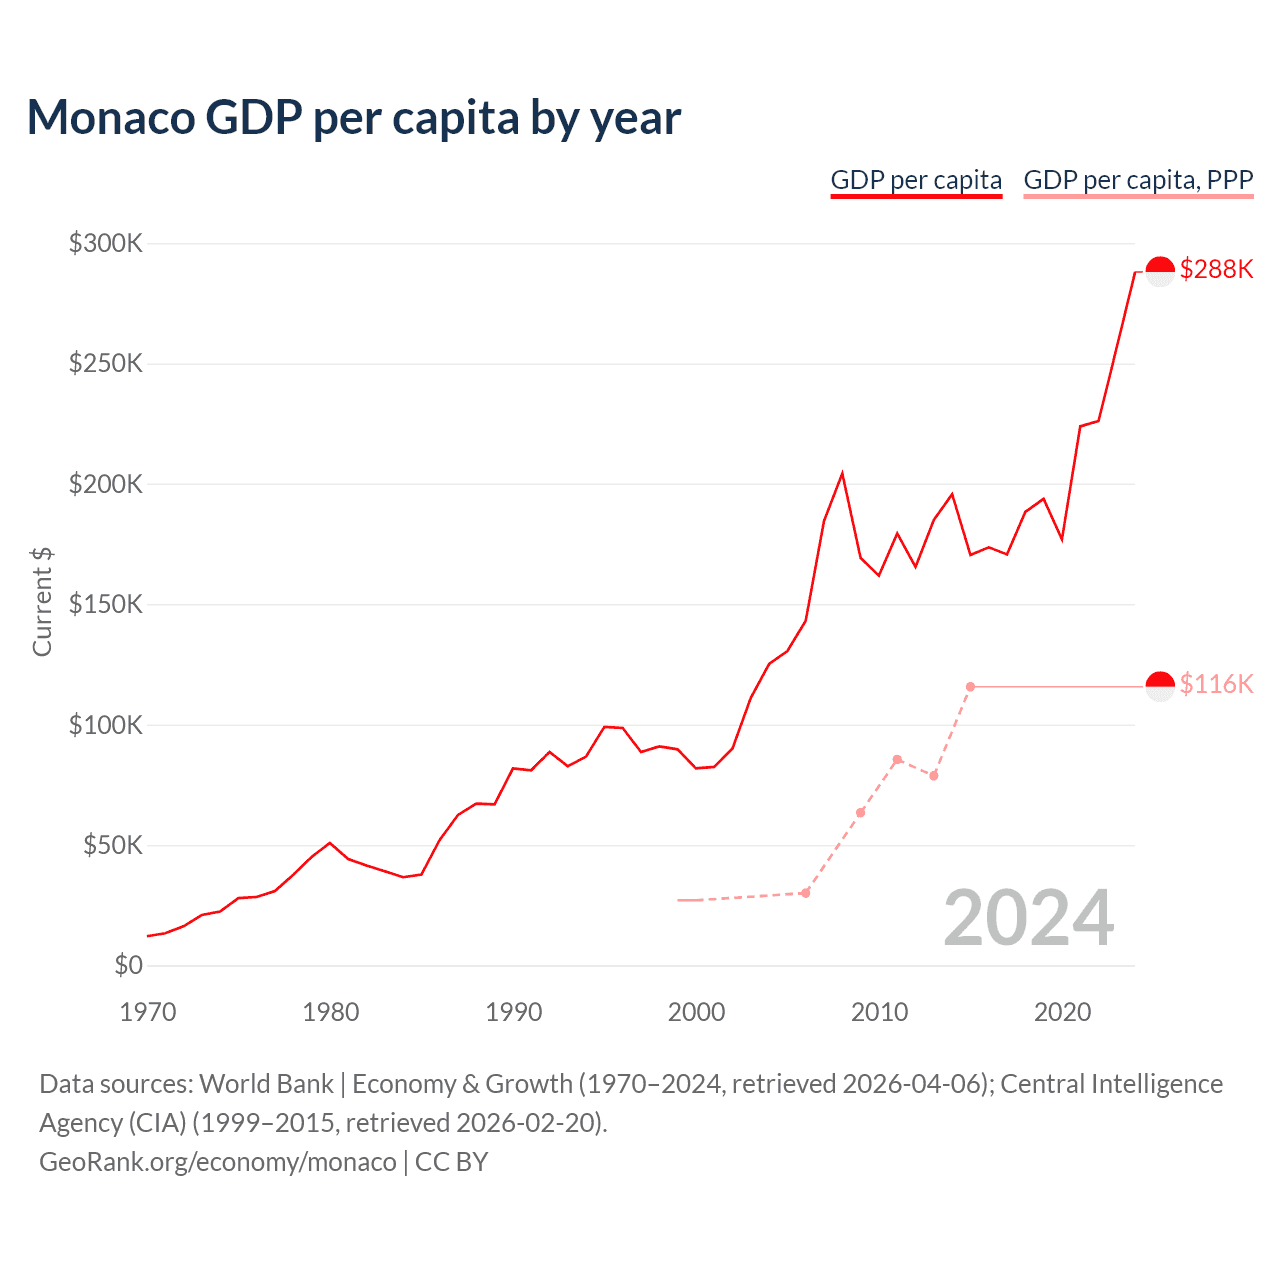
Monaco GDP per capita by year
| Year | Current $ | |
|---|---|---|
| GDP per capita | GDP per capita, PPP | |
| 2024 | $288,002 | - |
| 2023 | $256,800 | - |
| 2022 | $226,052 | - |
| 2021 | $223,823 | - |
| 2020 | $176,892 | - |
| 2019 | $193,747 | - |
| 2018 | $188,298 | - |
| 2017 | $170,663 | - |
| 2016 | $173,605 | - |
| 2015 | $170,437 | $115,700 |
| 2014 | $195,694 | - |
| 2013 | $184,941 | $78,700 |
| 2012 | $165,445 | - |
| 2011 | $179,364 | $85,500 |
| 2010 | $161,854 | - |
| 2009 | $169,150 | $63,400 |
| 2008 | $204,264 | - |
| 2007 | $184,558 | - |
| 2006 | $143,084 | $30,000 |
| 2005 | $130,539 | - |
| 2004 | $125,160 | - |
| 2003 | $111,110 | - |
| 2002 | $90,051 | - |
| 2001 | $82,403 | - |
| 2000 | $81,789 | $27,000 |
| 1999 | $89,698 | $27,000 |
| 1998 | $90,947 | - |
| 1997 | $88,582 | - |
| 1996 | $98,561 | - |
| 1995 | $99,032 | - |
| 1994 | $86,704 | - |
| 1993 | $82,685 | - |
| 1992 | $88,615 | - |
| 1991 | $80,997 | - |
| 1990 | $81,735 | - |
| 1989 | $66,816 | - |
| 1988 | $67,181 | - |
| 1987 | $62,456 | - |
| 1986 | $52,082 | - |
| 1985 | $37,690 | - |
| 1984 | $36,582 | - |
| 1983 | $39,076 | - |
| 1982 | $41,479 | - |
| 1981 | $44,157 | - |
| 1980 | $50,814 | - |
| 1979 | $44,990 | - |
| 1978 | $37,608 | - |
| 1977 | $30,875 | - |
| 1976 | $28,396 | - |
| 1975 | $27,921 | - |
| 1974 | $22,348 | - |
| 1973 | $20,882 | - |
| 1972 | $16,187 | - |
| 1971 | $13,334 | - |
| 1970 | $12,098 | - |
Data sources: World Bank | Economy & Growth (1970–2024, retrieved 2026-07-08); Central Intelligence Agency (CIA) (1999–2015, retrieved 2026-07-08).
GeoRank.org/economy/monaco | CC BY
Monaco has a GDP per capita of $288,002, ranking 1/197, a GDP per capita based on purchasing power parity (PPP) of $115,700, ranking 6/197, and a median annual after tax income of $109,346, ranking 2/197.
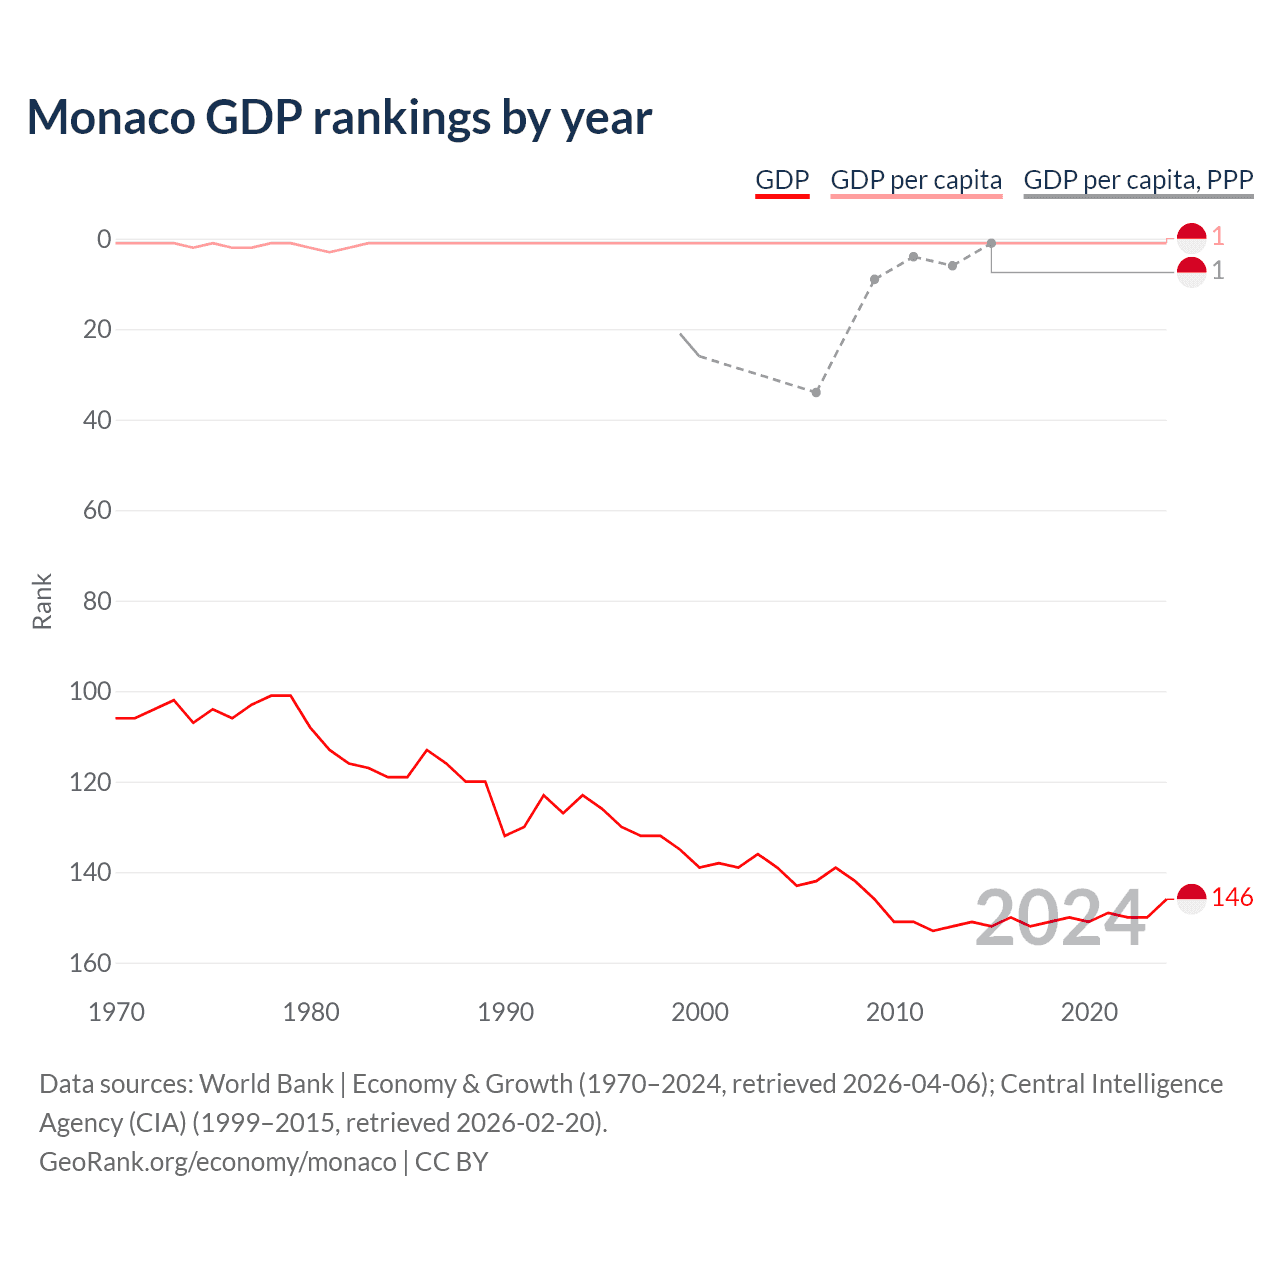
Monaco GDP rankings by year
| Year | Rank | ||
|---|---|---|---|
| GDP | GDP per capita | GDP per capita, PPP | |
| 2024 | 148 | 1 | - |
| 2023 | 150 | 1 | - |
| 2022 | 150 | 1 | - |
| 2021 | 149 | 1 | - |
| 2020 | 151 | 1 | - |
| 2019 | 150 | 1 | - |
| 2018 | 151 | 1 | - |
| 2017 | 152 | 1 | - |
| 2016 | 150 | 1 | - |
| 2015 | 152 | 1 | 1 |
| 2014 | 151 | 1 | - |
| 2013 | 152 | 1 | 6 |
| 2012 | 152 | 1 | - |
| 2011 | 151 | 1 | 4 |
| 2010 | 151 | 1 | - |
| 2009 | 146 | 1 | 9 |
| 2008 | 142 | 1 | - |
| 2007 | 139 | 1 | - |
| 2006 | 142 | 1 | 34 |
| 2005 | 143 | 1 | - |
| 2004 | 139 | 1 | - |
| 2003 | 136 | 1 | - |
| 2002 | 139 | 1 | - |
| 2001 | 138 | 1 | - |
| 2000 | 139 | 1 | 26 |
| 1999 | 135 | 1 | 21 |
| 1998 | 132 | 1 | - |
| 1997 | 132 | 1 | - |
| 1996 | 130 | 1 | - |
| 1995 | 126 | 1 | - |
| 1994 | 123 | 1 | - |
| 1993 | 127 | 1 | - |
| 1992 | 123 | 1 | - |
| 1991 | 130 | 1 | - |
| 1990 | 132 | 1 | - |
| 1989 | 120 | 1 | - |
| 1988 | 120 | 1 | - |
| 1987 | 116 | 1 | - |
| 1986 | 113 | 1 | - |
| 1985 | 119 | 1 | - |
| 1984 | 119 | 1 | - |
| 1983 | 117 | 1 | - |
| 1982 | 116 | 2 | - |
| 1981 | 113 | 3 | - |
| 1980 | 108 | 2 | - |
| 1979 | 101 | 1 | - |
| 1978 | 101 | 1 | - |
| 1977 | 103 | 2 | - |
| 1976 | 106 | 2 | - |
| 1975 | 104 | 1 | - |
| 1974 | 107 | 2 | - |
| 1973 | 102 | 1 | - |
| 1972 | 104 | 1 | - |
| 1971 | 106 | 1 | - |
| 1970 | 106 | 1 | - |
Data sources: World Bank | Economy & Growth (1970–2024, retrieved 2026-07-08); Central Intelligence Agency (CIA) (1999–2015, retrieved 2026-07-08).
GeoRank.org/economy/monaco | CC BY
Compared with 2000, in 2024 Monaco is ranked 148th out of 189 by GDP (down from 139th), 1st by GDP per capita (unchanged from 1st), and 1st by GDP per capita PPP (up from 26th).
Economic indicators
 Monaco
|
Rank | |
|---|---|---|
| Gross domestic product |
$11.1B
2024 |
154/197 |
| GDP growth |
8.51%
2023-2024 |
8/194 |
| GDP per capita |
$288,002
2024 |
1/197 |
| GDP per capita, PPP |
$115,700
2015 |
6/197 |
| Average annual personal income after taxes |
$109,346
2026 |
2/197 |
| Number of billionaires |
2
2026 |
56/74 |
| Billionaire frequency |
1 in 15,738
2026 |
1/74 |
| Government expenditure, % of GDP |
20%
2026 |
155/195 |
| Consumer prices inflation |
1.5%
2019-2020 |
144/195 |
| Unemployment rate |
6.33%
2016 |
76/196 |
| Population |
38054
|
191/197 |
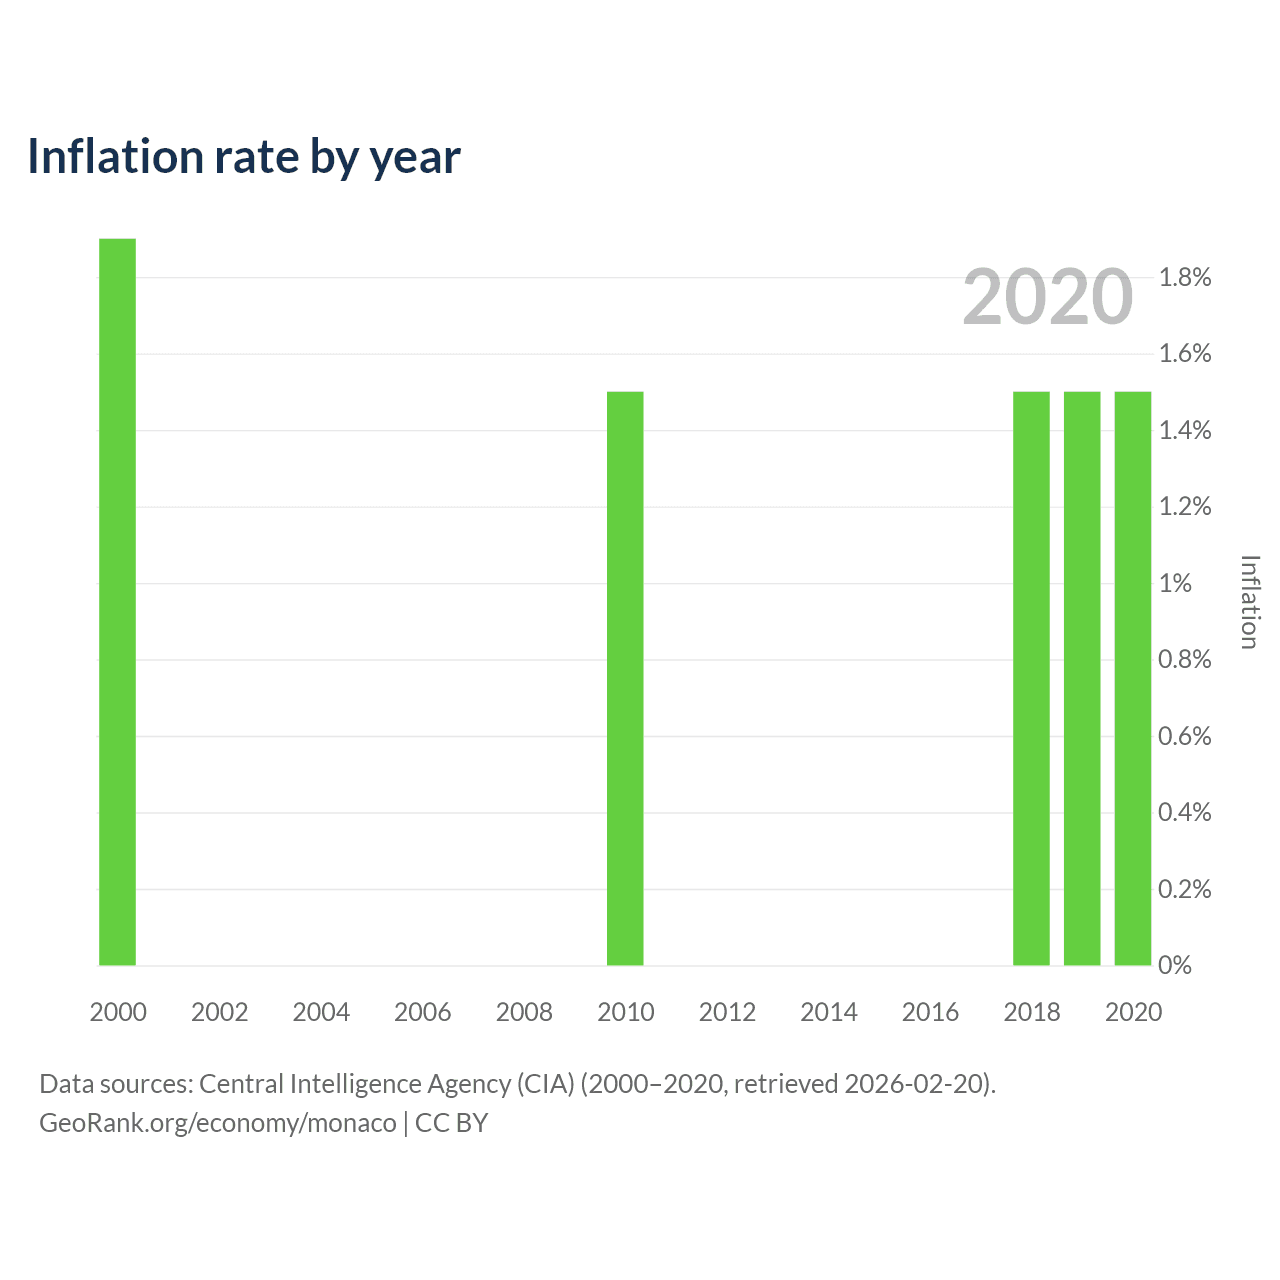
Inflation rate by year
| Year | Inflation |
|---|---|
| 2020 | 1.5% |
| 2019 | 1.5% |
| 2018 | 1.5% |
| 2017 | - |
| 2016 | - |
| 2015 | - |
| 2014 | - |
| 2013 | - |
| 2012 | - |
| 2011 | - |
| 2010 | 1.5% |
| 2009 | - |
| 2008 | - |
| 2007 | - |
| 2006 | - |
| 2005 | - |
| 2004 | - |
| 2003 | - |
| 2002 | - |
| 2001 | - |
| 2000 | 1.9% |
Data sources: Central Intelligence Agency (CIA) (2000–2020, retrieved 2026-07-08).
GeoRank.org/economy/monaco | CC BY
Over the past 4 years, Monaco has had an average annual inflation rate of 1.5%. In 2020, inflation was 1.5%. The bar chart above shows consumer price inflation by year.
Monaco top 10 trading partners
Monaco's biggest trading partner accounting for 36.3% of all exports and imports is New Zealand, with a trade balance between the two of -$711M: Monaco exports $0 worth of goods and services to New Zealand and imports $711M.
Below is the list of the top 10 trade partners of Monaco.
| Rank | Country | Trade value | Share of total trade | Export to | Import from | Top export to | Top import from |
|---|---|---|---|---|---|---|---|
| 1 |
 New Zealand
|
$711M | 36.3% | $0 | $711M | Animal & marine products | Raw agricultural goods |
| 2 |
 Senegal
|
$651M | 33.2% | $637M | $13.7M | Raw materials & minerals | Machinery & equipment |
| 3 |
 Pakistan
|
$182M | 9.32% | $180M | $2.92M | Metals | Textiles & consumer goods |
| 4 |
 Uruguay
|
$117M | 5.97% | $58.4M | $58.5M | Machinery & equipment | Raw agricultural goods |
| 5 |
 Russia
|
$109M | 5.57% | $109M | $0 | Precious metals & jewellery | Animal & marine products |
| 6 |
 Gabon
Gabon
|
$62.5M | 3.19% | $62.5M | $0 | Machinery & equipment | Animal & marine products |
| 7 |
 Madagascar
|
$57.4M | 2.93% | $57.3M | $62K | Machinery & equipment | Raw materials & minerals |
| 8 |
 Mauritius
|
$54.1M | 2.77% | $38.4M | $15.7M | Chemicals & pharma | Processed food, beverages & tobacco |
| 9 |
 CAR
CAR
|
$8.34M | 0.43% | $8.33M | $7K | Chemicals & pharma | Machinery & equipment |
| 10 |
 Papua New Guinea
|
$3.08M | 0.16% | $3.08M | $0 | Animal & marine products | Animal & marine products |
Top 10 exports
|
Monaco
|
Rank | |
|---|---|---|
| Transport & tourism services | $22.3B | 34/191 |
| Business & finance services | $19.1B | 27/189 |
| IT & IP services | $9.97B | 26/185 |
| Manufacturing & construction services | $7.02B | 18/166 |
| Government & miscellaneous services | $304M | 45/187 |
| Machinery & equipment | $120M | 122/193 |
| Metals | $93.4M | 123/192 |
| Textiles & consumer goods | $43.5M | 132/193 |
| Chemicals & pharma | $33.9M | 131/193 |
| Processed food, beverages & tobacco | $18.8M | 156/192 |
Top 10 imports
|
Monaco
|
Rank | |
|---|---|---|
| Transport & tourism services | $34.1B | 25/191 |
| Business & finance services | $18.9B | 29/189 |
| IT & IP services | $10B | 26/185 |
| Manufacturing & construction services | $7.56B | 14/170 |
| Raw agricultural goods | $752M | 97/193 |
| Government & miscellaneous services | $608M | 35/187 |
| Processed food, beverages & tobacco | $13.2M | 191/193 |
| Animal & marine products | $11.9M | 183/193 |
| Wood & paper products | $3.6M | 188/193 |
| Metals | $2.75M | 192/193 |
Economic freedom indices
|
Monaco
|
Rank | |
|---|---|---|
| Economic freedom | 83 | 4/197 |
Other economic metrics
|
Monaco
|
Rank | |
|---|---|---|
| Services, % of GDP |
87.2%
2024 |
1/191 |
| Industry, % of GDP |
12.8%
2024 |
171/194 |
Compare Monaco vs other countries
GDP per capita map
Data sources: World Bank | Economy & Growth (1985–2025, retrieved 2026-07-08); U.S. Census Bureau (1985–2025, retrieved 2026-07-08).
GeoRank.org/economy/monaco | CC BY
Help us show the world through your eyes
Share a photo of your city and help others discover what it looks like to live there. Your contribution makes our data come alive.
Data sources:
- World Bank | Economy & Growth (1970–2026, retrieved 2026-07-08)
- U.S. Census Bureau (1985–2025, retrieved 2026-07-08)
- TradeMap (2024–2025, retrieved 2026-07-08)
- Central Intelligence Agency (CIA) (1999–2020, retrieved 2026-07-08)
- United Nations | World Population Prospects (2026, retrieved 2026-07-08)
- LivingCost (2026, retrieved 2026-07-08)
Creative Commons Attribution (CC BY) — you’re free to copy, share, remix, adapt, and use even commercially as long as you give appropriate credit and clearly indicate if you made changes. Other sources may be subject to different license terms.