India has a GDP of $3.96T compared to $85.3B for Uruguay, ranking 6/197 and 84/197 by economy size, respectively.
India has $3.33T in government debt (84.1% of GDP), compared to $56B (65.7% of GDP) in Uruguay.
India vs Uruguay GDP by year
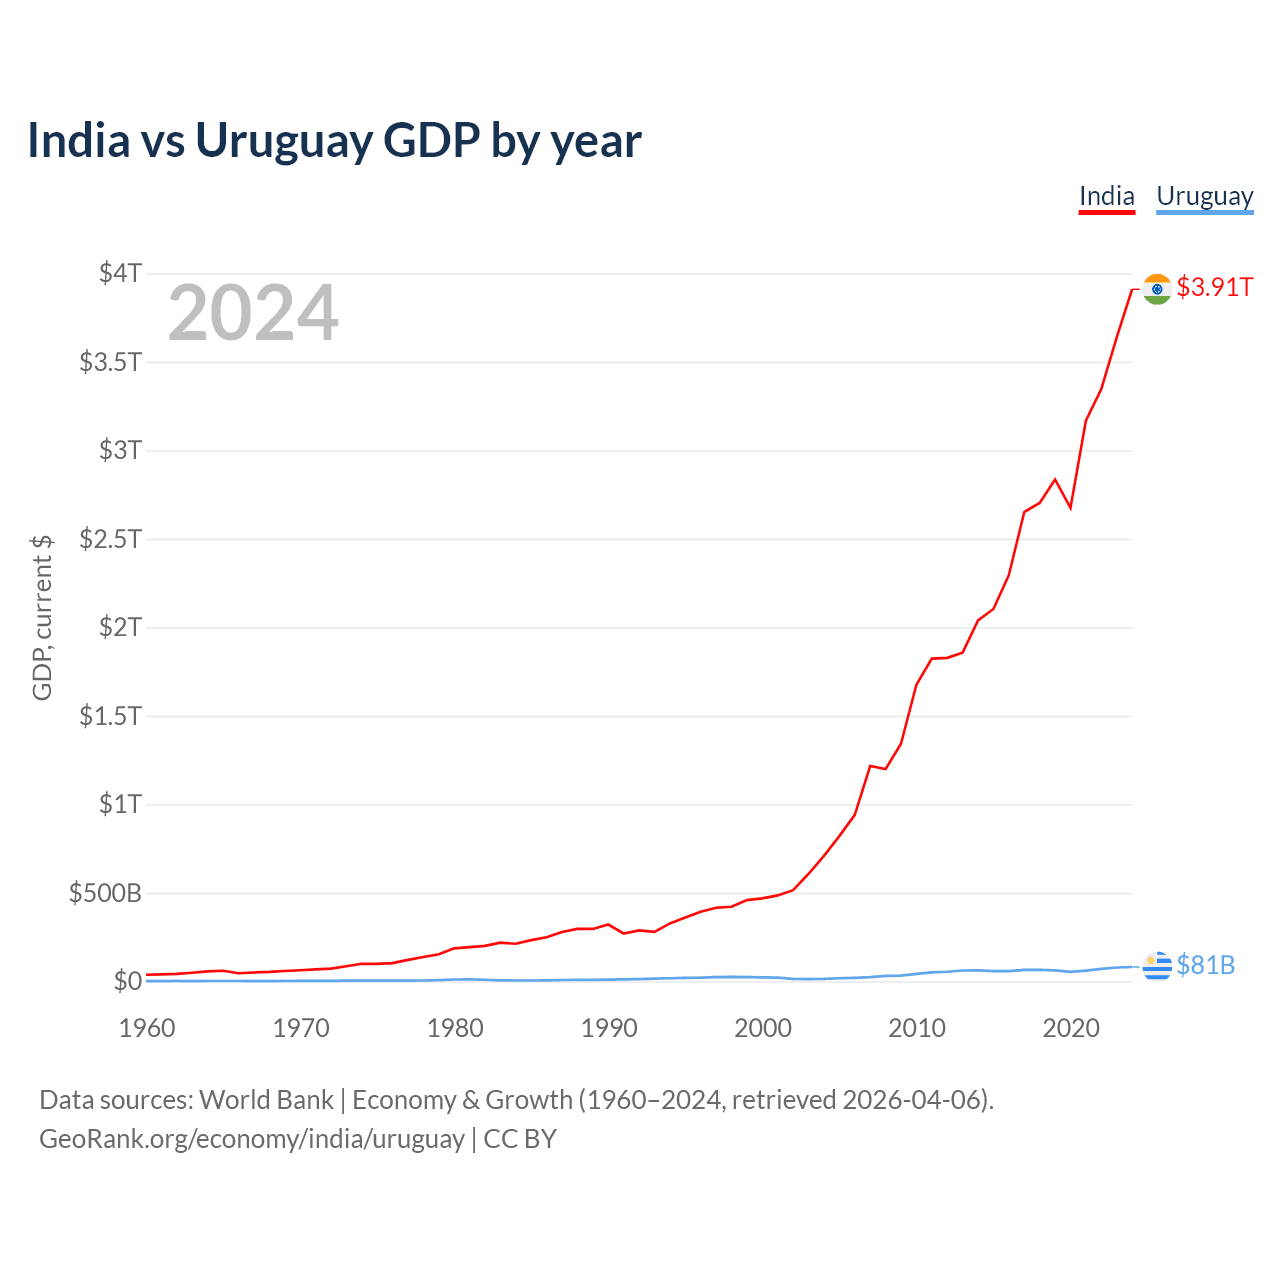
| Year | GDP, current $ | |
|---|---|---|
 India
India
|
 Uruguay
|
|
| 2025 | $3,956,067,115,772 | $85,347,696,278 |
| 2024 | $3,760,813,470,501 | $82,322,859,144 |
| 2023 | $3,500,906,030,645 | $79,208,725,900 |
| 2022 | $3,249,938,492,013 | $71,240,669,088 |
| 2021 | $3,167,270,623,260 | $60,739,061,281 |
| 2020 | $2,674,851,578,587 | $53,559,354,501 |
| 2019 | $2,835,606,256,558 | $62,222,324,965 |
| 2018 | $2,702,929,641,649 | $65,344,577,416 |
| 2017 | $2,651,474,262,755 | $65,006,039,810 |
| 2016 | $2,294,796,885,663 | $57,480,787,465 |
| 2015 | $2,103,588,360,045 | $57,680,327,999 |
| 2014 | $2,039,126,479,155 | $61,496,186,974 |
| 2013 | $1,856,721,507,622 | $61,337,621,934 |
| 2012 | $1,827,637,590,410 | $54,232,266,359 |
| 2011 | $1,823,051,829,895 | $50,342,406,067 |
| 2010 | $1,675,615,519,485 | $41,950,361,212 |
| 2009 | $1,341,888,016,995 | $32,708,319,078 |
| 2008 | $1,198,895,139,006 | $31,119,602,539 |
| 2007 | $1,216,736,438,835 | $23,797,773,024 |
| 2006 | $940,259,888,788 | $19,741,420,740 |
| 2005 | $820,383,763,511 | $17,362,857,684 |
| 2004 | $709,152,728,831 | $13,686,329,890 |
| 2003 | $607,700,687,237 | $12,045,638,352 |
| 2002 | $514,939,140,319 | $13,606,515,723 |
| 2001 | $485,440,139,204 | $20,898,761,742 |
| 2000 | $468,395,521,654 | $22,823,270,892 |
| 1999 | $458,821,052,616 | $23,983,945,191 |
| 1998 | $421,351,317,225 | $25,385,886,978 |
| 1997 | $415,867,563,593 | $23,969,739,234 |
| 1996 | $392,896,866,205 | $20,515,458,114 |
| 1995 | $360,281,909,643 | $19,297,663,097 |
| 1994 | $327,274,843,459 | $17,474,588,896 |
| 1993 | $279,295,648,983 | $15,002,136,971 |
| 1992 | $288,208,070,278 | $12,878,148,791 |
| 1991 | $270,105,341,879 | $11,206,176,651 |
| 1990 | $320,979,026,420 | $9,298,807,850 |
| 1989 | $296,042,052,945 | $8,438,951,476 |
| 1988 | $296,589,670,896 | $8,213,538,369 |
| 1987 | $279,033,584,092 | $7,367,494,080 |
| 1986 | $248,985,994,041 | $5,880,112,788 |
| 1985 | $232,511,554,840 | $4,732,017,873 |
| 1984 | $212,157,645,178 | $4,850,238,550 |
| 1983 | $218,262,146,413 | $5,102,276,308 |
| 1982 | $200,715,624,831 | $9,178,780,077 |
| 1981 | $193,491,368,446 | $11,048,301,421 |
| 1980 | $186,328,579,302 | $10,163,020,116 |
| 1979 | $152,995,442,498 | $7,181,182,224 |
| 1978 | $137,302,319,829 | $4,910,254,566 |
| 1977 | $121,486,641,441 | $4,114,670,014 |
| 1976 | $102,716,451,980 | $3,667,161,241 |
| 1975 | $98,473,832,017 | $3,538,278,047 |
| 1974 | $99,526,597,934 | $4,090,209,682 |
| 1973 | $85,517,673,173 | $3,964,296,443 |
| 1972 | $71,464,700,667 | $2,189,418,689 |
| 1971 | $67,351,404,352 | $2,807,258,065 |
| 1970 | $62,422,483,055 | $2,137,096,774 |
| 1969 | $58,447,995,017 | $2,004,435,484 |
| 1968 | $53,085,455,871 | $1,593,674,185 |
| 1967 | $50,134,942,204 | $1,597,713,469 |
| 1966 | $45,581,230,504 | $1,809,185,094 |
| 1965 | $59,556,105,229 | $1,890,767,156 |
| 1964 | $56,480,289,941 | $1,975,701,816 |
| 1963 | $48,421,923,459 | $1,539,681,491 |
| 1962 | $42,161,481,858 | $1,710,004,407 |
| 1961 | $39,232,435,784 | $1,547,388,781 |
| 1960 | $37,029,883,876 | $1,242,289,239 |
Data sources: World Bank | Economy & Growth (1960–2025, retrieved 2026-07-08).
GeoRank.org/economy/india/uruguay | CC BY 
GDP per capita in India vs Uruguay by year
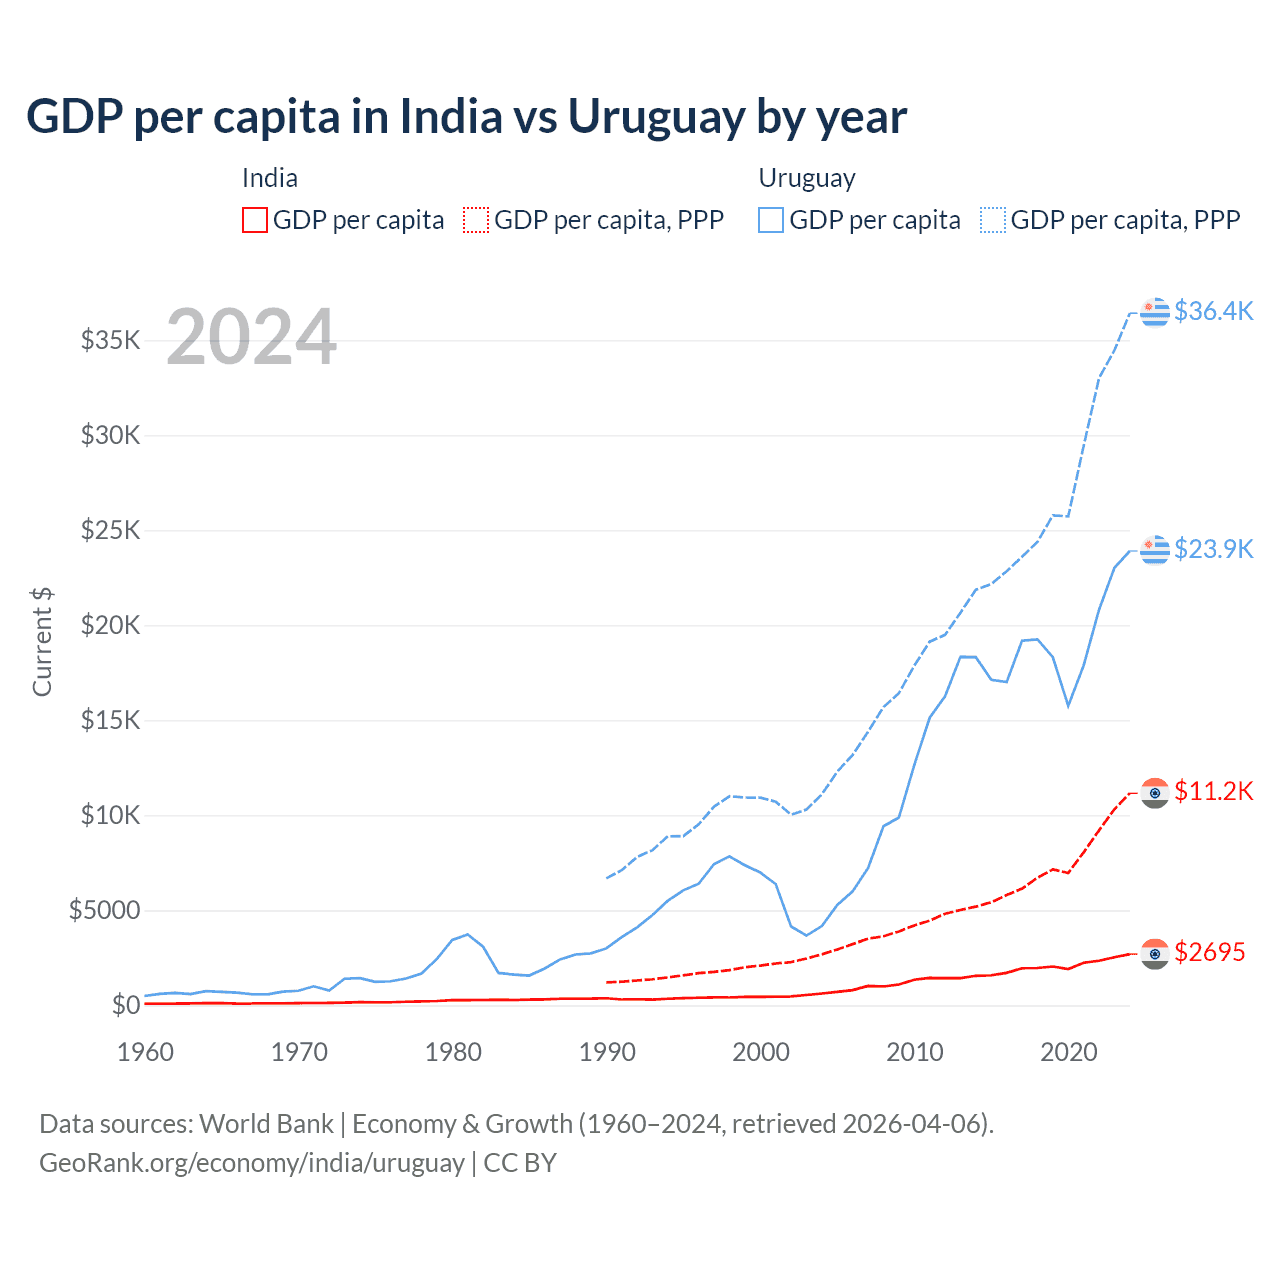
| Year | Current $ | |||
|---|---|---|---|---|
|
India
|
Uruguay
|
|||
| GDP per capita | GDP per capita, PPP | GDP per capita | GDP per capita, PPP | |
| 2025 | $2,702 | - | $25,216 | - |
| 2024 | $2,592 | $11,160 | $24,308 | $36,418 |
| 2023 | $2,434 | $10,323 | $23,379 | $34,471 |
| 2022 | $2,280 | $9,207 | $21,009 | $33,001 |
| 2021 | $2,240 | $8,050 | $17,882 | $29,432 |
| 2020 | $1,907 | $6,966 | $15,758 | $25,725 |
| 2019 | $2,041 | $7,151 | $18,316 | $25,783 |
| 2018 | $1,966 | $6,715 | $19,250 | $24,386 |
| 2017 | $1,950 | $6,145 | $19,185 | $23,607 |
| 2016 | $1,708 | $5,800 | $17,010 | $22,841 |
| 2015 | $1,584 | $5,425 | $17,126 | $22,169 |
| 2014 | $1,554 | $5,192 | $18,322 | $21,868 |
| 2013 | $1,433 | $5,014 | $18,335 | $20,661 |
| 2012 | $1,429 | $4,820 | $16,260 | $19,495 |
| 2011 | $1,445 | $4,455 | $15,132 | $19,135 |
| 2010 | $1,348 | $4,206 | $12,641 | $17,873 |
| 2009 | $1,095 | $3,887 | $9,881 | $16,422 |
| 2008 | $993 | $3,633 | $9,424 | $15,694 |
| 2007 | $1,022 | $3,508 | $7,222 | $14,397 |
| 2006 | $802 | $3,221 | $6,001 | $13,179 |
| 2005 | $710 | $2,937 | $5,284 | $12,296 |
| 2004 | $624 | $2,682 | $4,169 | $11,103 |
| 2003 | $544 | $2,461 | $3,671 | $10,303 |
| 2002 | $469 | $2,277 | $4,150 | $10,030 |
| 2001 | $450 | $2,200 | $6,383 | $10,719 |
| 2000 | $443 | $2,091 | $6,988 | $10,929 |
| 1999 | $442 | $2,006 | $7,371 | $10,938 |
| 1998 | $414 | $1,852 | $7,837 | $11,002 |
| 1997 | $416 | $1,759 | $7,436 | $10,461 |
| 1996 | $401 | $1,695 | $6,398 | $9,524 |
| 1995 | $375 | $1,579 | $6,050 | $8,906 |
| 1994 | $348 | $1,467 | $5,508 | $8,897 |
| 1993 | $303 | $1,374 | $4,753 | $8,162 |
| 1992 | $319 | $1,309 | $4,102 | $7,808 |
| 1991 | $306 | $1,239 | $3,589 | $7,112 |
| 1990 | $371 | $1,212 | $2,995 | $6,683 |
| 1989 | $350 | - | $2,734 | - |
| 1988 | $358 | - | $2,677 | - |
| 1987 | $345 | - | $2,416 | - |
| 1986 | $315 | - | $1,939 | - |
| 1985 | $301 | - | $1,568 | - |
| 1984 | $281 | - | $1,615 | - |
| 1983 | $296 | - | $1,707 | - |
| 1982 | $278.7 | - | $3,085 | - |
| 1981 | $275 | - | $3,728 | - |
| 1980 | $271.1 | - | $3,443 | - |
| 1979 | $228 | - | $2,443 | - |
| 1978 | $209.4 | - | $1,678 | - |
| 1977 | $189.6 | - | $1,414 | - |
| 1976 | $164.1 | - | $1,268 | - |
| 1975 | $161.1 | - | $1,232 | - |
| 1974 | $166.7 | - | $1,433 | - |
| 1973 | $146.6 | - | $1,397 | - |
| 1972 | $125.3 | - | $776 | - |
| 1971 | $120.7 | - | $1,000 | - |
| 1970 | $114.4 | - | $766 | - |
| 1969 | $109.5 | - | $723 | - |
| 1968 | $101.6 | - | $579 | - |
| 1967 | $98 | - | $585 | - |
| 1966 | $91 | - | $668 | - |
| 1965 | $121.5 | - | $705 | - |
| 1964 | $117.9 | - | $745 | - |
| 1963 | $103.4 | - | $587 | - |
| 1962 | $92.2 | - | $659 | - |
| 1961 | $87.9 | - | $604 | - |
| 1960 | $84.9 | - | $491 | - |
Data sources: World Bank | Economy & Growth (1960–2025, retrieved 2026-07-08).
GeoRank.org/economy/india/uruguay | CC BY
India's GDP per capita is $2,702, ranking 149/197, compared to $25,216 in Uruguay, ranking 54/197. Adjusted for purchasing power (GDP per capita PPP), India ranks 130th at $11,160, while Uruguay ranks 61st at $36,418.
Economic indicators
|
India
|
Uruguay
|
|
|---|---|---|
| Gross domestic product |
$3.96T
2025 |
$85.3B
2025 |
| GDP rank |
6/197
2025 |
84/197
2025 |
| GDP growth |
7.57%
2024-2025 |
1.78%
2024-2025 |
| GDP per capita |
$2,702
2025 |
$25,216
2025 |
| GDP per capita rank |
149/197
2025 |
54/197
2025 |
| GDP per capita, PPP |
$11,160
2024 |
$36,418
2024 |
| GDP per capita PPP rank |
130/197
2024 |
61/197
2024 |
| Government debt |
$3.33T
2025 |
$56B
2025 |
| Debt-to-GDP ratio |
84.1%
2025 |
65.7%
2025 |
| Government debt per person |
$2,272
2025 |
$16,559
2025 |
| Government debt per person rank |
116/185
2025 |
41/185
2025 |
| Average annual personal income after taxes |
$2,974
2026 |
$14,046
2026 |
| Market capitalization of domestic companies |
$10.6T
2025 |
$284M
1996 |
| Number of millionaires |
944,000
2026 |
n/a |
| Number of billionaires |
229
2026 |
n/a |
| Income share by richest 10% |
22.1%
2022 |
30%
2024 |
| Income share by poorest 10% |
4.5%
2022 |
2.2%
2024 |
| Government expenditure, % of GDP |
28.5%
2025 |
31.5%
2025 |
| Consumer prices inflation |
2.4%
2024-2025 |
4.65%
2024-2025 |
| Central bank interest rate |
5.25%
2025 |
5.75%
2026 |
| Unemployment rate |
4.51%
2025 |
8.21%
2024 |
| Population |
1483314140
|
3382672
|
Spending and national debt comparison by year
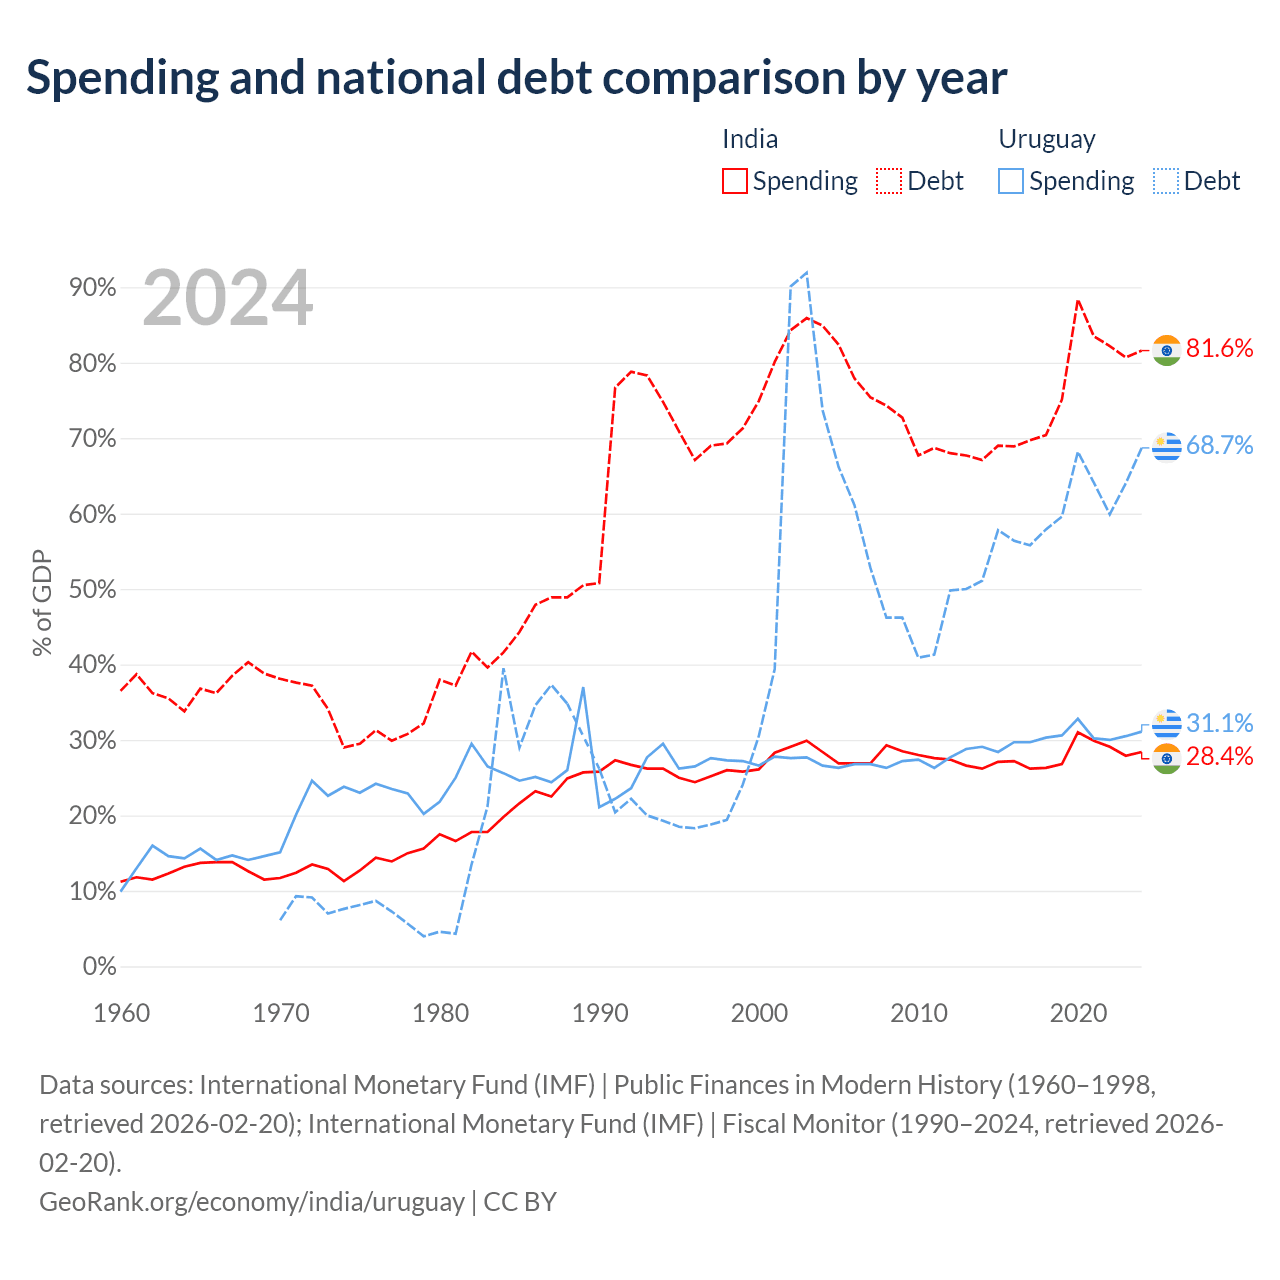
| Year | % of GDP | |||
|---|---|---|---|---|
|
India
|
Uruguay
|
|||
| Government spending | Government debt | Government spending | Government debt | |
| 2025 | 28.5% | 84.1% | 31.5% | 65.7% |
| 2024 | 29.3% | 84.8% | 30.6% | 67.6% |
| 2023 | 29.7% | 85% | 30.1% | 63% |
| 2022 | 30% | 84.6% | 29.7% | 59.4% |
| 2021 | 30.7% | 85.7% | 30.2% | 64.1% |
| 2020 | 31.8% | 90.6% | 32.8% | 68.2% |
| 2019 | 27.4% | 76.7% | 30.6% | 59.6% |
| 2018 | 26.8% | 71.7% | 30.3% | 57.9% |
| 2017 | 26.6% | 70.8% | 29.7% | 55.8% |
| 2016 | 27.6% | 69.8% | 29.7% | 56.4% |
| 2015 | 27.3% | 69.8% | 28.4% | 57.8% |
| 2014 | 26.2% | 67.6% | 29.1% | 51.1% |
| 2013 | 26.5% | 68% | 28.8% | 50% |
| 2012 | 27.2% | 68.1% | 27.7% | 49.8% |
| 2011 | 27.3% | 68.7% | 26.3% | 41.3% |
| 2010 | 27.7% | 67.7% | 27.4% | 40.9% |
| 2009 | 28.1% | 72.7% | 27.2% | 46.2% |
| 2008 | 28.3% | 74.3% | 26.3% | 46.2% |
| 2007 | 26.1% | 75.4% | 26.8% | 52.8% |
| 2006 | 25.6% | 77.9% | 26.8% | 61.1% |
| 2005 | 26% | 82.4% | 26.3% | 66.2% |
| 2004 | 28.4% | 84.9% | 26.6% | 73.7% |
| 2003 | 29.9% | 85.9% | 27.7% | 91.9% |
| 2002 | 29.1% | 84.3% | 27.6% | 90.1% |
| 2001 | 28.3% | 80.1% | 27.8% | 39.4% |
| 2000 | 26.1% | 74.9% | 26.6% | 30.5% |
| 1999 | 25.8% | 71.3% | 27.2% | 24.1% |
| 1998 | 26% | 69.3% | 27.3% | 19.4% |
| 1997 | 25.2% | 69% | 27.6% | 18.8% |
| 1996 | 24.4% | 67.1% | 26.5% | 18.3% |
| 1995 | 25% | 70.9% | 26.2% | 18.5% |
| 1994 | 26.2% | 74.8% | 29.5% | 19.3% |
| 1993 | 26.2% | 78.3% | 27.7% | 20% |
| 1992 | 26.7% | 78.8% | 23.6% | 22.2% |
| 1991 | 26.8% | 76.7% | 22.2% | 20.4% |
| 1990 | 25.4% | 50.8% | 21.1% | 26.2% |
| 1989 | 25.7% | 50.5% | 37% | - |
| 1988 | 24.9% | 48.9% | 26% | 34.8% |
| 1987 | 22.5% | 48.9% | 24.4% | 37.3% |
| 1986 | 23.2% | 47.9% | 25.1% | 34.6% |
| 1985 | 21.6% | 44.3% | 24.6% | 29% |
| 1984 | 19.8% | 41.6% | 25.6% | 39.5% |
| 1983 | 17.8% | 39.6% | 26.5% | 21.2% |
| 1982 | 17.8% | 41.7% | 29.5% | 13.5% |
| 1981 | 16.6% | 37.2% | 25% | 4.32% |
| 1980 | 17.5% | 38% | 21.8% | 4.59% |
| 1979 | 15.6% | 32.2% | 20.2% | 3.98% |
| 1978 | 15% | 30.8% | 22.9% | 5.64% |
| 1977 | 13.9% | 29.9% | 23.5% | 7.26% |
| 1976 | 14.4% | 31.3% | 24.2% | 8.67% |
| 1975 | 12.7% | 29.5% | 23% | 8.13% |
| 1974 | 11.3% | 29% | 23.8% | 7.61% |
| 1973 | 12.9% | 34.1% | 22.6% | 7% |
| 1972 | 13.5% | 37.2% | 24.6% | 9.12% |
| 1971 | 12.4% | 37.6% | 20.1% | 9.3% |
| 1970 | 11.7% | 38.1% | 15.1% | 6.11% |
| 1969 | 11.5% | 38.8% | 14.6% | - |
| 1968 | 12.6% | 40.3% | 14.1% | - |
| 1967 | 13.8% | 38.5% | 14.7% | - |
| 1966 | 13.8% | 36.2% | 14.1% | - |
| 1965 | 13.7% | 36.8% | 15.6% | - |
| 1964 | 13.2% | 33.8% | 14.3% | - |
| 1963 | 12.3% | 35.5% | 14.6% | - |
| 1962 | 11.5% | 36.2% | 16% | - |
| 1961 | 11.8% | 38.7% | 13% | - |
| 1960 | 11.2% | 36.5% | 9.9% | - |
Data sources: International Monetary Fund (IMF) | Public Finances in Modern History (1960–1998, retrieved 2026-07-08); International Monetary Fund (IMF) | Fiscal Monitor (1990–2025, retrieved 2026-07-08).
GeoRank.org/economy/india/uruguay | CC BY
In 2025, India's government spending was $1.13T, accounting for 28.5% of its GDP, while Uruguay spent $26.9B, or 31.5% of GDP.
Debt-to-GDP ratio is 84.1% in India and 65.7% in Uruguay, ranking 38/185 and 66/185, respectively.
Government deficit by year
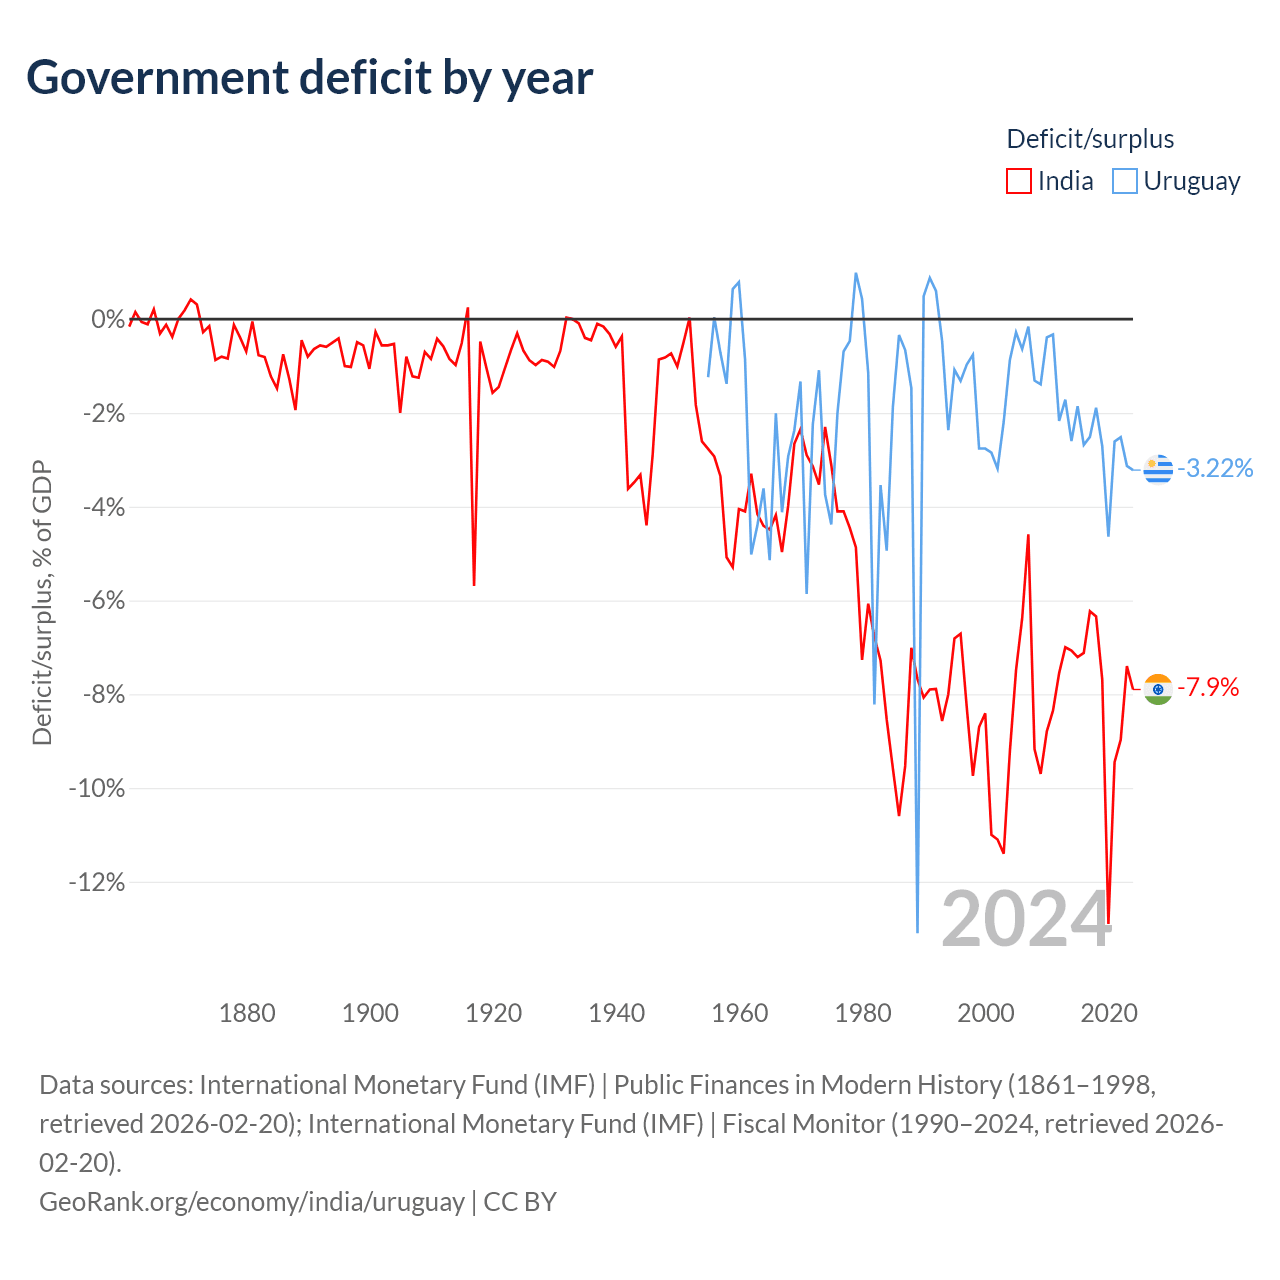
| Year | Deficit/surplus, % of GDP | |
|---|---|---|
|
India
|
Uruguay
|
|
| 2025 | -7.44% | -3.36% |
| 2024 | -7.85% | -3.16% |
| 2023 | -8.37% | -3.09% |
| 2022 | -9.23% | -2.5% |
| 2021 | -9.7% | -2.61% |
| 2020 | -13.2% | -4.64% |
| 2019 | -7.86% | -2.71% |
| 2018 | -6.46% | -1.89% |
| 2017 | -6.33% | -2.51% |
| 2016 | -7.21% | -2.68% |
| 2015 | -7.28% | -1.86% |
| 2014 | -6.9% | -2.6% |
| 2013 | -6.78% | -1.72% |
| 2012 | -7.32% | -2.17% |
| 2011 | -8.03% | -0.33% |
| 2010 | -8.53% | -0.39% |
| 2009 | -9.26% | -1.39% |
| 2008 | -8.15% | -1.31% |
| 2007 | -3.73% | -0.16% |
| 2006 | -5.11% | -0.64% |
| 2005 | -6.64% | -0.28% |
| 2004 | -9.22% | -0.87% |
| 2003 | -11.4% | -2.19% |
| 2002 | -11.1% | -3.19% |
| 2001 | -11% | -2.85% |
| 2000 | -8.41% | -2.76% |
| 1999 | -8.7% | -2.76% |
| 1998 | -9.74% | -0.76% |
| 1997 | -8.28% | -0.97% |
| 1996 | -6.71% | -1.32% |
| 1995 | -6.81% | -1.08% |
| 1994 | -8% | -2.37% |
| 1993 | -8.57% | -0.47% |
| 1992 | -7.89% | 0.6% |
| 1991 | -7.44% | 0.88% |
| 1990 | -7.63% | 0.49% |
| 1989 | -7.68% | -13.1% |
| 1988 | -7.01% | -1.47% |
| 1987 | -9.53% | -0.66% |
| 1986 | -10.6% | -0.34% |
| 1985 | -9.58% | -1.88% |
| 1984 | -8.54% | -4.94% |
| 1983 | -7.28% | -3.54% |
| 1982 | -6.78% | -8.22% |
| 1981 | -6.07% | -1.15% |
| 1980 | -7.27% | 0.43% |
| 1979 | -4.87% | 0.99% |
| 1978 | -4.45% | -0.47% |
| 1977 | -4.1% | -0.69% |
| 1976 | -4.1% | -2.01% |
| 1975 | -3.11% | -4.38% |
| 1974 | -2.3% | -3.74% |
| 1973 | -3.53% | -1.09% |
| 1972 | -3.14% | -2.25% |
| 1971 | -2.9% | -5.86% |
| 1970 | -2.35% | -1.33% |
| 1969 | -2.66% | -2.37% |
| 1968 | -3.98% | -2.93% |
| 1967 | -4.97% | -4.12% |
| 1966 | -4.18% | -2.01% |
| 1965 | -4.49% | -5.14% |
| 1964 | -4.41% | -3.61% |
| 1963 | -4.16% | -4.4% |
| 1962 | -3.3% | -5.02% |
| 1961 | -4.1% | -0.86% |
| 1960 | -4.05% | 0.79% |
| 1959 | -5.29% | 0.64% |
| 1958 | -5.08% | -1.38% |
| 1957 | -3.35% | -0.72% |
| 1956 | -2.93% | 0.04% |
| 1955 | -2.77% | -1.24% |
| 1954 | -2.61% | - |
| 1953 | -1.83% | - |
| 1952 | 0.03% | - |
| 1951 | -0.5% | - |
| 1950 | -1.01% | - |
| 1949 | -0.73% | - |
| 1948 | -0.82% | - |
| 1947 | -0.86% | - |
| 1946 | -2.89% | - |
| 1945 | -4.4% | - |
| 1944 | -3.32% | - |
| 1943 | -3.48% | - |
| 1942 | -3.62% | - |
| 1941 | -0.37% | - |
| 1940 | -0.59% | - |
| 1939 | -0.32% | - |
| 1938 | -0.16% | - |
| 1937 | -0.1% | - |
| 1936 | -0.45% | - |
| 1935 | -0.4% | - |
| 1934 | -0.09% | - |
| 1933 | 0% | - |
| 1932 | 0.03% | - |
| 1931 | -0.68% | - |
| 1930 | -1.02% | - |
| 1929 | -0.91% | - |
| 1928 | -0.87% | - |
| 1927 | -0.98% | - |
| 1926 | -0.88% | - |
| 1925 | -0.67% | - |
| 1924 | -0.3% | - |
| 1923 | -0.66% | - |
| 1922 | -1.05% | - |
| 1921 | -1.45% | - |
| 1920 | -1.57% | - |
| 1919 | -1.04% | - |
| 1918 | -0.48% | - |
| 1917 | -5.69% | - |
| 1916 | 0.25% | - |
| 1915 | -0.51% | - |
| 1914 | -0.98% | - |
| 1913 | -0.85% | - |
| 1912 | -0.58% | - |
| 1911 | -0.42% | - |
| 1910 | -0.85% | - |
| 1909 | -0.7% | - |
| 1908 | -1.25% | - |
| 1907 | -1.22% | - |
| 1906 | -0.8% | - |
| 1905 | -2% | - |
| 1904 | -0.53% | - |
| 1903 | -0.56% | - |
| 1902 | -0.56% | - |
| 1901 | -0.27% | - |
| 1900 | -1.06% | - |
| 1899 | -0.56% | - |
| 1898 | -0.49% | - |
| 1897 | -1.02% | - |
| 1896 | -1% | - |
| 1895 | -0.41% | - |
| 1894 | -0.5% | - |
| 1893 | -0.59% | - |
| 1892 | -0.56% | - |
| 1891 | -0.64% | - |
| 1890 | -0.8% | - |
| 1889 | -0.45% | - |
| 1888 | -1.94% | - |
| 1887 | -1.28% | - |
| 1886 | -0.75% | - |
| 1885 | -1.48% | - |
| 1884 | -1.22% | - |
| 1883 | -0.81% | - |
| 1882 | -0.77% | - |
| 1881 | -0.05% | - |
| 1880 | -0.69% | - |
| 1879 | -0.39% | - |
| 1878 | -0.12% | - |
| 1877 | -0.84% | - |
| 1876 | -0.8% | - |
| 1875 | -0.87% | - |
| 1874 | -0.15% | - |
| 1873 | -0.28% | - |
| 1872 | 0.31% | - |
| 1871 | 0.42% | - |
| 1870 | 0.19% | - |
| 1869 | 0.01% | - |
| 1868 | -0.38% | - |
| 1867 | -0.12% | - |
| 1866 | -0.31% | - |
| 1865 | 0.21% | - |
| 1864 | -0.11% | - |
| 1863 | -0.06% | - |
| 1862 | 0.15% | - |
| 1861 | -0.16% | - |
Data sources: International Monetary Fund (IMF) | Public Finances in Modern History (1861–1998, retrieved 2026-07-08); International Monetary Fund (IMF) | Fiscal Monitor (1990–2025, retrieved 2026-07-08).
GeoRank.org/economy/india/uruguay | CC BY
In 2025, India's government deficit, the difference between spending and revenue, was $294B, equivalent to 7.44% of GDP. This compares to Uruguay's deficit of $2.86B, or 3.36% of GDP.
Over the past 66 years, India recorded a fiscal deficit in 66 of those years, while Uruguay ran a deficit in 60 years. On average, India posted an annual deficit equal to 6.78% of GDP, compared to deficit of 2.23% of GDP for Uruguay.
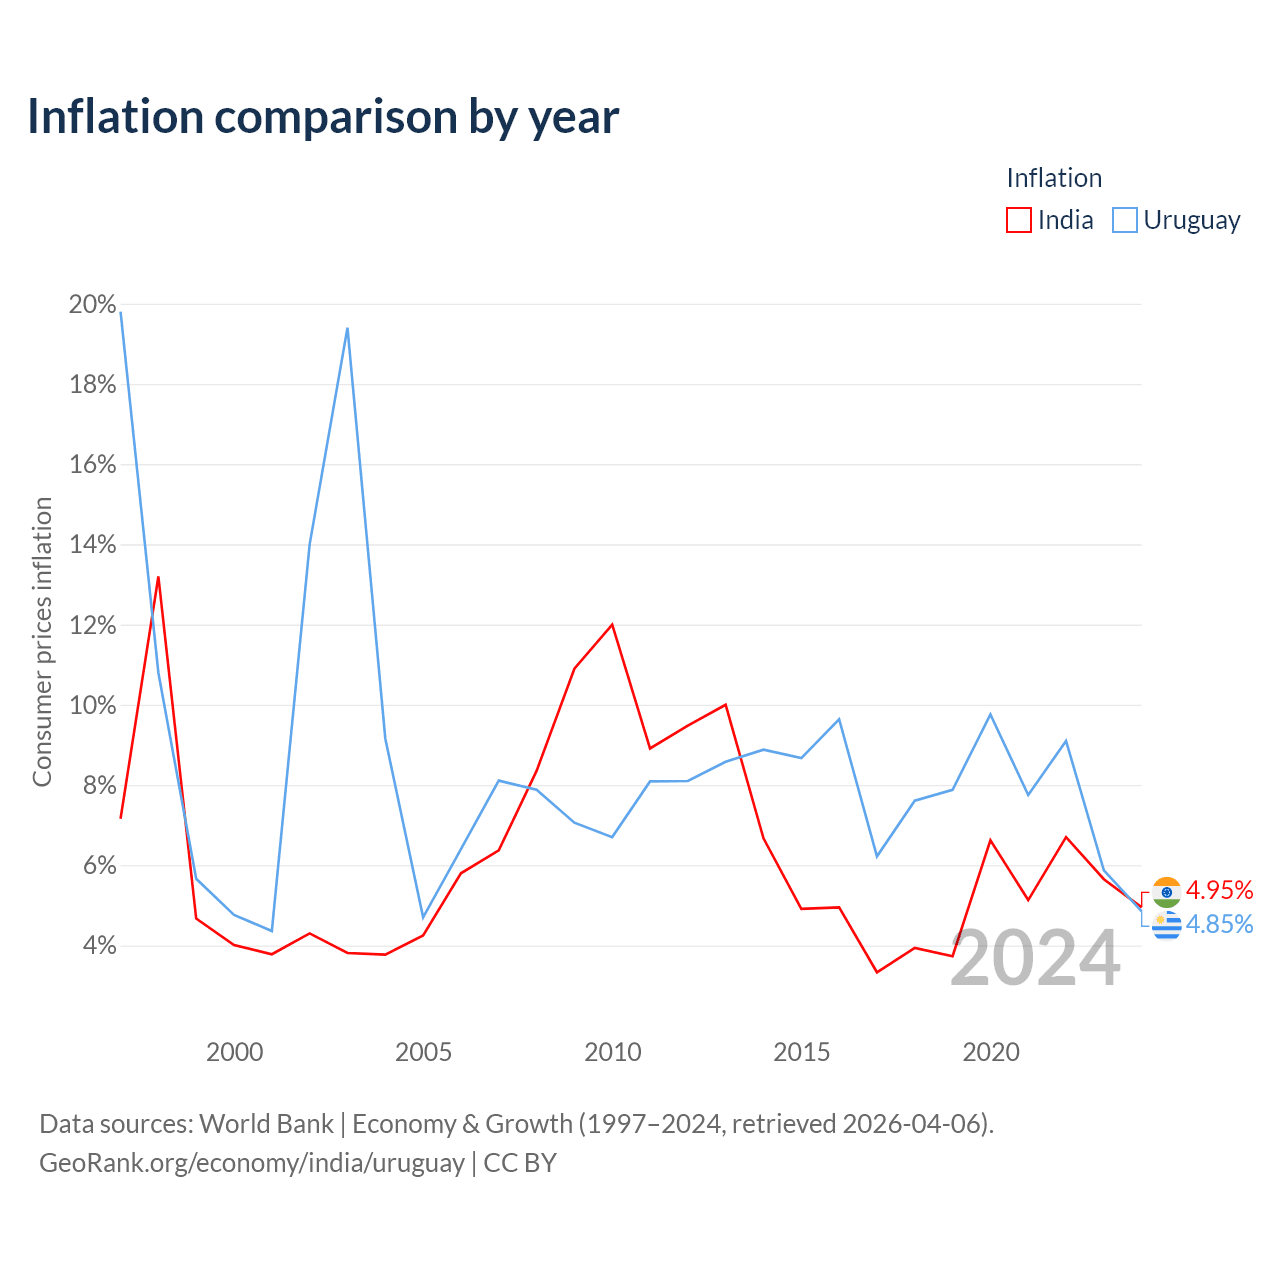
Inflation comparison by year
| Year | Consumer prices inflation | |
|---|---|---|
|
India
|
Uruguay
|
|
| 2025 | 2.4% | 4.65% |
| 2024 | 4.95% | 4.85% |
| 2023 | 5.65% | 5.87% |
| 2022 | 6.7% | 9.1% |
| 2021 | 5.13% | 7.75% |
| 2020 | 6.62% | 9.76% |
| 2019 | 3.73% | 7.88% |
| 2018 | 3.94% | 7.61% |
| 2017 | 3.33% | 6.22% |
| 2016 | 4.95% | 9.64% |
| 2015 | 4.91% | 8.67% |
| 2014 | 6.67% | 8.88% |
| 2013 | 10% | 8.58% |
| 2012 | 9.48% | 8.1% |
| 2011 | 8.91% | 8.09% |
| 2010 | 12% | 6.7% |
| 2009 | 10.9% | 7.06% |
| 2008 | 8.35% | 7.88% |
| 2007 | 6.37% | 8.11% |
| 2006 | 5.8% | 6.4% |
| 2005 | 4.25% | 4.7% |
| 2004 | 3.77% | 9.16% |
| 2003 | 3.81% | 19.4% |
| 2002 | 4.3% | 14% |
| 2001 | 3.78% | 4.36% |
| 2000 | 4.01% | 4.76% |
| 1999 | 4.67% | 5.66% |
| 1998 | 13.2% | 10.8% |
| 1997 | 7.16% | 19.8% |
Data sources: World Bank | Economy & Growth (1997–2025, retrieved 2026-07-08).
GeoRank.org/economy/india/uruguay | CC BY
Over the past 29 years, India has recorded an average annual inflation rate of 6.2%, compared with 8.43% in Uruguay. In 2025, inflation was 2.4% in India and 4.65% in Uruguay.
Top exports between countries
|
India
|
|
|---|---|
| Export category | Export value |
| Machinery & equipment | $80.9M |
| Chemicals & pharma | $68.4M |
| Textiles & consumer goods | $34.9M |
| Processed food, beverages & tobacco | $27.9M |
| Raw materials & minerals | $6.68M |
| Metals | $2.85M |
| Raw agricultural goods | $1.98M |
| Wood & paper products | $1.79M |
| Animal & marine products | $411K |
| Precious metals & jewellery | $137K |
|
Uruguay
|
|
|---|---|
| Export category | Export value |
| Wood & paper products | $61.1M |
| Textiles & consumer goods | $5.75M |
| Metals | $5.14M |
| Machinery & equipment | $4.99M |
| Raw agricultural goods | $3.2M |
| Processed food, beverages & tobacco | $2.32M |
| Animal & marine products | $1.79M |
| Chemicals & pharma | $438K |
| Precious metals & jewellery | $65K |
Balance of trade
|
India
|
Uruguay
|
|
|---|---|---|
|
Current account balance
|
-$16.5B
2025 |
-$374M
2025 |
| Current account balance ranking |
182/190
2025 |
100/190
2025 |
| Current account balance, % of GDP |
-0.42%
2025 |
-0.44%
2025 |
| Goods imports |
$761B
2025 |
$13.6B
2025 |
| Goods exports |
$450B
2025 |
$16.1B
2025 |
| Service imports |
$203B
2025 |
$5.96B
2025 |
| Service exports |
$412B
2025 |
$7.39B
2025 |
| Imports of goods and services, % of GDP |
24%
2025 |
22.6%
2025 |
| Exports of goods and services, % of GDP |
22.3%
2025 |
27.1%
2025 |
Economic freedom indices
The indices of economic freedom below are issued by the Heritage Foundation. Higher scores indicate stronger economic health.
|
India
|
Uruguay
|
|
|---|---|---|
| Economic freedom | 52.5 | 69.8 |
| Economic freedom ranking | 146/197 | 39/197 |
| Property rights | 48.3 | 87.4 |
| Government integrity | 37.8 | 79 |
| Judicial effectiveness | 52.6 | 80.9 |
| Tax burden | 71.2 | 73.3 |
| Government spending | 75.7 | 72 |
| Fiscal health | 6.7 | 76.6 |
| Business freedom | 67.4 | 83.8 |
| Labor freedom | 59 | 61.7 |
| Monetary freedom | 70.9 | 70.2 |
| Trade freedom | 61 | 73.2 |
| Investment freedom | 40 | 50 |
| Financial freedom | 40 | 30 |
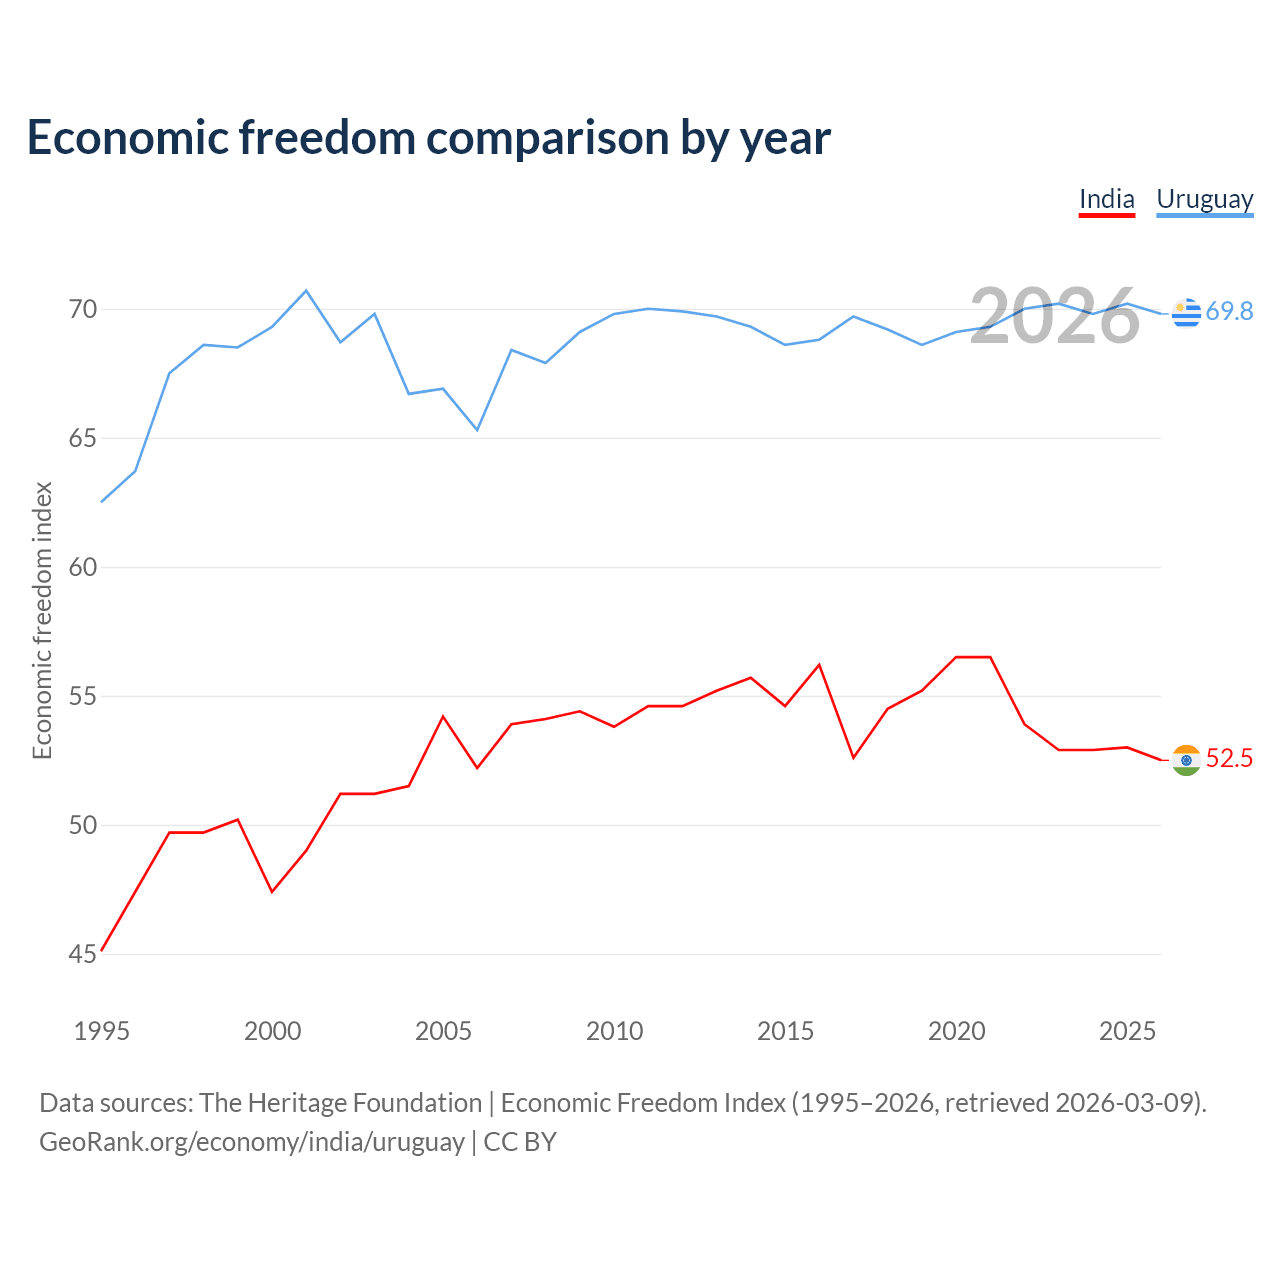
Economic freedom comparison by year
| Year | Economic freedom index | |
|---|---|---|
|
India
|
Uruguay
|
|
| 2026 | 52.5 | 69.8 |
| 2025 | 53 | 70.2 |
| 2024 | 52.9 | 69.8 |
| 2023 | 52.9 | 70.2 |
| 2022 | 53.9 | 70 |
| 2021 | 56.5 | 69.3 |
| 2020 | 56.5 | 69.1 |
| 2019 | 55.2 | 68.6 |
| 2018 | 54.5 | 69.2 |
| 2017 | 52.6 | 69.7 |
| 2016 | 56.2 | 68.8 |
| 2015 | 54.6 | 68.6 |
| 2014 | 55.7 | 69.3 |
| 2013 | 55.2 | 69.7 |
| 2012 | 54.6 | 69.9 |
| 2011 | 54.6 | 70 |
| 2010 | 53.8 | 69.8 |
| 2009 | 54.4 | 69.1 |
| 2008 | 54.1 | 67.9 |
| 2007 | 53.9 | 68.4 |
| 2006 | 52.2 | 65.3 |
| 2005 | 54.2 | 66.9 |
| 2004 | 51.5 | 66.7 |
| 2003 | 51.2 | 69.8 |
| 2002 | 51.2 | 68.7 |
| 2001 | 49 | 70.7 |
| 2000 | 47.4 | 69.3 |
| 1999 | 50.2 | 68.5 |
| 1998 | 49.7 | 68.6 |
| 1997 | 49.7 | 67.5 |
| 1996 | 47.4 | 63.7 |
| 1995 | 45.1 | 62.5 |
Data sources: The Heritage Foundation | Economic Freedom Index (1995–2026, retrieved 2026-07-08).
GeoRank.org/economy/india/uruguay | CC BY
The Economic Freedom Index for India is 52.5, ranking 146/197, compared to 69.8 for Uruguay, ranking 39/197. The chart above displays a comparison of annual changes in economic freedom indexes.
Other economic metrics
|
India
|
Uruguay
|
|
|---|---|---|
| Services, % of GDP |
49.3%
2025 |
65.2%
2025 |
| Industry, % of GDP |
25.2%
2025 |
16.9%
2025 |
| Agriculture, forestry, and fishing, % of GDP |
16.2%
2025 |
6.38%
2025 |
|
GNI, Atlas method
|
$4.04T
2025 |
$81.3B
2025 |
| GNI per capita, PPP |
$11,600
2025 |
$36,330
2025 |
| Total reserves including gold |
$700B
2025 |
$19B
2025 |
| Total reserves ranking |
5/177
2025 |
67/177
2025 |
|
Net foreign direct investment
|
-$3.41B
2025 |
-$457M
2025 |
|
Net inflows of foreign direct investment
|
$27.1B
2024 |
-$3.94B
2024 |
|
Net outflows of foreign direct investment
|
$24.2B
2024 |
-$1.37B
2024 |
|
Servicing debt to the IMF, % of GNI
|
2.47%
2024 |
n/a |
| Poverty at national poverty lines |
21.9%
2011 |
17.3%
2024 |
|
Gross capital formation, % of GDP
|
34.6%
2025 |
16.2%
2025 |
GDP per capita map

Data sources: World Bank | Economy & Growth (1985–2025, retrieved 2026-07-08); U.S. Census Bureau (1985–2025, retrieved 2026-07-08).
GeoRank.org/economy/india/uruguay | CC BY
Compare countries by 7 more topics
Help us show the world through your eyes
Share a photo of your city and help others discover what it looks like to live there. Your contribution makes our data come alive.
Data sources:
- World Bank | Economy & Growth (1960–2025, retrieved 2026-07-08)
- International Monetary Fund (IMF) | Public Finances in Modern History (1861–1998, retrieved 2026-07-08)
- International Monetary Fund (IMF) | Fiscal Monitor (1990–2025, retrieved 2026-07-08)
- The Heritage Foundation | Economic Freedom Index (1995–2026, retrieved 2026-07-08)
- U.S. Census Bureau (1985–2025, retrieved 2026-07-08)
- TradeMap (2022–2025, retrieved 2026-07-08)
- United Nations | World Population Prospects (2026, retrieved 2026-07-08)
- LivingCost (2026, retrieved 2026-07-08)
Creative Commons Attribution (CC BY) — you’re free to copy, share, remix, adapt, and use even commercially as long as you give appropriate credit and clearly indicate if you made changes. Other sources may be subject to different license terms.
The current account balance is the sum of net trade in goods and services, net earnings from cross-border investments, and net transfer payments. It reflects a country's economic transactions with the rest of the world and is a fundamental component of the balance of payments. A surplus indicates that a country exports more than it imports, while a deficit shows the opposite.
Gross National Income (GNI) measures a country's total income. It encompasses income earned by residents, businesses, and foreign sources, defined as employee compensation and investment profits. GNI adds product taxes not included elsewhere and subtracts subsidies. It accounts for income from residents working abroad but excludes earnings from foreigners within the country.
A negative value for Net Foreign Direct Investment indicates a country is a net receiver of investments, as foreign inflows exceed outflows after Balance of Payments adjustments. A positive value indicates a net provider, with outflows exceeding inflows. Inflows are credits (increasing foreign claims on domestic assets), while outflows are debits (increasing domestic assets abroad).
Foreign direct investment (FDI, net inflows) shows how much capital foreign investors bring into a country after accounting for any funds that flow back in the opposite direction. It represents the net value of overseas companies establishing, expanding, or financing businesses in the reporting country. A positive number means more capital entered the country than was withdrawn, while a negative number means foreign investors pulled out more than they invested.
Foreign direct investment (FDI, net outflows) shows how much capital residents of a country invest abroad after accounting for any funds that flow back in the opposite direction. It represents the net value of domestic companies establishing, expanding, or financing businesses in other countries. A positive number means more capital was invested abroad than withdrawn, while a negative number means residents pulled back more than they invested.
Principal and interest payments to the IMF in currency, goods, or services on long-term debt expressed as a share of GNI.
Formerly gross domestic investment, gross capital formation measures the share of a country’s economic output invested in fixed assets, including buildings, machinery, and infrastructure. It indicates how much of the economy is devoted to building productive capacity.