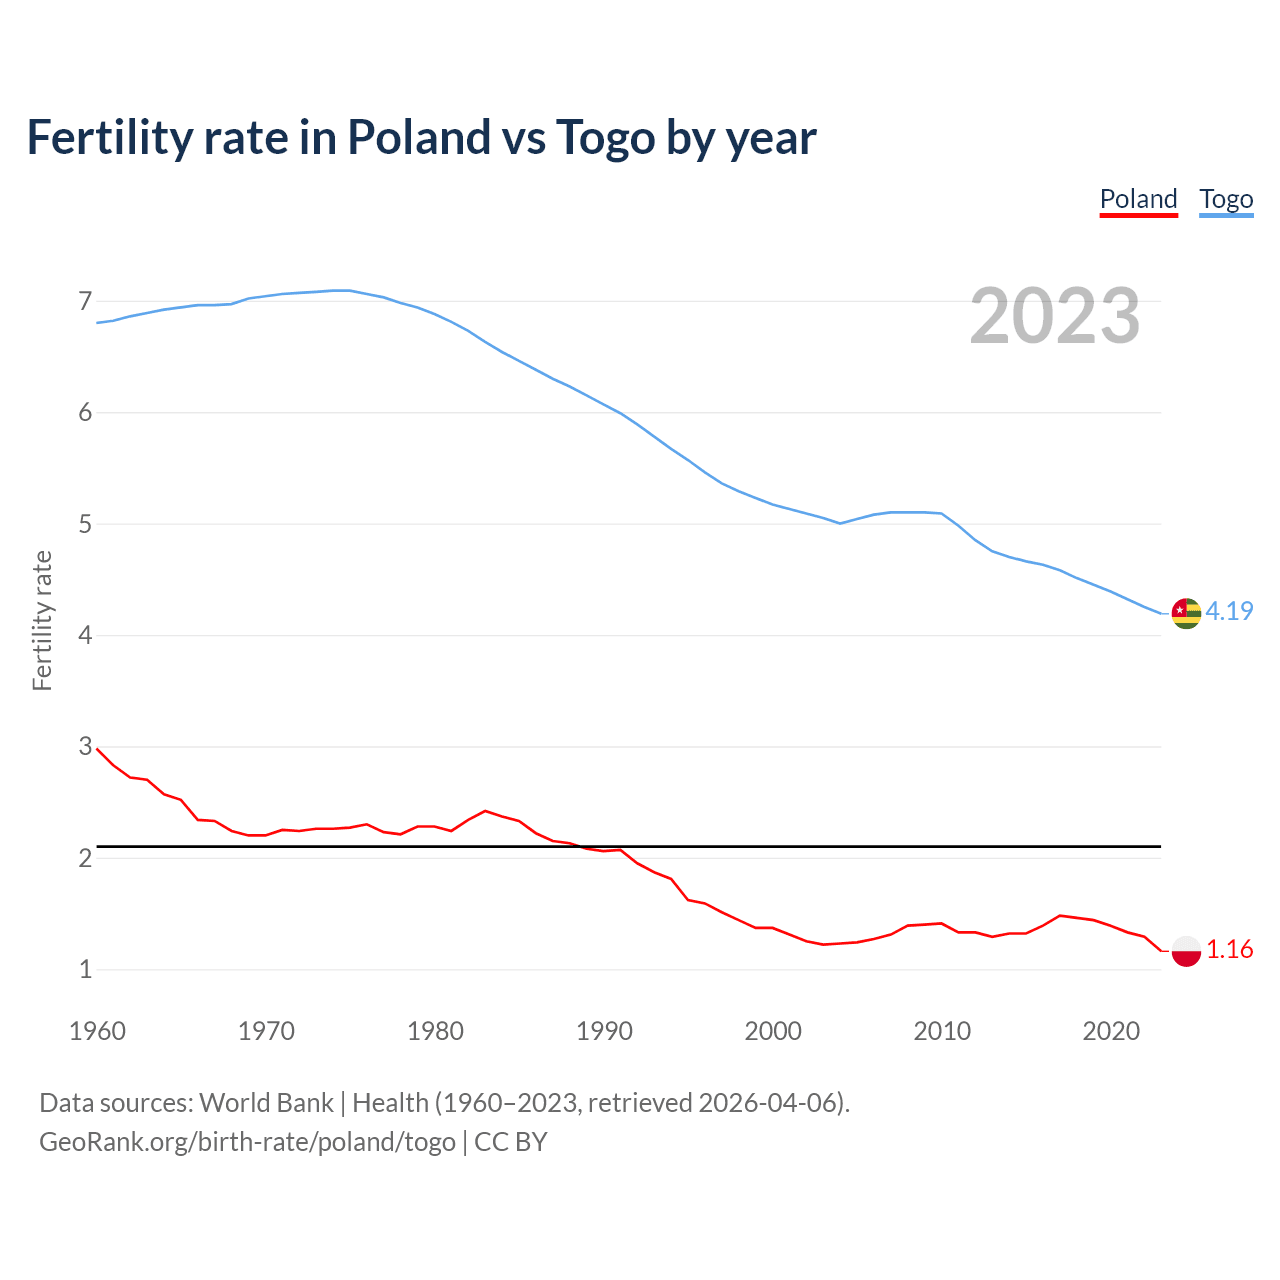
Poland has an annual birth rate of 6.9 births per 1,000 people, compared to 32.1 for Togo. The average number of children a woman is expected to have during her lifetime — the fertility rate, is 1.14 in Poland and 4.12 in Togo — 261.6% difference.
1960 vs 2024, the fertility rate has decreased by 61.7% in Poland and by 39.4% in Togo — in 1960, it was 2.98 and 6.8, respectively.
- Poland is ranked 185/196 by birth rate compared to 21/196 for Togo.
- The mean age for first-time mothers is 28.7 years in Poland, compared to 25 years in Togo.
- The mean age at childbearing (for all the births, not just the first) is 30.1 in Poland — it's 28.9 in Togo.
- Annual births per 1,000 women ages 15-19 (adolescent birth rate or teenage mother rate) is 5.85 in Poland vs 76.4 in Togo.
- In Poland, 22.7% of the population is composed of women of reproductive age (15-49), compared to 25.2% in Togo.
Fertility rate in Poland vs Togo by year
| Year | Fertility rate | |
|---|---|---|
 Poland
|
 Togo
Togo
|
|
| 2024 | 1.14 | 4.12 |
| 2023 | 1.2 | 4.19 |
| 2022 | 1.29 | 4.25 |
| 2021 | 1.33 | 4.32 |
| 2020 | 1.39 | 4.39 |
| 2019 | 1.44 | 4.45 |
| 2018 | 1.46 | 4.51 |
| 2017 | 1.48 | 4.58 |
| 2016 | 1.39 | 4.63 |
| 2015 | 1.32 | 4.66 |
| 2014 | 1.32 | 4.7 |
| 2013 | 1.29 | 4.75 |
| 2012 | 1.33 | 4.85 |
| 2011 | 1.33 | 4.98 |
| 2010 | 1.41 | 5.09 |
| 2009 | 1.4 | 5.1 |
| 2008 | 1.39 | 5.1 |
| 2007 | 1.31 | 5.1 |
| 2006 | 1.27 | 5.08 |
| 2005 | 1.24 | 5.04 |
| 2004 | 1.23 | 4.99 |
| 2003 | 1.22 | 5.05 |
| 2002 | 1.25 | 5.09 |
| 2001 | 1.31 | 5.13 |
| 2000 | 1.37 | 5.17 |
| 1999 | 1.37 | 5.23 |
| 1998 | 1.44 | 5.29 |
| 1997 | 1.51 | 5.36 |
| 1996 | 1.59 | 5.46 |
| 1995 | 1.62 | 5.56 |
| 1994 | 1.81 | 5.67 |
| 1993 | 1.87 | 5.78 |
| 1992 | 1.95 | 5.89 |
| 1991 | 2.07 | 5.99 |
| 1990 | 2.06 | 6.07 |
| 1989 | 2.08 | 6.15 |
| 1988 | 2.13 | 6.23 |
| 1987 | 2.15 | 6.3 |
| 1986 | 2.22 | 6.38 |
| 1985 | 2.33 | 6.46 |
| 1984 | 2.37 | 6.54 |
| 1983 | 2.42 | 6.63 |
| 1982 | 2.34 | 6.72 |
| 1981 | 2.24 | 6.81 |
| 1980 | 2.28 | 6.88 |
| 1979 | 2.28 | 6.94 |
| 1978 | 2.21 | 6.98 |
| 1977 | 2.23 | 7.03 |
| 1976 | 2.3 | 7.06 |
| 1975 | 2.27 | 7.09 |
| 1974 | 2.26 | 7.09 |
| 1973 | 2.26 | 7.08 |
| 1972 | 2.24 | 7.07 |
| 1971 | 2.25 | 7.06 |
| 1970 | 2.2 | 7.03 |
| 1969 | 2.2 | 7.01 |
| 1968 | 2.24 | 6.97 |
| 1967 | 2.33 | 6.96 |
| 1966 | 2.34 | 6.96 |
| 1965 | 2.52 | 6.94 |
| 1964 | 2.57 | 6.92 |
| 1963 | 2.7 | 6.89 |
| 1962 | 2.72 | 6.86 |
| 1961 | 2.83 | 6.82 |
| 1960 | 2.98 | 6.8 |
Data sources: World Bank | Health (1960–2024, retrieved 2026-07-08).
GeoRank.org/birth-rate/poland/togo | CC BY 
According to the latest available data on birth rates, the fertility rate in Poland was 1.14 children per woman in 2024, compared to 4.12 in Togo in 2024. The replacement level is considered to be 2.1 children per woman.
Check Poland vs Togo population clock for a dynamic visualization of the changing population.
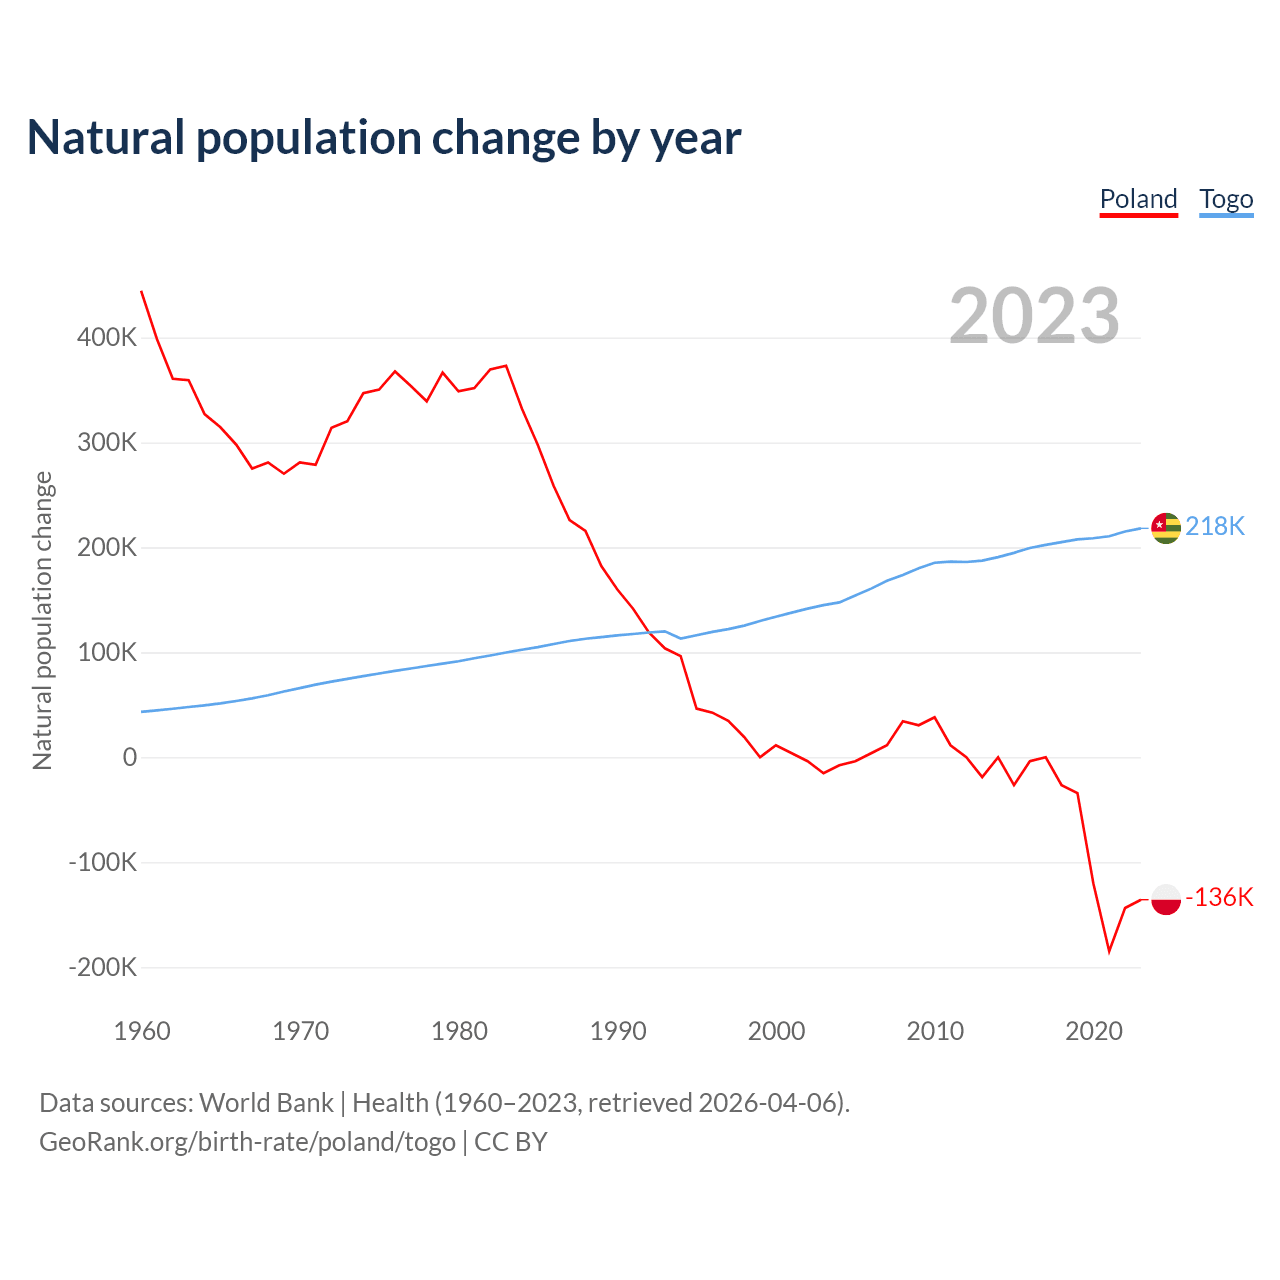
Natural population change by year
| Year | Natural population change | |
|---|---|---|
|
Poland
|
Togo
|
|
| 2024 | -157,205 | 198,184 |
| 2023 | -135,743 | 196,649 |
| 2022 | -143,605 | 195,051 |
| 2021 | -184,907 | 192,651 |
| 2020 | -120,050 | 192,474 |
| 2019 | -34,169 | 192,990 |
| 2018 | -26,582 | 191,482 |
| 2017 | 0 | 189,386 |
| 2016 | -3,797 | 187,007 |
| 2015 | -26,590 | 183,089 |
| 2014 | 0 | 179,671 |
| 2013 | -19,020 | 176,865 |
| 2012 | 0 | 176,051 |
| 2011 | 11,419 | 176,484 |
| 2010 | 38,043 | 175,800 |
| 2009 | 30,521 | 170,740 |
| 2008 | 34,313 | 164,627 |
| 2007 | 11,436 | 158,312 |
| 2006 | 3,814 | 150,821 |
| 2005 | -3,817 | 143,281 |
| 2004 | -7,637 | 136,802 |
| 2003 | -15,281 | 133,852 |
| 2002 | -3,823 | 130,283 |
| 2001 | 3,825 | 126,419 |
| 2000 | 11,478 | 122,712 |
| 1999 | 0 | 119,331 |
| 1998 | 19,332 | 116,918 |
| 1997 | 34,785 | 116,559 |
| 1996 | 42,487 | 111,887 |
| 1995 | 46,314 | 106,983 |
| 1994 | 96,357 | 100,045 |
| 1993 | 103,846 | 112,013 |
| 1992 | 118,928 | 110,828 |
| 1991 | 141,511 | 109,267 |
| 1990 | 160,066 | 107,985 |
| 1989 | 182,215 | 106,166 |
| 1988 | 215,599 | 104,605 |
| 1987 | 226,008 | 102,435 |
| 1986 | 258,448 | 99,698 |
| 1985 | 297,615 | 96,376 |
| 1984 | 332,137 | 95,195 |
| 1983 | 373,032 | 94,034 |
| 1982 | 369,551 | 92,715 |
| 1981 | 351,806 | 90,144 |
| 1980 | 348,627 | 87,404 |
| 1979 | 366,571 | 85,228 |
| 1978 | 339,166 | 83,151 |
| 1977 | 353,828 | 80,902 |
| 1976 | 367,612 | 78,770 |
| 1975 | 350,356 | 76,412 |
| 1974 | 346,893 | 74,055 |
| 1973 | 320,229 | 71,549 |
| 1972 | 314,028 | 68,966 |
| 1971 | 278,660 | 66,284 |
| 1970 | 280,913 | 63,057 |
| 1969 | 270,151 | 58,207 |
| 1968 | 280,963 | 56,082 |
| 1967 | 275,089 | 54,359 |
| 1966 | 297,801 | 52,832 |
| 1965 | 314,450 | 51,096 |
| 1964 | 326,965 | 49,450 |
| 1963 | 359,330 | 47,869 |
| 1962 | 360,671 | 46,201 |
| 1961 | 398,521 | 44,623 |
| 1960 | 444,562 | 43,307 |
Data sources: World Bank | Health (1960–2024, retrieved 2026-07-08).
GeoRank.org/birth-rate/poland/togo | CC BY
The chart above illustrates the comparison of the absolute yearly changes in population resulting from births and deaths.
Excluding migration, the natural population change due to births and deaths from 2023 to 2024 was -0.43% in Poland and +2.36% in Togo.
For the past 10 years, the annual natural population change has been -0.22% in Poland and +2.49% in Togo.
Birth rate in Poland vs Togo by year
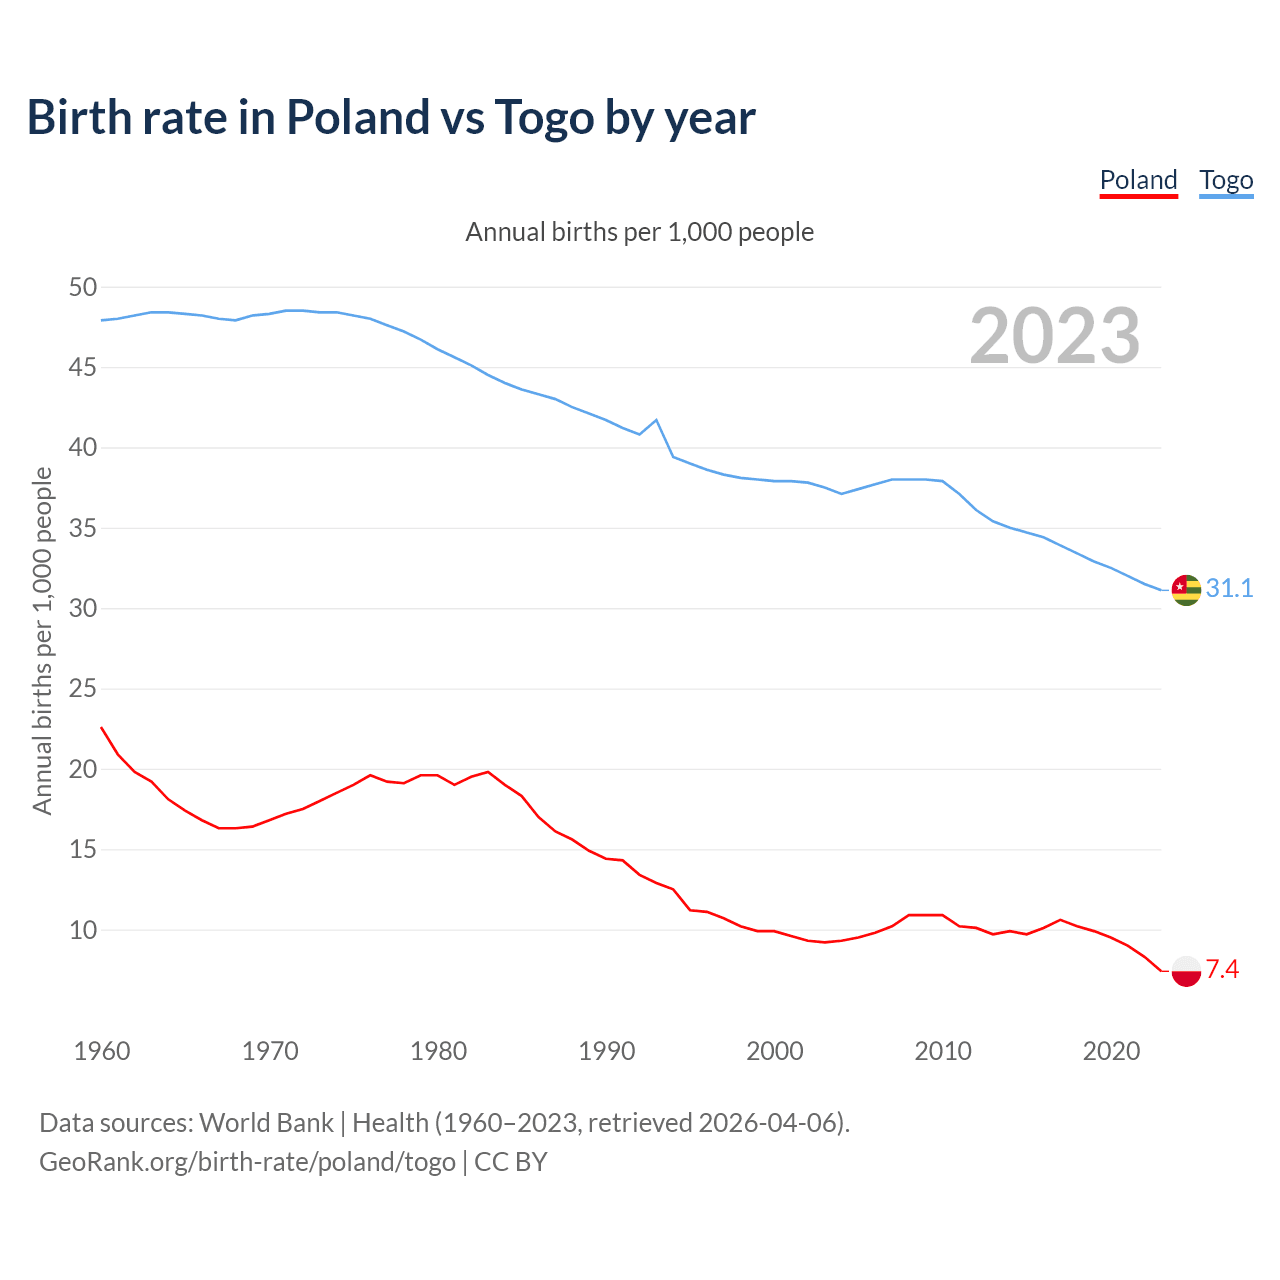
Annual births per 1,000 people
| Year | Annual births per 1,000 people | |
|---|---|---|
|
Poland
|
Togo
|
|
| 2024 | 6.9 | 32.1 |
| 2023 | 7.4 | 32.6 |
| 2022 | 8.3 | 33.1 |
| 2021 | 9 | 33.7 |
| 2020 | 9.5 | 34.3 |
| 2019 | 9.9 | 34.9 |
| 2018 | 10.2 | 35.4 |
| 2017 | 10.6 | 35.7 |
| 2016 | 10.1 | 36 |
| 2015 | 9.7 | 36.1 |
| 2014 | 9.9 | 36.3 |
| 2013 | 9.7 | 36.7 |
| 2012 | 10.1 | 37.5 |
| 2011 | 10.2 | 38.5 |
| 2010 | 10.9 | 39.3 |
| 2009 | 10.9 | 39.4 |
| 2008 | 10.9 | 39.3 |
| 2007 | 10.2 | 39.2 |
| 2006 | 9.8 | 38.7 |
| 2005 | 9.5 | 38.2 |
| 2004 | 9.3 | 37.7 |
| 2003 | 9.2 | 37.8 |
| 2002 | 9.3 | 37.9 |
| 2001 | 9.6 | 37.8 |
| 2000 | 9.9 | 37.7 |
| 1999 | 9.9 | 37.7 |
| 1998 | 10.2 | 38.1 |
| 1997 | 10.7 | 38.7 |
| 1996 | 11.1 | 38.5 |
| 1995 | 11.2 | 38.6 |
| 1994 | 12.5 | 38.2 |
| 1993 | 12.9 | 42.1 |
| 1992 | 13.4 | 40.9 |
| 1991 | 14.3 | 41.3 |
| 1990 | 14.4 | 41.7 |
| 1989 | 14.9 | 42 |
| 1988 | 15.6 | 42.4 |
| 1987 | 16.1 | 42.8 |
| 1986 | 17 | 43.1 |
| 1985 | 18.3 | 43.2 |
| 1984 | 19 | 44 |
| 1983 | 19.8 | 44.6 |
| 1982 | 19.5 | 45.3 |
| 1981 | 19 | 45.6 |
| 1980 | 19.6 | 46.1 |
| 1979 | 19.6 | 46.7 |
| 1978 | 19.1 | 47.2 |
| 1977 | 19.2 | 47.6 |
| 1976 | 19.6 | 48 |
| 1975 | 19 | 48.2 |
| 1974 | 18.5 | 48.4 |
| 1973 | 18 | 48.4 |
| 1972 | 17.5 | 48.5 |
| 1971 | 17.2 | 48.5 |
| 1970 | 16.8 | 48.3 |
| 1969 | 16.4 | 47.5 |
| 1968 | 16.3 | 48.4 |
| 1967 | 16.3 | 48.5 |
| 1966 | 16.8 | 48.6 |
| 1965 | 17.4 | 48.6 |
| 1964 | 18.1 | 48.5 |
| 1963 | 19.2 | 48.4 |
| 1962 | 19.8 | 48.2 |
| 1961 | 20.9 | 48 |
| 1960 | 22.6 | 47.9 |
Data sources: World Bank | Health (1960–2024, retrieved 2026-07-08).
GeoRank.org/birth-rate/poland/togo | CC BY
The latest reported birth rate per 1,000 people in 2024 was 6.9 in Poland and 32.1 in Togo, compared with 22.6 and 47.9, respectively, in 1960.
Birth rate data compared
|
Poland
|
Togo
|
|
|---|---|---|
| Fertility rate | 1.14 | 4.12 |
| Fertility rate rank | 187/196 | 21/196 |
| Birth rate | 6.9 | 32.1 |
| Birth rate rank | 185/196 | 21/196 |
| Population change due to births and deaths | -157,205 | +198,184 |
| Natural population change rank | 190/196 | 60/196 |
| Natural population change rate | -0.43% | +2.36% |
| Population growth | -0.34% | +2.2% |
| Population growth rank | 179/197 | 39/197 |
| Age at first childbirth | 28.7 years | 25 years |
| Average age at childbearing | 30.1 years | 28.9 years |
| Annual births per 1,000 women ages 15-19 | 5.39 | 77 |
| Annual births per 1,000 women ages 20-29 | 64.8 | 194.7 |
| Annual births per 1,000 women ages 30+ | 11.4 | 61.1 |
| Female of reproductive age (15-49), share of population | 22.7% | 25.2% |
| Any modern method of contraceptive prevalence among married women ages 15-49 | 50.7% | 21.4% |
| Share of births attended by skilled health staff | 99.6% | 69.4% |
| Maternal mortality per live birth | 0.002% | 0.35% |
| Neonatal mortality rate (before reaching 28 days of age) | 0.25% | 2.26% |
| Infant mortality rate (before reaching 1 year of age) | 0.36% | 3.48% |
| Mortality rate before reaching 5 years of age | 0.42% | 5.61% |
| Life expectancy | 79.2 years | 63.3 years |
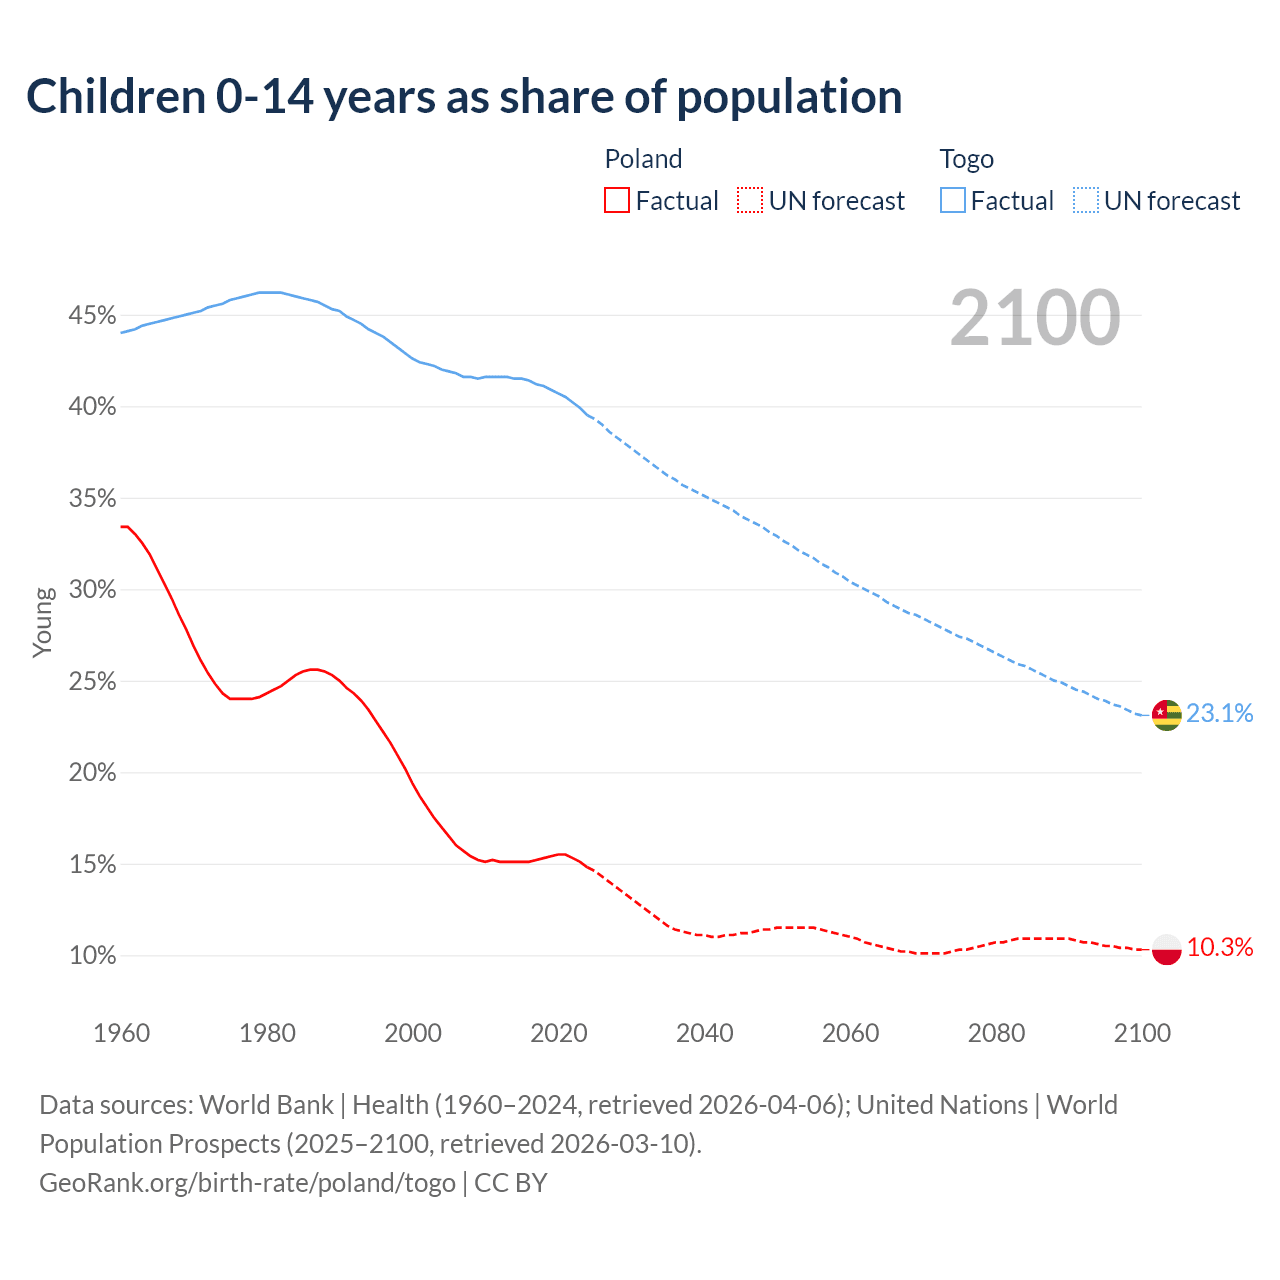
Children 0-14 years as share of population
| Year | Young | |
|---|---|---|
|
Poland
|
Togo
|
|
| 2100 | 10.3% | 23.1% |
| 2099 | 10.3% | 23.2% |
| 2098 | 10.4% | 23.4% |
| 2097 | 10.4% | 23.6% |
| 2096 | 10.5% | 23.7% |
| 2095 | 10.5% | 23.9% |
| 2094 | 10.6% | 24% |
| 2093 | 10.7% | 24.2% |
| 2092 | 10.7% | 24.4% |
| 2091 | 10.8% | 24.5% |
| 2090 | 10.9% | 24.7% |
| 2089 | 10.9% | 24.9% |
| 2088 | 10.9% | 25% |
| 2087 | 10.9% | 25.2% |
| 2086 | 10.9% | 25.4% |
| 2085 | 10.9% | 25.6% |
| 2084 | 10.9% | 25.8% |
| 2083 | 10.9% | 25.9% |
| 2082 | 10.8% | 26.1% |
| 2081 | 10.7% | 26.3% |
| 2080 | 10.7% | 26.5% |
| 2079 | 10.6% | 26.7% |
| 2078 | 10.5% | 26.9% |
| 2077 | 10.4% | 27.1% |
| 2076 | 10.3% | 27.3% |
| 2075 | 10.3% | 27.4% |
| 2074 | 10.2% | 27.6% |
| 2073 | 10.1% | 27.8% |
| 2072 | 10.1% | 28% |
| 2071 | 10.1% | 28.2% |
| 2070 | 10.1% | 28.4% |
| 2069 | 10.1% | 28.6% |
| 2068 | 10.2% | 28.7% |
| 2067 | 10.2% | 28.9% |
| 2066 | 10.3% | 29.1% |
| 2065 | 10.4% | 29.3% |
| 2064 | 10.5% | 29.6% |
| 2063 | 10.6% | 29.8% |
| 2062 | 10.7% | 30% |
| 2061 | 10.9% | 30.2% |
| 2060 | 11% | 30.4% |
| 2059 | 11.1% | 30.7% |
| 2058 | 11.2% | 30.9% |
| 2057 | 11.3% | 31.2% |
| 2056 | 11.4% | 31.4% |
| 2055 | 11.5% | 31.7% |
| 2054 | 11.5% | 31.9% |
| 2053 | 11.5% | 32.1% |
| 2052 | 11.5% | 32.4% |
| 2051 | 11.5% | 32.6% |
| 2050 | 11.5% | 32.9% |
| 2049 | 11.4% | 33.1% |
| 2048 | 11.4% | 33.4% |
| 2047 | 11.3% | 33.6% |
| 2046 | 11.2% | 33.8% |
| 2045 | 11.2% | 34% |
| 2044 | 11.1% | 34.3% |
| 2043 | 11.1% | 34.5% |
| 2042 | 11% | 34.7% |
| 2041 | 11% | 34.9% |
| 2040 | 11.1% | 35.1% |
| 2039 | 11.1% | 35.3% |
| 2038 | 11.2% | 35.5% |
| 2037 | 11.3% | 35.7% |
| 2036 | 11.4% | 36% |
| 2035 | 11.6% | 36.2% |
| 2034 | 11.9% | 36.5% |
| 2033 | 12.2% | 36.8% |
| 2032 | 12.5% | 37.1% |
| 2031 | 12.8% | 37.4% |
| 2030 | 13.1% | 37.7% |
| 2029 | 13.4% | 38% |
| 2028 | 13.7% | 38.3% |
| 2027 | 14% | 38.6% |
| 2026 | 14.3% | 39% |
| 2025 | 14.5% | 40.4% |
| 2024 | 14.8% | 40.8% |
| 2023 | 15.1% | 41.1% |
| 2022 | 15.3% | 41.3% |
| 2021 | 15.5% | 41.2% |
| 2020 | 15.5% | 40.7% |
| 2019 | 15.4% | 40.1% |
| 2018 | 15.3% | 39.9% |
| 2017 | 15.2% | 40.4% |
| 2016 | 15.1% | 41.3% |
| 2015 | 15.1% | 42.1% |
| 2014 | 15.1% | 42.8% |
| 2013 | 15.1% | 43.3% |
| 2012 | 15.1% | 43.6% |
| 2011 | 15.2% | 43.8% |
| 2010 | 15.1% | 43.6% |
| 2009 | 15.2% | 43.1% |
| 2008 | 15.4% | 42.5% |
| 2007 | 15.7% | 42% |
| 2006 | 16% | 41.6% |
| 2005 | 16.5% | 41.5% |
| 2004 | 17% | 41.8% |
| 2003 | 17.5% | 42.2% |
| 2002 | 18.1% | 42.7% |
| 2001 | 18.7% | 43.1% |
| 2000 | 19.4% | 43.6% |
| 1999 | 20.2% | 44.1% |
| 1998 | 20.9% | 44.3% |
| 1997 | 21.6% | 43.9% |
| 1996 | 22.2% | 44.1% |
| 1995 | 22.8% | 45.1% |
| 1994 | 23.4% | 46.6% |
| 1993 | 23.9% | 46.1% |
| 1992 | 24.3% | 44.9% |
| 1991 | 24.6% | 45.2% |
| 1990 | 25% | 45.4% |
| 1989 | 25.3% | 45.7% |
| 1988 | 25.5% | 45.9% |
| 1987 | 25.6% | 46.1% |
| 1986 | 25.6% | 46.4% |
| 1985 | 25.5% | 46.6% |
| 1984 | 25.3% | 46.7% |
| 1983 | 25% | 46.5% |
| 1982 | 24.7% | 46.3% |
| 1981 | 24.5% | 46.2% |
| 1980 | 24.3% | 46.2% |
| 1979 | 24.1% | 46.2% |
| 1978 | 24% | 46.1% |
| 1977 | 24% | 46% |
| 1976 | 24% | 45.9% |
| 1975 | 24% | 45.8% |
| 1974 | 24.3% | 45.7% |
| 1973 | 24.8% | 45.5% |
| 1972 | 25.4% | 45.4% |
| 1971 | 26.1% | 45.2% |
| 1970 | 26.9% | 45.1% |
| 1969 | 27.8% | 45% |
| 1968 | 28.6% | 44.9% |
| 1967 | 29.5% | 44.8% |
| 1966 | 30.3% | 44.7% |
| 1965 | 31.1% | 44.6% |
| 1964 | 31.9% | 44.5% |
| 1963 | 32.5% | 44.4% |
| 1962 | 33% | 44.2% |
| 1961 | 33.4% | 44.1% |
| 1960 | 33.4% | 44% |
Data sources: World Bank | Health (1960–2025, retrieved 2026-07-08); United Nations | World Population Prospects (2026–2100, retrieved 2026-07-08).
GeoRank.org/birth-rate/poland/togo | CC BY
Children aged 0-14 make up 14.5% of the population in Poland and 40.4% in Togo in 2025, compared to 25% and 45.4% respectively in 1990.
Fertility rates around the globe

Data sources: World Bank | Health (1960–2024, retrieved 2026-07-08).
GeoRank.org/birth-rate/poland/togo | CC BY
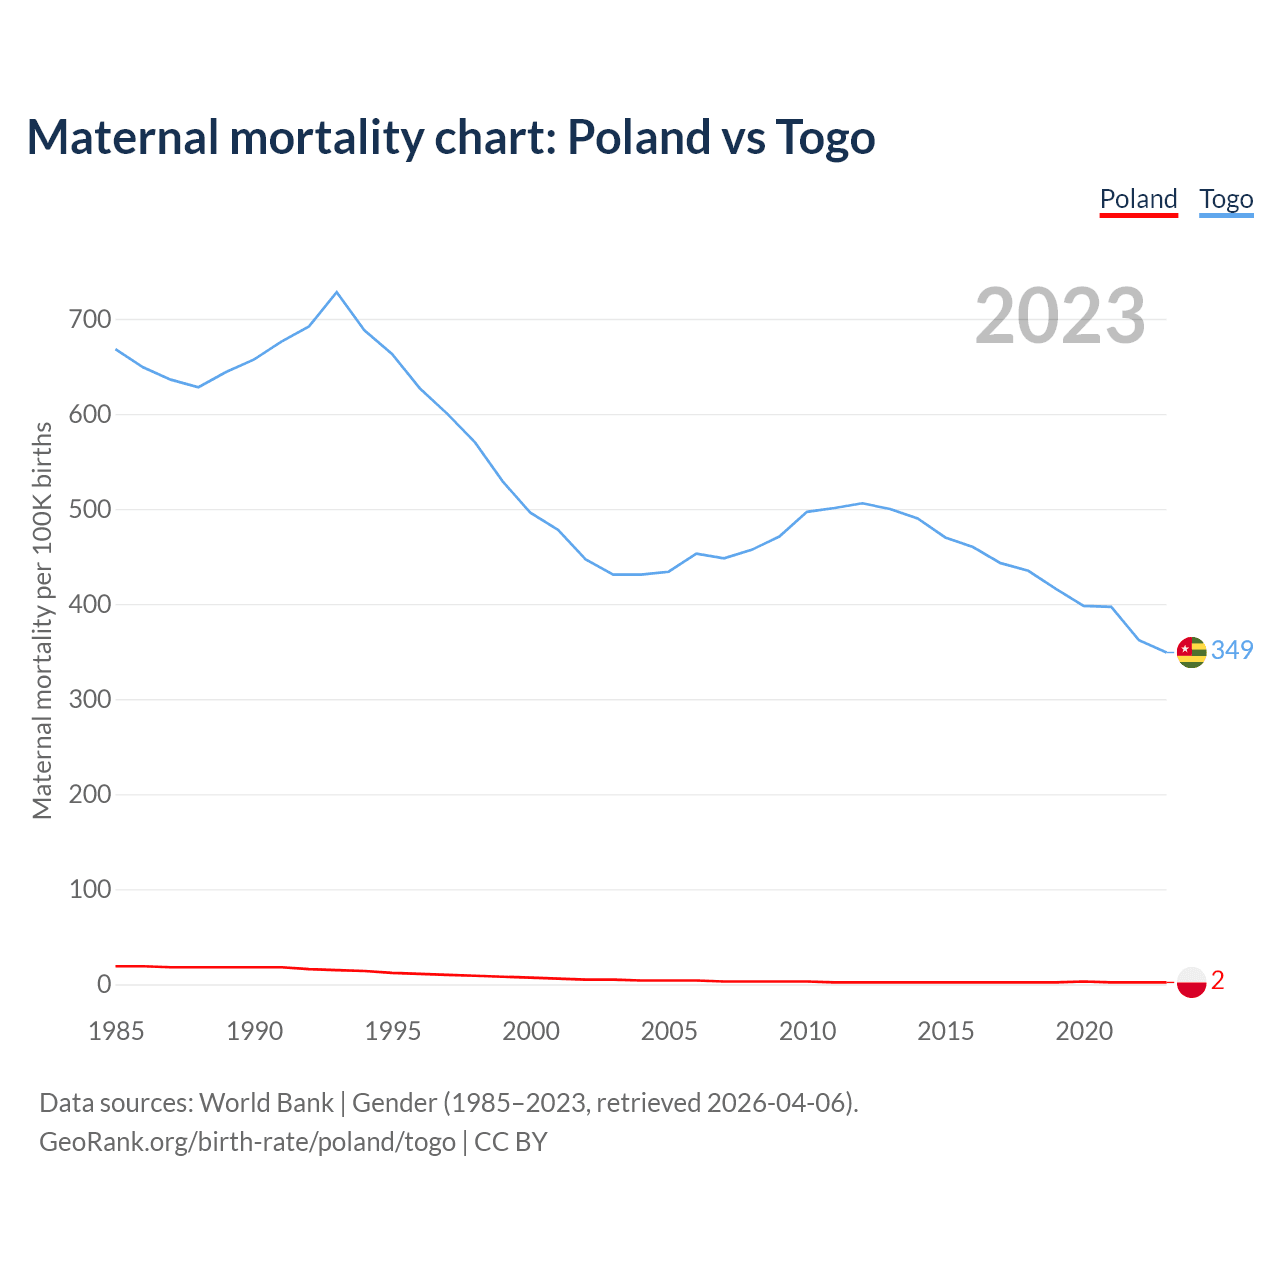
Maternal mortality chart: Poland vs Togo
| Year | Maternal mortality per 100K births | |
|---|---|---|
|
Poland
|
Togo
|
|
| 2023 | 2 | 349 |
| 2022 | 2 | 362 |
| 2021 | 2 | 397 |
| 2020 | 3 | 398 |
| 2019 | 2 | 416 |
| 2018 | 2 | 435 |
| 2017 | 2 | 443 |
| 2016 | 2 | 460 |
| 2015 | 2 | 470 |
| 2014 | 2 | 490 |
| 2013 | 2 | 500 |
| 2012 | 2 | 506 |
| 2011 | 2 | 501 |
| 2010 | 3 | 497 |
| 2009 | 3 | 471 |
| 2008 | 3 | 457 |
| 2007 | 3 | 448 |
| 2006 | 4 | 453 |
| 2005 | 4 | 434 |
| 2004 | 4 | 431 |
| 2003 | 5 | 431 |
| 2002 | 5 | 447 |
| 2001 | 6 | 478 |
| 2000 | 7 | 496 |
| 1999 | 8 | 529 |
| 1998 | 9 | 570 |
| 1997 | 10 | 600 |
| 1996 | 11 | 627 |
| 1995 | 12 | 663 |
| 1994 | 14 | 688 |
| 1993 | 15 | 728 |
| 1992 | 16 | 692 |
| 1991 | 18 | 676 |
| 1990 | 18 | 657 |
| 1989 | 18 | 644 |
| 1988 | 18 | 628 |
| 1987 | 18 | 636 |
| 1986 | 19 | 649 |
| 1985 | 19 | 668 |
Data sources: World Bank | Gender (1985–2023, retrieved 2026-07-08).
GeoRank.org/birth-rate/poland/togo | CC BY
The maternal mortality rate, which is the probability of dying during childbirth or within 42 days of pregnancy termination, is 2 deaths per 100,000 live births in Poland, compared to 349 deaths in Togo.
Under-five mortality rates
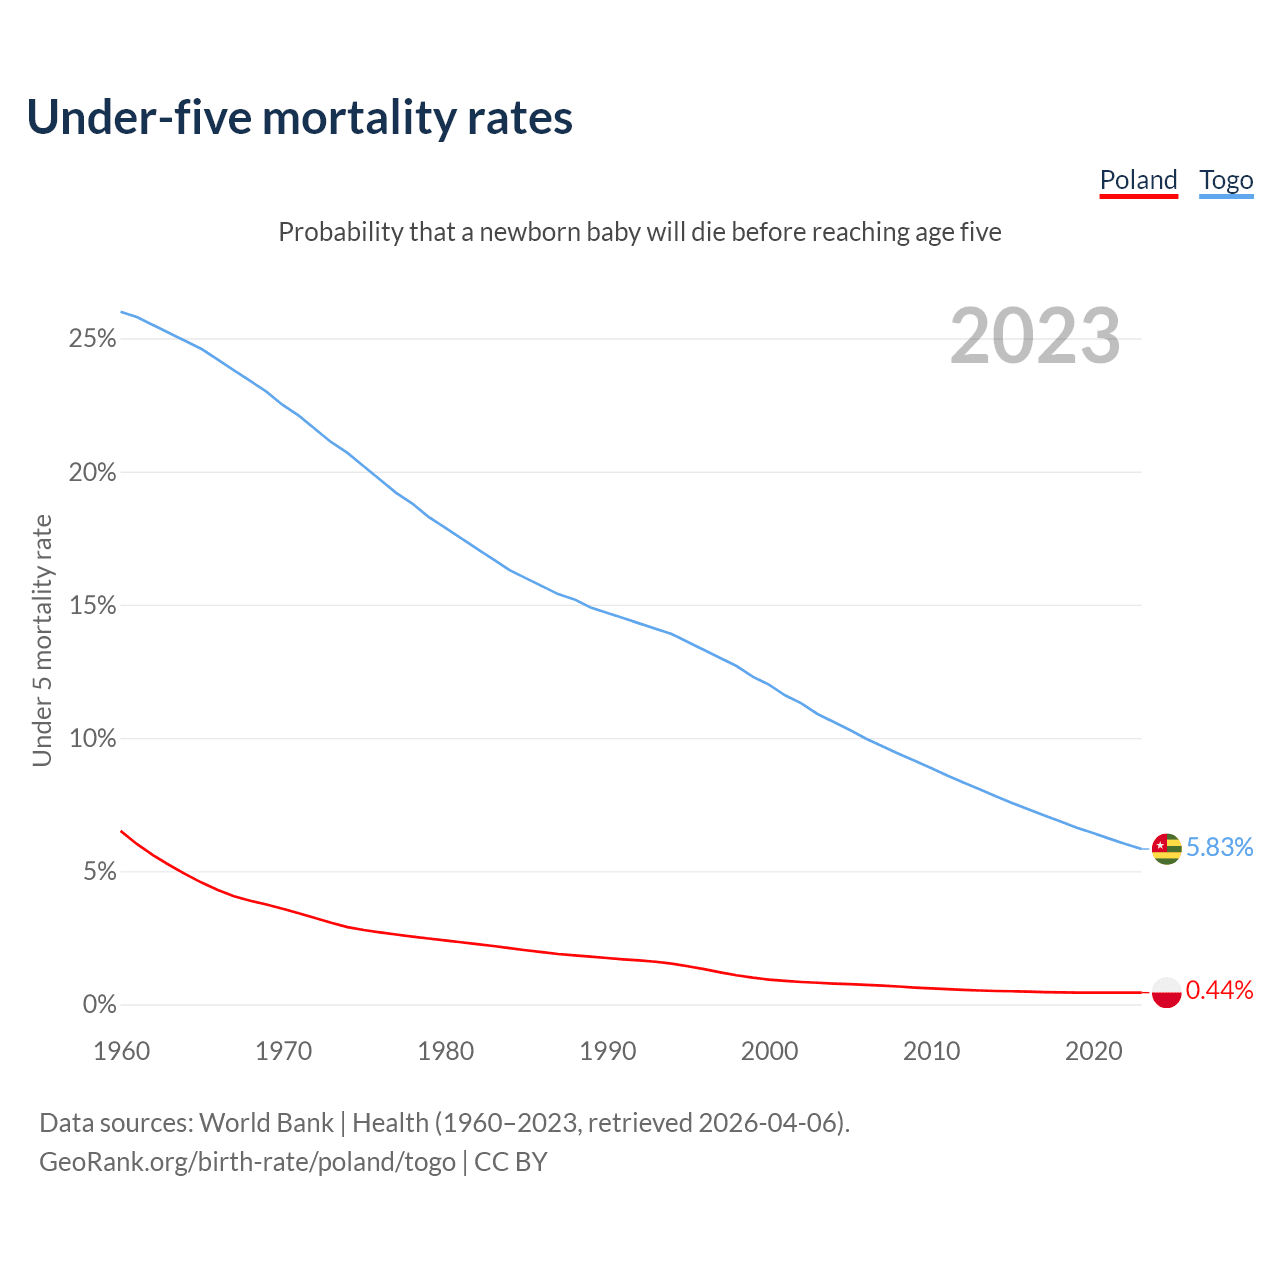
Probability that a newborn baby will die before reaching age five
| Year | Under 5 mortality rate | |
|---|---|---|
|
Poland
|
Togo
|
|
| 2024 | 0.42% | 5.61% |
| 2023 | 0.43% | 5.81% |
| 2022 | 0.43% | 6% |
| 2021 | 0.44% | 6.2% |
| 2020 | 0.44% | 6.39% |
| 2019 | 0.45% | 6.6% |
| 2018 | 0.45% | 6.81% |
| 2017 | 0.46% | 7.04% |
| 2016 | 0.48% | 7.28% |
| 2015 | 0.49% | 7.52% |
| 2014 | 0.5% | 7.77% |
| 2013 | 0.52% | 8.02% |
| 2012 | 0.54% | 8.29% |
| 2011 | 0.57% | 8.56% |
| 2010 | 0.6% | 8.83% |
| 2009 | 0.63% | 9.09% |
| 2008 | 0.67% | 9.37% |
| 2007 | 0.7% | 9.65% |
| 2006 | 0.73% | 9.93% |
| 2005 | 0.76% | 10.2% |
| 2004 | 0.78% | 10.6% |
| 2003 | 0.81% | 10.9% |
| 2002 | 0.84% | 11.2% |
| 2001 | 0.88% | 11.6% |
| 2000 | 0.93% | 11.9% |
| 1999 | 1% | 12.3% |
| 1998 | 1.09% | 12.6% |
| 1997 | 1.2% | 13% |
| 1996 | 1.32% | 13.3% |
| 1995 | 1.44% | 13.6% |
| 1994 | 1.53% | 13.9% |
| 1993 | 1.59% | 14.1% |
| 1992 | 1.65% | 14.3% |
| 1991 | 1.69% | 14.5% |
| 1990 | 1.74% | 14.7% |
| 1989 | 1.79% | 15% |
| 1988 | 1.83% | 15.2% |
| 1987 | 1.89% | 15.4% |
| 1986 | 1.96% | 15.7% |
| 1985 | 2.03% | 16% |
| 1984 | 2.11% | 16.4% |
| 1983 | 2.19% | 16.7% |
| 1982 | 2.26% | 17.1% |
| 1981 | 2.33% | 17.5% |
| 1980 | 2.4% | 17.9% |
| 1979 | 2.47% | 18.4% |
| 1978 | 2.55% | 18.8% |
| 1977 | 2.62% | 19.3% |
| 1976 | 2.7% | 19.7% |
| 1975 | 2.79% | 20.2% |
| 1974 | 2.91% | 20.7% |
| 1973 | 3.05% | 21.1% |
| 1972 | 3.23% | 21.6% |
| 1971 | 3.43% | 22.1% |
| 1970 | 3.61% | 22.5% |
| 1969 | 3.75% | 22.9% |
| 1968 | 3.88% | 23.4% |
| 1967 | 4.06% | 23.8% |
| 1966 | 4.29% | 24.1% |
| 1965 | 4.57% | 24.5% |
| 1964 | 4.89% | 24.8% |
| 1963 | 5.24% | 25.1% |
| 1962 | 5.61% | 25.4% |
| 1961 | 6.01% | 25.7% |
| 1960 | 6.49% | 26% |
Data sources: World Bank | Health (1960–2024, retrieved 2026-07-08).
GeoRank.org/birth-rate/poland/togo | CC BY
The chance that a newborn baby will die before reaching age five is 0.42% in Poland and 5.61% in Togo. Above is a chart with historical data on under-five mortality rates.
Compare countries by 7 more topics
Help us show the world through your eyes
Share a photo of your city and help others discover what it looks like to live there. Your contribution makes our data come alive.
Data sources:
- World Bank | Health (1960–2025, retrieved 2026-07-08)
- United Nations | World Population Prospects (2026–2100, retrieved 2026-07-08)
- United Nations Economic Commission for Europe (UNECE) (2024, retrieved 2026-07-08)
- Central Intelligence Agency (CIA) (2025, retrieved 2026-07-08)
Creative Commons Attribution (CC BY) — you’re free to copy, share, remix, adapt, and use even commercially as long as you give appropriate credit and clearly indicate if you made changes. Other sources may be subject to different license terms.