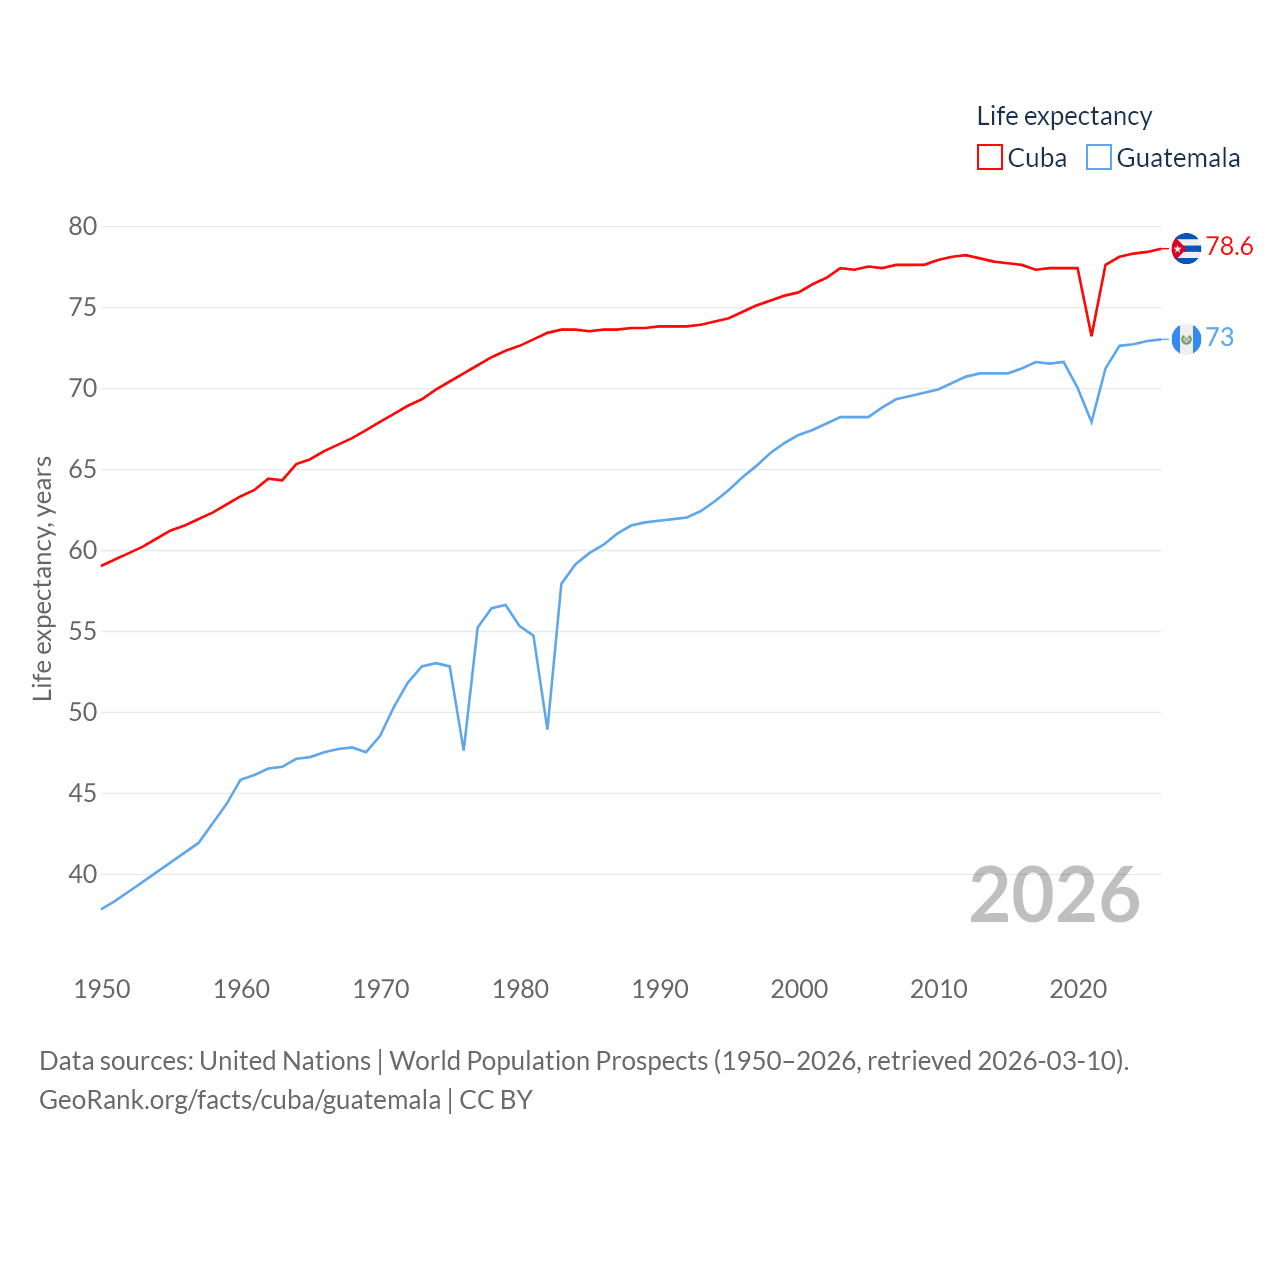
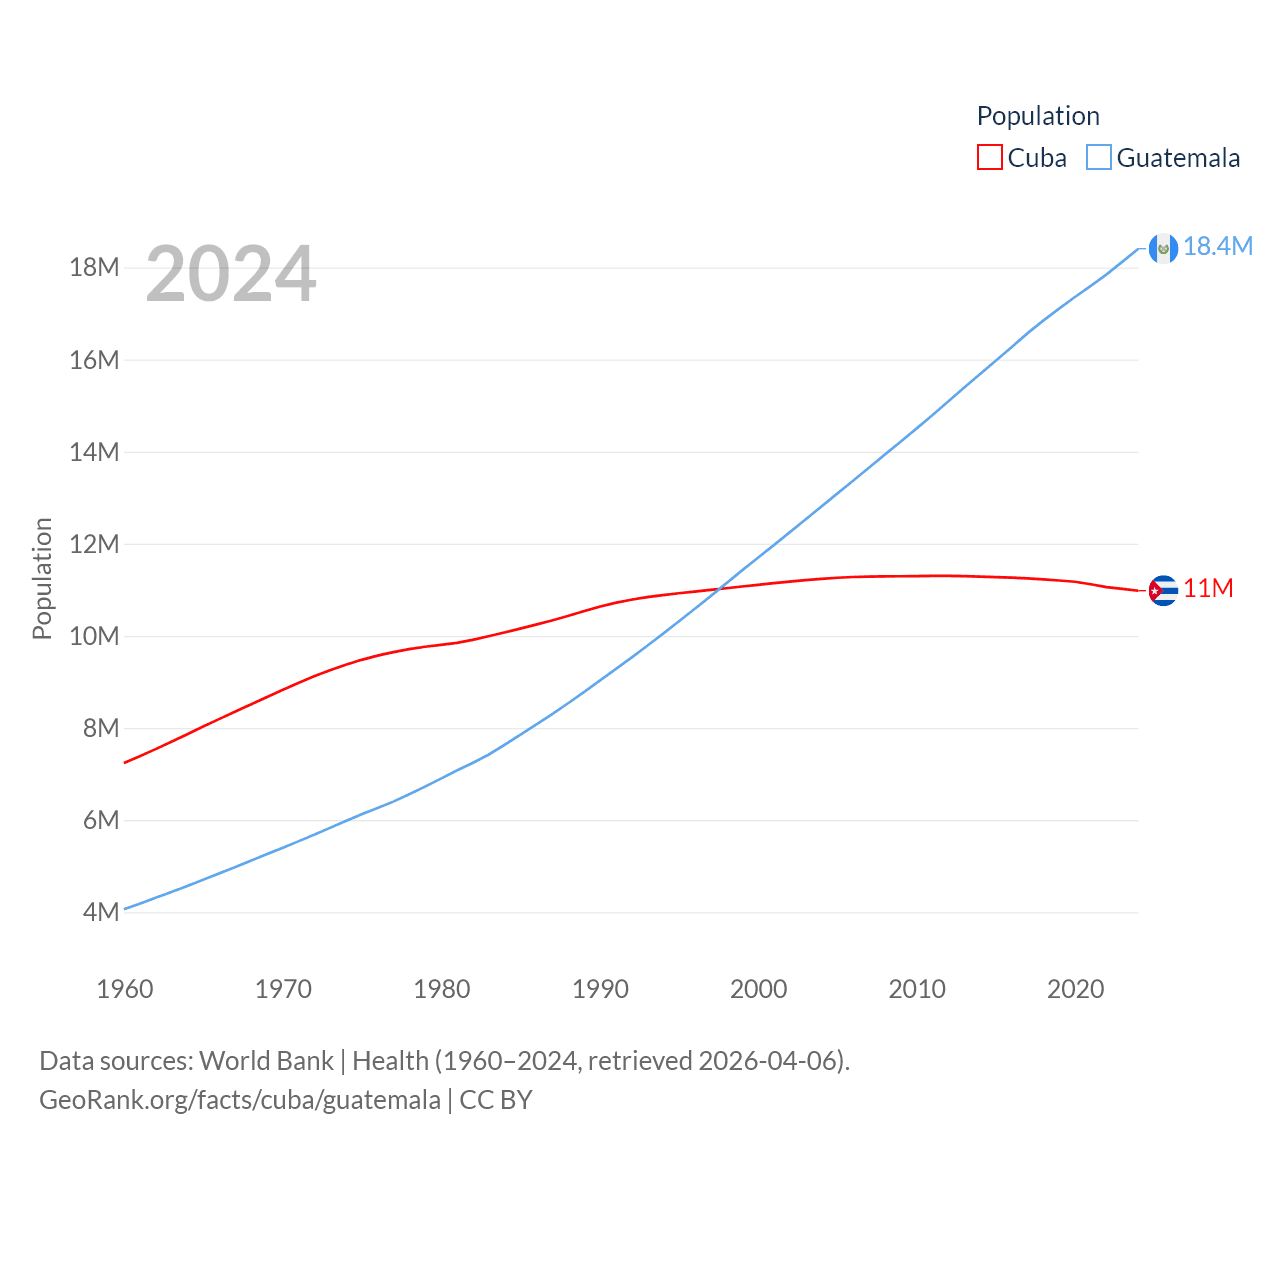
Cuba has a population of 10.9M (ranked 88/197), compared with 18.7M in Guatemala (ranked 70/197). Cuba's land area is 40,077 sq mi versus 41,375 sq mi for Guatemala (ranked 103rd vs. 102nd).
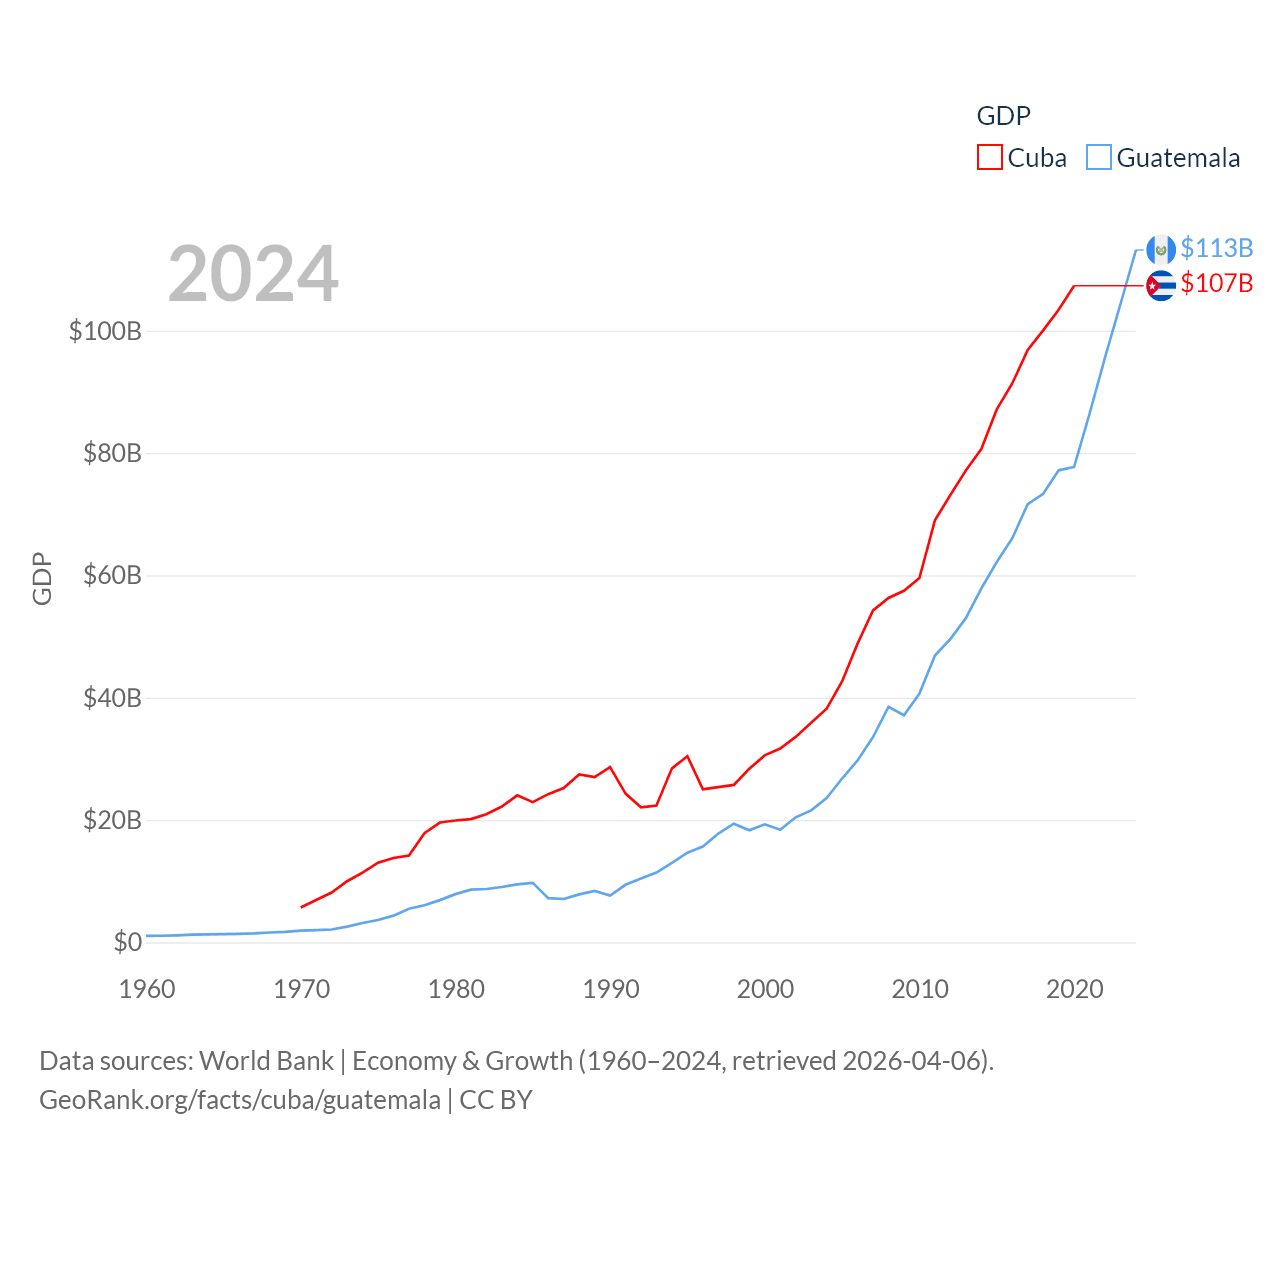
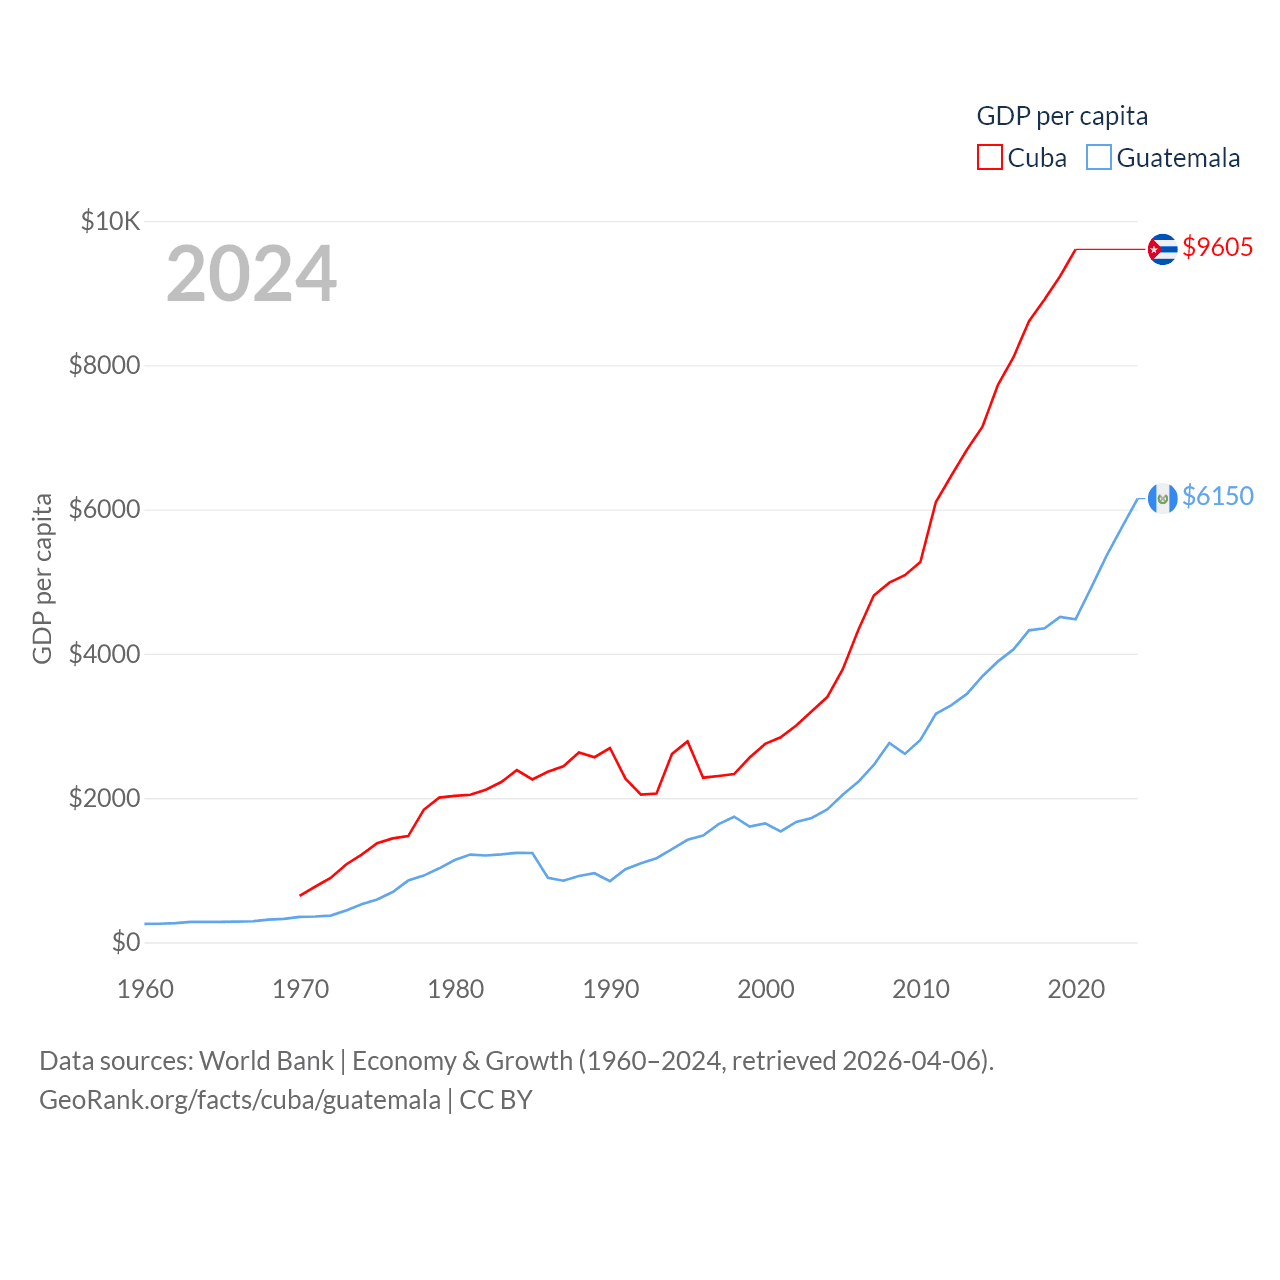
By GDP, Cuba ranks 72/197 ($107B) and Guatemala ranks 67/197 ($123B). By GDP per capita, Cuba ranks 91/197 ($9,605), while Guatemala ranks 108/197 ($6,598).
Main facts and rankings
 Cuba
Cuba
|
 Guatemala
|
|
|---|---|---|
| Population |
10893750
|
19115361
|
| Population rank | 90/197 | 69/197 |
| GDP |
$107B
2020 |
$123B
2025 |
| GDP rank | 72/197 | 67/197 |
| GDP per capita |
$9,605
2020 |
$6,598
2025 |
| GDP per capita rank | 91/197 | 108/197 |
| GDP per capita, PPP |
$12,300
2016 |
$14,369
2024 |
| Government debt | n/a |
$33.5B
2025 |
| Debt-to-GDP ratio | n/a |
27.2%
2025 |
| Government debt per person | n/a |
$1,793
2025 |
| Government debt per person rank | n/a | 122/185 |
| Average annual personal income after taxes |
$6,472
2026 |
$4,432
2026 |
| Land area | 40,077 sq mi | 41,375 sq mi |
| Population density |
271.8 ppl/mi²
2026 |
459 ppl/mi²
2026 |
| Fertility rate |
1.45
2024 |
2.29
2024 |
| Median age |
43.4 years
2025 |
24.4 years
2025 |
| Life expectancy |
78.6 years
2026 |
73 years
2026 |
Cuba and Guatemala: Comparison Charts
Cuba and Guatemala economies compared
| Year | GDP | |
|---|---|---|
|
Cuba
|
Guatemala
|
|
| 2025 | - | $123,306,008,821 |
| 2024 | - | $113,215,575,151 |
| 2023 | - | $104,298,081,429 |
| 2022 | - | $95,609,727,056 |
| 2021 | - | $86,455,522,273 |
| 2020 | $107,352,000,000 | $77,719,468,248 |
| 2019 | $103,427,600,000 | $77,172,331,693 |
| 2018 | $100,050,036,100 | $73,328,356,008 |
| 2017 | $96,850,649,700 | $71,653,780,740 |
| 2016 | $91,370,407,900 | $66,053,408,206 |
| 2015 | $87,132,800,000 | $62,186,066,548 |
| 2014 | $80,656,100,000 | $57,852,159,008 |
| 2013 | $77,148,000,000 | $52,996,420,177 |
| 2012 | $73,141,000,000 | $49,593,929,487 |
| 2011 | $68,990,000,000 | $46,876,006,272 |
| 2010 | $59,562,962,963 | $40,676,578,423 |
| 2009 | $57,481,481,481 | $37,126,148,265 |
| 2008 | $56,302,129,630 | $38,503,720,224 |
| 2007 | $54,262,870,370 | $33,567,850,824 |
| 2006 | $48,835,925,926 | $29,744,246,827 |
| 2005 | $42,643,836,100 | $26,783,389,294 |
| 2004 | $38,203,000,000 | $23,577,298,095 |
| 2003 | $35,901,200,000 | $21,576,351,799 |
| 2002 | $33,590,500,000 | $20,444,205,991 |
| 2001 | $31,682,400,000 | $18,405,220,247 |
| 2000 | $30,565,400,000 | $19,288,929,030 |
| 1999 | $28,364,615,200 | $18,318,412,251 |
| 1998 | $25,736,331,200 | $19,395,491,993 |
| 1997 | $25,365,908,100 | $17,790,026,222 |
| 1996 | $25,017,368,700 | $15,674,835,615 |
| 1995 | $30,429,803,651 | $14,655,404,433 |
| 1994 | $28,448,326,757 | $12,983,233,311 |
| 1993 | $22,367,254,865 | $11,400,017,301 |
| 1992 | $22,085,858,243 | $10,440,781,588 |
| 1991 | $24,316,556,026 | $9,406,135,143 |
| 1990 | $28,645,436,569 | $7,650,196,845 |
| 1989 | $27,023,468,666 | $8,410,724,361 |
| 1988 | $27,458,999,472 | $7,841,602,824 |
| 1987 | $25,213,935,012 | $7,084,399,840 |
| 1986 | $24,226,574,634 | $7,231,963,516 |
| 1985 | $22,920,490,774 | $9,721,652,087 |
| 1984 | $24,039,383,608 | $9,470,000,100 |
| 1983 | $22,204,940,512 | $9,050,000,400 |
| 1982 | $20,953,510,235 | $8,716,999,700 |
| 1981 | $20,150,254,096 | $8,607,500,300 |
| 1980 | $19,912,889,861 | $7,878,700,000 |
| 1979 | $19,584,443,288 | $6,902,600,200 |
| 1978 | $17,844,705,325 | $6,070,600,200 |
| 1977 | $14,206,158,675 | $5,480,500,200 |
| 1976 | $13,789,579,903 | $4,365,300,200 |
| 1975 | $13,027,415,244 | $3,645,900,000 |
| 1974 | $11,405,957,317 | $3,161,499,900 |
| 1973 | $9,987,709,650 | $2,569,200,100 |
| 1972 | $8,135,150,892 | $2,101,300,000 |
| 1971 | $6,914,658,400 | $1,984,800,000 |
| 1970 | $5,693,005,200 | $1,904,000,000 |
| 1969 | - | $1,715,399,900 |
| 1968 | - | $1,610,500,000 |
| 1967 | - | $1,453,500,000 |
| 1966 | - | $1,390,700,000 |
| 1965 | - | $1,331,399,900 |
| 1964 | - | $1,299,099,900 |
| 1963 | - | $1,262,800,000 |
| 1962 | - | $1,143,600,000 |
| 1961 | - | $1,076,699,900 |
| 1960 | - | $1,043,599,900 |
Data sources: World Bank | Economy & Growth (1960–2025, retrieved 2026-07-08).
GeoRank.org/facts/cuba/guatemala | CC BY 
Cuba and Guatemala economies compared
| Year | GDP per capita | |
|---|---|---|
|
Cuba
|
Guatemala
|
|
| 2025 | - | $6,598 |
| 2024 | - | $6,151 |
| 2023 | - | $5,754 |
| 2022 | - | $5,357 |
| 2021 | - | $4,913 |
| 2020 | $9,605 | $4,478 |
| 2019 | $9,232 | $4,512 |
| 2018 | $8,911 | $4,353 |
| 2017 | $8,611 | $4,325 |
| 2016 | $8,111 | $4,060 |
| 2015 | $7,728 | $3,894 |
| 2014 | $7,147 | $3,689 |
| 2013 | $6,828 | $3,444 |
| 2012 | $6,471 | $3,287 |
| 2011 | $6,104 | $3,169 |
| 2010 | $5,272 | $2,805 |
| 2009 | $5,089 | $2,612 |
| 2008 | $4,986 | $2,763 |
| 2007 | $4,807 | $2,459 |
| 2006 | $4,330 | $2,225 |
| 2005 | $3,786 | $2,046 |
| 2004 | $3,399 | $1,841 |
| 2003 | $3,203 | $1,723 |
| 2002 | $3,005 | $1,669 |
| 2001 | $2,843 | $1,538 |
| 2000 | $2,751 | $1,649 |
| 1999 | $2,562 | $1,604 |
| 1998 | $2,332 | $1,741 |
| 1997 | $2,306 | $1,638 |
| 1996 | $2,282 | $1,481 |
| 1995 | $2,785 | $1,421 |
| 1994 | $2,613 | $1,293 |
| 1993 | $2,063 | $1,166 |
| 1992 | $2,048 | $1,096 |
| 1991 | $2,269 | $1,014 |
| 1990 | $2,694 | $848 |
| 1989 | $2,566 | $958 |
| 1988 | $2,632 | $919 |
| 1987 | $2,440 | $854 |
| 1986 | $2,365 | $896 |
| 1985 | $2,257 | $1,238 |
| 1984 | $2,386 | $1,241 |
| 1983 | $2,222 | $1,220 |
| 1982 | $2,114 | $1,204 |
| 1981 | $2,046 | $1,216 |
| 1980 | $2,031 | $1,142 |
| 1979 | $2,006 | $1,026 |
| 1978 | $1,837 | $925 |
| 1977 | $1,472 | $856 |
| 1976 | $1,441 | $697 |
| 1975 | $1,374 | $595 |
| 1974 | $1,217 | $529 |
| 1973 | $1,079 | $441 |
| 1972 | $892 | $370 |
| 1971 | $770 | $358 |
| 1970 | $645 | $353 |
| 1969 | - | $326 |
| 1968 | - | $315 |
| 1967 | - | $291.9 |
| 1966 | - | $287.3 |
| 1965 | - | $283 |
| 1964 | - | $284.2 |
| 1963 | - | $284.4 |
| 1962 | - | $265.2 |
| 1961 | - | $257.2 |
| 1960 | - | $256.8 |
Data sources: World Bank | Economy & Growth (1960–2025, retrieved 2026-07-08).
GeoRank.org/facts/cuba/guatemala | CC BY
Cuba vs. Guatemala life expectancy calculator
| Year | Life expectancy, years | |
|---|---|---|
|
Cuba
|
Guatemala
|
|
| 2026 | 78.6 | 73 |
| 2025 | 78.4 | 72.9 |
| 2024 | 78.3 | 72.7 |
| 2023 | 78.1 | 72.6 |
| 2022 | 77.6 | 71.2 |
| 2021 | 73.2 | 67.9 |
| 2020 | 77.4 | 70 |
| 2019 | 77.4 | 71.6 |
| 2018 | 77.4 | 71.5 |
| 2017 | 77.3 | 71.6 |
| 2016 | 77.6 | 71.2 |
| 2015 | 77.7 | 70.9 |
| 2014 | 77.8 | 70.9 |
| 2013 | 78 | 70.9 |
| 2012 | 78.2 | 70.7 |
| 2011 | 78.1 | 70.3 |
| 2010 | 77.9 | 69.9 |
| 2009 | 77.6 | 69.7 |
| 2008 | 77.6 | 69.5 |
| 2007 | 77.6 | 69.3 |
| 2006 | 77.4 | 68.8 |
| 2005 | 77.5 | 68.2 |
| 2004 | 77.3 | 68.2 |
| 2003 | 77.4 | 68.2 |
| 2002 | 76.8 | 67.8 |
| 2001 | 76.4 | 67.4 |
| 2000 | 75.9 | 67.1 |
| 1999 | 75.7 | 66.6 |
| 1998 | 75.4 | 66 |
| 1997 | 75.1 | 65.2 |
| 1996 | 74.7 | 64.5 |
| 1995 | 74.3 | 63.7 |
| 1994 | 74.1 | 63 |
| 1993 | 73.9 | 62.4 |
| 1992 | 73.8 | 62 |
| 1991 | 73.8 | 61.9 |
| 1990 | 73.8 | 61.8 |
| 1989 | 73.7 | 61.7 |
| 1988 | 73.7 | 61.5 |
| 1987 | 73.6 | 61 |
| 1986 | 73.6 | 60.3 |
| 1985 | 73.5 | 59.8 |
| 1984 | 73.6 | 59.1 |
| 1983 | 73.6 | 57.9 |
| 1982 | 73.4 | 48.9 |
| 1981 | 73 | 54.7 |
| 1980 | 72.6 | 55.3 |
| 1979 | 72.3 | 56.6 |
| 1978 | 71.9 | 56.4 |
| 1977 | 71.4 | 55.2 |
| 1976 | 70.9 | 47.6 |
| 1975 | 70.4 | 52.8 |
| 1974 | 69.9 | 53 |
| 1973 | 69.3 | 52.8 |
| 1972 | 68.9 | 51.8 |
| 1971 | 68.4 | 50.3 |
| 1970 | 67.9 | 48.5 |
| 1969 | 67.4 | 47.5 |
| 1968 | 66.9 | 47.8 |
| 1967 | 66.5 | 47.7 |
| 1966 | 66.1 | 47.5 |
| 1965 | 65.6 | 47.2 |
| 1964 | 65.3 | 47.1 |
| 1963 | 64.3 | 46.6 |
| 1962 | 64.4 | 46.5 |
| 1961 | 63.7 | 46.1 |
| 1960 | 63.3 | 45.8 |
| 1959 | 62.8 | 44.3 |
| 1958 | 62.3 | 43.1 |
| 1957 | 61.9 | 41.9 |
| 1956 | 61.5 | 41.3 |
| 1955 | 61.2 | 40.7 |
| 1954 | 60.7 | 40.1 |
| 1953 | 60.2 | 39.5 |
| 1952 | 59.8 | 38.9 |
| 1951 | 59.4 | 38.3 |
| 1950 | 59 | 37.8 |
Data sources: United Nations | World Population Prospects (1950–2026, retrieved 2026-07-08).
GeoRank.org/facts/cuba/guatemala | CC BY
Cuba and Guatemala population clocks and comparison
| Year | Population | |
|---|---|---|
|
Cuba
|
Guatemala
|
|
| 2025 | 10,937,203 | 18,687,881 |
| 2024 | 10,979,783 | 18,406,359 |
| 2023 | 11,019,931 | 18,124,838 |
| 2022 | 11,059,820 | 17,847,877 |
| 2021 | 11,122,168 | 17,598,650 |
| 2020 | 11,176,354 | 17,357,325 |
| 2019 | 11,202,846 | 17,103,803 |
| 2018 | 11,227,118 | 16,845,685 |
| 2017 | 11,247,829 | 16,567,357 |
| 2016 | 11,265,612 | 16,268,760 |
| 2015 | 11,275,065 | 15,971,743 |
| 2014 | 11,285,775 | 15,681,725 |
| 2013 | 11,298,167 | 15,387,337 |
| 2012 | 11,303,175 | 15,089,647 |
| 2011 | 11,301,571 | 14,792,126 |
| 2010 | 11,297,409 | 14,500,112 |
| 2009 | 11,294,719 | 14,215,611 |
| 2008 | 11,291,762 | 13,935,174 |
| 2007 | 11,287,272 | 13,652,040 |
| 2006 | 11,278,550 | 13,367,459 |
| 2005 | 11,262,554 | 13,087,629 |
| 2004 | 11,238,756 | 12,807,402 |
| 2003 | 11,209,383 | 12,525,842 |
| 2002 | 11,177,418 | 12,246,915 |
| 2001 | 11,144,132 | 11,969,422 |
| 2000 | 11,109,109 | 11,697,592 |
| 1999 | 11,072,230 | 11,422,965 |
| 1998 | 11,034,712 | 11,139,145 |
| 1997 | 10,997,934 | 10,857,754 |
| 1996 | 10,962,010 | 10,583,526 |
| 1995 | 10,925,362 | 10,312,996 |
| 1994 | 10,886,021 | 10,043,718 |
| 1993 | 10,841,031 | 9,779,761 |
| 1992 | 10,785,801 | 9,522,266 |
| 1991 | 10,717,640 | 9,272,584 |
| 1990 | 10,631,799 | 9,024,773 |
| 1989 | 10,533,243 | 8,775,546 |
| 1988 | 10,432,585 | 8,532,099 |
| 1987 | 10,335,342 | 8,296,485 |
| 1986 | 10,244,247 | 8,070,818 |
| 1985 | 10,157,228 | 7,849,693 |
| 1984 | 10,073,299 | 7,630,682 |
| 1983 | 9,991,026 | 7,419,642 |
| 1982 | 9,912,681 | 7,240,241 |
| 1981 | 9,849,320 | 7,075,648 |
| 1980 | 9,804,796 | 6,900,212 |
| 1979 | 9,763,355 | 6,727,797 |
| 1978 | 9,711,980 | 6,561,534 |
| 1977 | 9,648,440 | 6,401,515 |
| 1976 | 9,571,242 | 6,262,404 |
| 1975 | 9,479,726 | 6,128,731 |
| 1974 | 9,374,183 | 5,981,197 |
| 1973 | 9,255,328 | 5,831,631 |
| 1972 | 9,123,891 | 5,682,833 |
| 1971 | 8,979,085 | 5,538,355 |
| 1970 | 8,824,382 | 5,396,966 |
| 1969 | 8,666,640 | 5,257,081 |
| 1968 | 8,509,522 | 5,118,111 |
| 1967 | 8,352,625 | 4,978,862 |
| 1966 | 8,193,450 | 4,840,958 |
| 1965 | 8,030,797 | 4,704,965 |
| 1964 | 7,866,020 | 4,571,109 |
| 1963 | 7,701,660 | 4,440,264 |
| 1962 | 7,541,098 | 4,312,044 |
| 1961 | 7,387,117 | 4,186,201 |
| 1960 | 7,238,081 | 4,063,655 |
Data sources: World Bank | Health (1960–2025, retrieved 2026-07-08).
GeoRank.org/facts/cuba/guatemala | CC BY
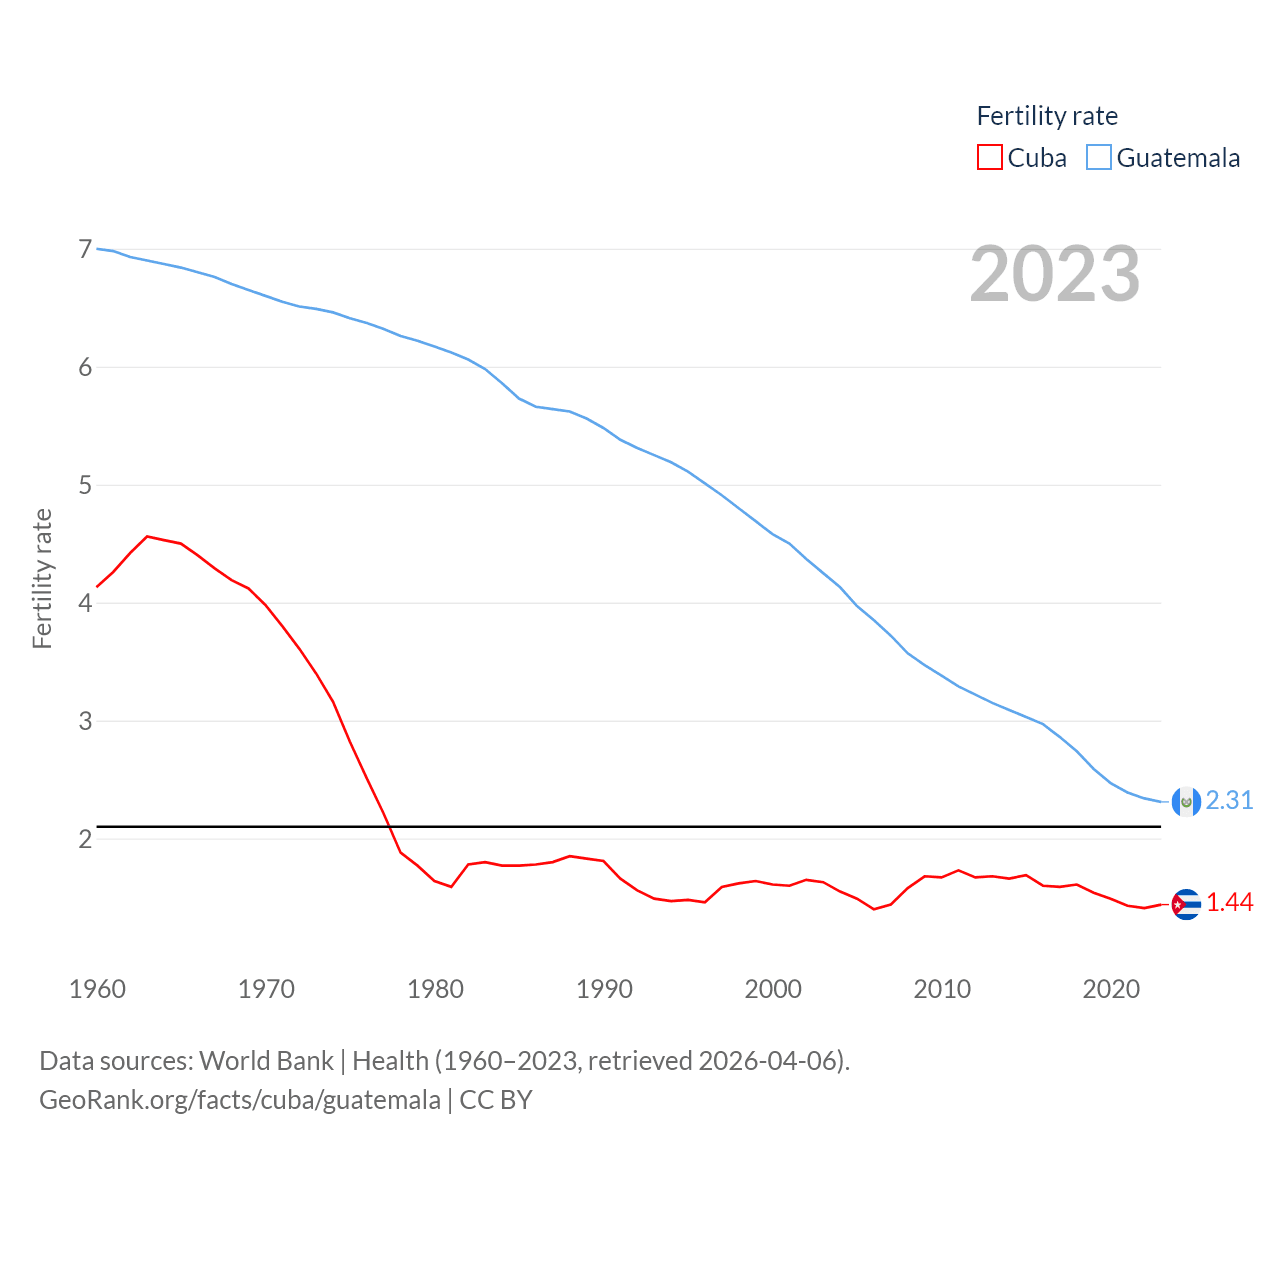
Fertility rates in Cuba and Guatemala
| Year | Fertility rate | |
|---|---|---|
|
Cuba
|
Guatemala
|
|
| 2024 | 1.45 | 2.29 |
| 2023 | 1.44 | 2.31 |
| 2022 | 1.41 | 2.34 |
| 2021 | 1.43 | 2.39 |
| 2020 | 1.49 | 2.47 |
| 2019 | 1.54 | 2.59 |
| 2018 | 1.61 | 2.74 |
| 2017 | 1.59 | 2.86 |
| 2016 | 1.6 | 2.97 |
| 2015 | 1.69 | 3.03 |
| 2014 | 1.66 | 3.09 |
| 2013 | 1.68 | 3.15 |
| 2012 | 1.67 | 3.22 |
| 2011 | 1.73 | 3.29 |
| 2010 | 1.67 | 3.38 |
| 2009 | 1.68 | 3.47 |
| 2008 | 1.58 | 3.57 |
| 2007 | 1.44 | 3.72 |
| 2006 | 1.4 | 3.85 |
| 2005 | 1.49 | 3.97 |
| 2004 | 1.55 | 4.13 |
| 2003 | 1.63 | 4.25 |
| 2002 | 1.65 | 4.37 |
| 2001 | 1.6 | 4.5 |
| 2000 | 1.61 | 4.58 |
| 1999 | 1.64 | 4.69 |
| 1998 | 1.62 | 4.8 |
| 1997 | 1.59 | 4.91 |
| 1996 | 1.46 | 5.01 |
| 1995 | 1.48 | 5.11 |
| 1994 | 1.47 | 5.19 |
| 1993 | 1.49 | 5.25 |
| 1992 | 1.56 | 5.31 |
| 1991 | 1.66 | 5.38 |
| 1990 | 1.81 | 5.48 |
| 1989 | 1.83 | 5.56 |
| 1988 | 1.85 | 5.62 |
| 1987 | 1.8 | 5.64 |
| 1986 | 1.78 | 5.66 |
| 1985 | 1.77 | 5.73 |
| 1984 | 1.77 | 5.86 |
| 1983 | 1.8 | 5.98 |
| 1982 | 1.78 | 6.06 |
| 1981 | 1.59 | 6.12 |
| 1980 | 1.64 | 6.17 |
| 1979 | 1.77 | 6.22 |
| 1978 | 1.88 | 6.26 |
| 1977 | 2.21 | 6.32 |
| 1976 | 2.51 | 6.37 |
| 1975 | 2.82 | 6.41 |
| 1974 | 3.16 | 6.46 |
| 1973 | 3.4 | 6.49 |
| 1972 | 3.61 | 6.51 |
| 1971 | 3.8 | 6.55 |
| 1970 | 3.98 | 6.6 |
| 1969 | 4.12 | 6.65 |
| 1968 | 4.19 | 6.7 |
| 1967 | 4.29 | 6.76 |
| 1966 | 4.4 | 6.8 |
| 1965 | 4.5 | 6.84 |
| 1964 | 4.53 | 6.87 |
| 1963 | 4.56 | 6.9 |
| 1962 | 4.42 | 6.93 |
| 1961 | 4.26 | 6.98 |
| 1960 | 4.13 | 7 |
Data sources: World Bank | Health (1960–2024, retrieved 2026-07-08).
GeoRank.org/facts/cuba/guatemala | CC BY
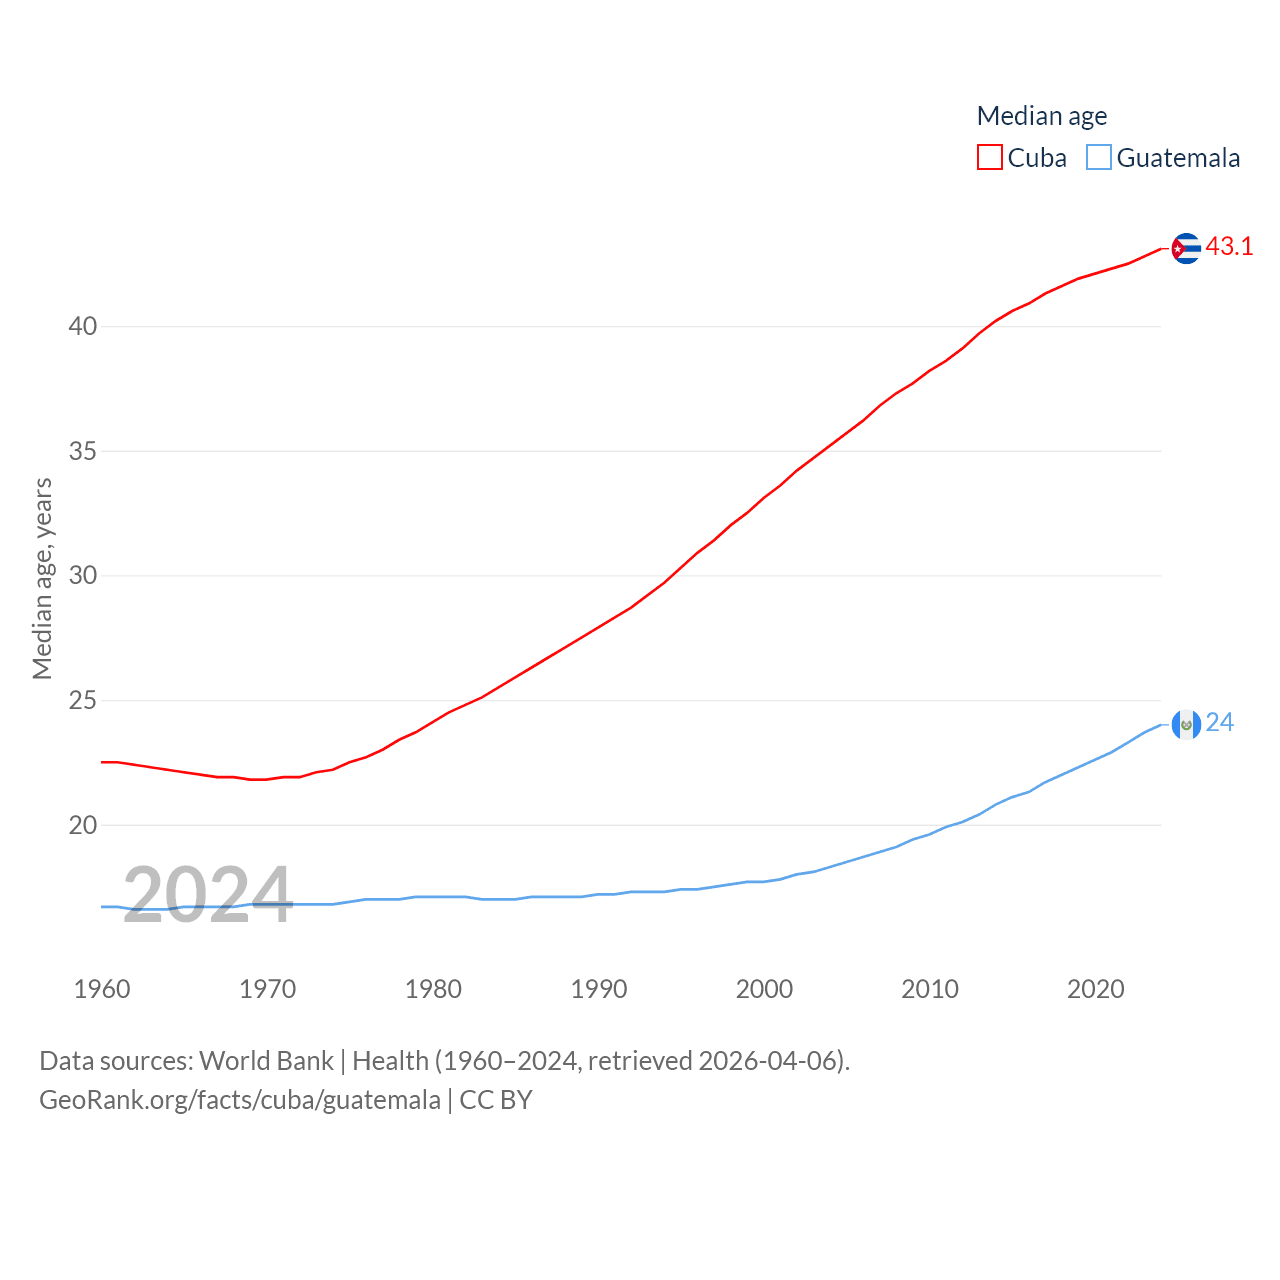
Cuba and Guatemala demographics compared
| Year | Median age, years | |
|---|---|---|
|
Cuba
|
Guatemala
|
|
| 2025 | 43.4 | 24.4 |
| 2024 | 43.1 | 24 |
| 2023 | 42.8 | 23.7 |
| 2022 | 42.5 | 23.3 |
| 2021 | 42.3 | 22.9 |
| 2020 | 42.1 | 22.6 |
| 2019 | 41.9 | 22.3 |
| 2018 | 41.6 | 22 |
| 2017 | 41.3 | 21.7 |
| 2016 | 40.9 | 21.3 |
| 2015 | 40.6 | 21.1 |
| 2014 | 40.2 | 20.8 |
| 2013 | 39.7 | 20.4 |
| 2012 | 39.1 | 20.1 |
| 2011 | 38.6 | 19.9 |
| 2010 | 38.2 | 19.6 |
| 2009 | 37.7 | 19.4 |
| 2008 | 37.3 | 19.1 |
| 2007 | 36.8 | 18.9 |
| 2006 | 36.2 | 18.7 |
| 2005 | 35.7 | 18.5 |
| 2004 | 35.2 | 18.3 |
| 2003 | 34.7 | 18.1 |
| 2002 | 34.2 | 18 |
| 2001 | 33.6 | 17.8 |
| 2000 | 33.1 | 17.7 |
| 1999 | 32.5 | 17.7 |
| 1998 | 32 | 17.6 |
| 1997 | 31.4 | 17.5 |
| 1996 | 30.9 | 17.4 |
| 1995 | 30.3 | 17.4 |
| 1994 | 29.7 | 17.3 |
| 1993 | 29.2 | 17.3 |
| 1992 | 28.7 | 17.3 |
| 1991 | 28.3 | 17.2 |
| 1990 | 27.9 | 17.2 |
| 1989 | 27.5 | 17.1 |
| 1988 | 27.1 | 17.1 |
| 1987 | 26.7 | 17.1 |
| 1986 | 26.3 | 17.1 |
| 1985 | 25.9 | 17 |
| 1984 | 25.5 | 17 |
| 1983 | 25.1 | 17 |
| 1982 | 24.8 | 17.1 |
| 1981 | 24.5 | 17.1 |
| 1980 | 24.1 | 17.1 |
| 1979 | 23.7 | 17.1 |
| 1978 | 23.4 | 17 |
| 1977 | 23 | 17 |
| 1976 | 22.7 | 17 |
| 1975 | 22.5 | 16.9 |
| 1974 | 22.2 | 16.8 |
| 1973 | 22.1 | 16.8 |
| 1972 | 21.9 | 16.8 |
| 1971 | 21.9 | 16.8 |
| 1970 | 21.8 | 16.8 |
| 1969 | 21.8 | 16.8 |
| 1968 | 21.9 | 16.7 |
| 1967 | 21.9 | 16.7 |
| 1966 | 22 | 16.7 |
| 1965 | 22.1 | 16.7 |
| 1964 | 22.2 | 16.6 |
| 1963 | 22.3 | 16.6 |
| 1962 | 22.4 | 16.6 |
| 1961 | 22.5 | 16.7 |
| 1960 | 22.5 | 16.7 |
Data sources: World Bank | Health (1960–2025, retrieved 2026-07-08).
GeoRank.org/facts/cuba/guatemala | CC BY
Interactive Maps
Use the buttons below to switch between world maps comparing statistics for Cuba and Guatemala.
National statistics comparison
Finance
|
Cuba
|
Guatemala
|
|
|---|---|---|
| GNI, Atlas method |
$101B
2019 |
$119B
2025 |
| Government expenditure, % of GDP |
49%
2026 |
14.7%
2025 |
| Education expenditure, % of GDP |
8.44%
2022 |
3.08%
2024 |
| Military expenditure, % of GDP |
2.88%
2018 |
0.37%
2024 |
| Armed forces personnel |
76,000
2020 |
43,000
2020 |
| Deficit/surplus, % of GDP | n/a |
-1.91%
2025 |
| Unemployment rate |
1.7%
2018 |
1.9%
2024 |
| Services, % of GDP |
73.4%
2024 |
62.1%
2025 |
| Industry, % of GDP |
23.8%
2024 |
21.8%
2025 |
| Economic freedom index |
25.2
2026 |
63.5
2026 |
| Income share by richest 10% | n/a |
34.1%
2023 |
| Income share by poorest 10% | n/a |
1.6%
2023 |
| Total reserves including gold |
$144M
1960 |
$32.8B
2025 |
| Personal remittances received | n/a |
$21.6B
2024 |
| International tourist arrivals |
1,086,000
2020 |
594,000
2020 |
| International tourism as share of exports | n/a |
2.35%
2020 |
| Banked people share | n/a |
38.3%
2024 |
Energy
|
Cuba
|
Guatemala
|
|
|---|---|---|
| Energy use, kg of oil equivalent per capita |
776 kg
2023 |
935 kg
2023 |
| GDP PPP per kg equivalent of energy use | n/a |
$14.7
2023 |
| Carbon dioxide (CO2) emissions |
21 megatons
2024 |
20.4 megatons
2024 |
| CO2 emissions per capita |
1.91 tons
2024 |
1.11 tons
2024 |
| Fossil fuel energy use share |
88.1%
2022 |
34.6%
2022 |
| Renewable energy use share |
20.9%
2021 |
62.1%
2021 |
| Alternative and nuclear energy use share |
0.35%
2023 |
4.23%
2023 |
| Net energy imports use share |
62.8%
2022 |
38.4%
2022 |
| Electric power consumption per capita |
1,462 kWh
2023 |
733 kWh
2023 |
| Renewable electricity output share |
4.77%
2021 |
60.6%
2021 |
| Hydroelectric share |
0.53%
2023 |
30.6%
2023 |
| Nuclear share |
0%
2021 |
0%
2021 |
| Electricity access |
100%
2023 |
100%
2023 |
Society
|
Cuba
|
Guatemala
|
|
|---|---|---|
| % of world population |
0.13%
2025 |
0.23%
2025 |
| Annual migration change |
-22,244
2025 |
-7,959
2025 |
| Urban population |
77.2%
2025 |
56.3%
2025 |
| Male:Female ratio |
49.3:50.7
2025 |
49.6:50.4
2025 |
| Average male height |
5.7 ft
2026 |
5.25 ft
2026 |
| Average female height |
5.25 ft
2026 |
4.86 ft
2026 |
| Quality of life index |
51.6
2026 |
38.6
2026 |
| Corruption Perceptions Index |
40
2025 |
26
2025 |
| Higher education index |
51
2026 |
41
2026 |
| Homicides per 100K people |
4.46
2019 |
23.4
2023 |
| Road traffic mortality per 100K people |
8.9
2019 |
22.9
2019 |
| Visa free countries |
72
2026 |
131
2026 |
| Adult literacy rate |
99.7%
2021 |
82.1%
2024 |
| English speaking |
6%
2026 |
5%
2026 |
| People using the Internet |
70.5%
2024 |
60.2%
2024 |
Health
|
Cuba
|
Guatemala
|
|
|---|---|---|
| Government health expenditure per capita |
$1,199
2020 |
$392
2023 |
| Out-of-pocket health expenditure per capita |
$107
2020 |
$224.2
2023 |
| Life expectancy |
78.6 years
2026 |
73 years
2026 |
| Foreign aid share of health expenditure |
0.02%
2023 |
2.97%
2023 |
| Physicians per 1,000 people |
9.54
2021 |
1.28
2020 |
| Age at first childbirth | n/a |
20.6 years
2025 |
| Maternal mortality per 100K births |
35
2023 |
94
2023 |
| Mortality rate before reaching 5 years of age |
8.6
2024 |
20.5
2024 |
| Obesity rate |
22.6%
2022 |
27.6%
2022 |
| Diabetes prevalence |
9.4%
2024 |
13.2%
2024 |
| Air quality index |
90
2026 |
37
2026 |
| Tobacco use prevalence |
16.1%
2024 |
11.2%
2024 |
| Pure alcohol consumption per capita |
5.38 liters
2020 |
1.54 liters
2020 |
Territory
In-depth comparisons
Help us show the world through your eyes
Share a photo of your city and help others discover what it looks like to live there. Your contribution makes our data come alive.
Data sources:
- World Bank | Health (1960–2025, retrieved 2026-07-08)
- United Nations | World Population Prospects (1950–2026, retrieved 2026-07-08)
- U.S. Census Bureau (1960–2025, retrieved 2026-07-08)
- Central Intelligence Agency (CIA) (2000–2025, retrieved 2026-07-08)
- International Monetary Fund (IMF) | Fiscal Monitor (2025, retrieved 2026-07-08)
- LivingCost (2026, retrieved 2026-07-08)
- World Obesity Federation (2022, retrieved 2026-07-08)
- Transparency International (2025, retrieved 2026-07-08)
- The Heritage Foundation | Economic Freedom Index (2026, retrieved 2026-07-08)
- Passport Index (2026, retrieved 2026-07-08)
- EduRank (2026, retrieved 2026-07-08)
Creative Commons Attribution (CC BY) — you’re free to copy, share, remix, adapt, and use even commercially as long as you give appropriate credit and clearly indicate if you made changes. Other sources may be subject to different license terms.