Haiti has a population of 11.9M (ranked 83/197), compared with 136K in Kiribati (ranked 180/197). Haiti's land area is 10,641 sq mi versus 313 sq mi for Kiribati (ranked 142nd vs. 173rd).
By GDP, Haiti ranks 112/197 ($32.1B) and Kiribati ranks 192/197 ($349M). By GDP per capita, Haiti ranks 150/197 ($2,694), while Kiribati ranks 152/197 ($2,559).
Main facts and rankings
 Haiti
Haiti
|
 Kiribati
|
|
|---|---|---|
| Population |
12106577
|
139471
|
| Population rank | 82/197 | 180/197 |
| GDP |
$32.1B
2025 |
$349M
2025 |
| GDP rank | 112/197 | 192/197 |
| GDP per capita |
$2,694
2025 |
$2,559
2025 |
| GDP per capita rank | 150/197 | 152/197 |
| GDP per capita, PPP |
$3,194
2024 |
$3,702
2024 |
| Government debt |
$3.95B
2025 |
$27.8M
2025 |
| Debt-to-GDP ratio |
12.3%
2025 |
7.95%
2025 |
| Government debt per person |
$332
2025 |
$203.4
2025 |
| Government debt per person rank | 177/185 | 181/185 |
| Average annual personal income after taxes |
$2,152
2026 |
$2,170
2026 |
| Land area | 10,641 sq mi | 313 sq mi |
| Population density |
1,131 ppl/mi²
2026 |
443 ppl/mi²
2026 |
| Fertility rate |
2.63
2024 |
3.12
2024 |
| Median age |
25.1 years
2025 |
23.9 years
2025 |
| Life expectancy |
65.5 years
2026 |
66.9 years
2026 |
Haiti and Kiribati: Comparison Charts
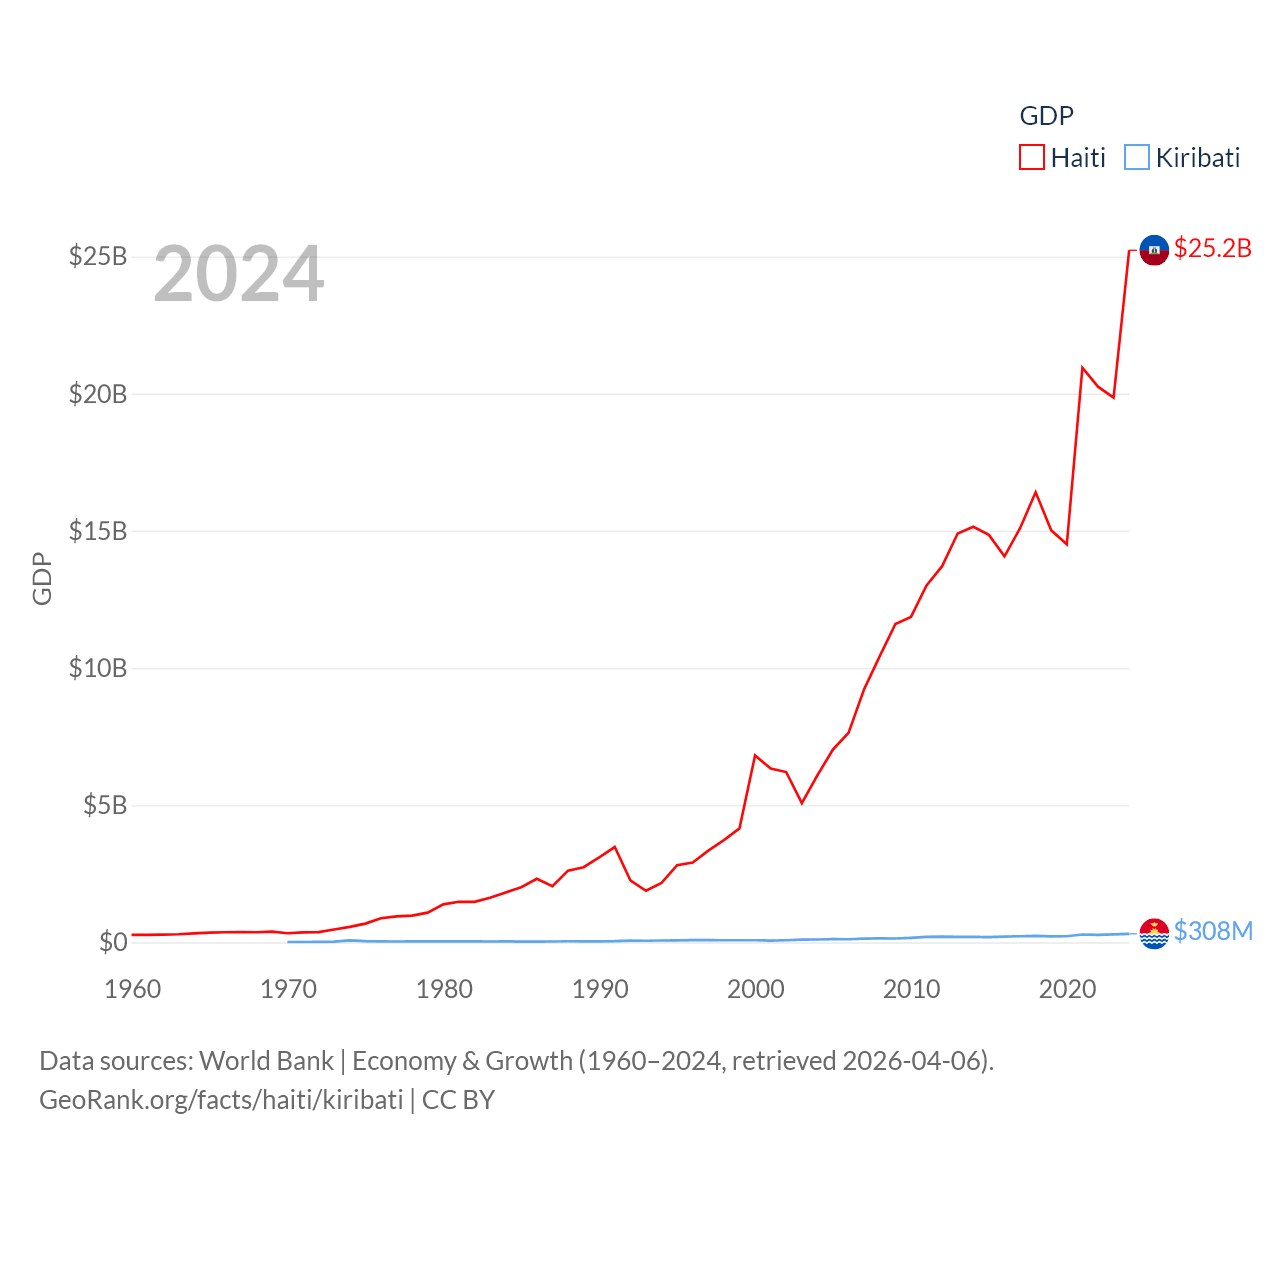
Haiti and Kiribati economies compared
| Year | GDP | |
|---|---|---|
|
Haiti
|
Kiribati
|
|
| 2025 | $32,077,278,409 | $349,227,254 |
| 2024 | $24,255,657,481 | $343,153,235 |
| 2023 | $19,572,288,894 | $291,657,338 |
| 2022 | $20,113,007,126 | $271,214,375 |
| 2021 | $20,754,978,152 | $285,451,584 |
| 2020 | $14,508,222,518 | $220,909,307 |
| 2019 | $15,016,090,930 | $216,891,541 |
| 2018 | $16,403,864,618 | $233,859,230 |
| 2017 | $15,093,357,161 | $223,029,865 |
| 2016 | $14,069,277,526 | $206,467,819 |
| 2015 | $14,849,629,309 | $191,559,399 |
| 2014 | $15,146,883,498 | $200,287,282 |
| 2013 | $14,902,488,604 | $201,730,861 |
| 2012 | $13,708,925,477 | $207,001,546 |
| 2011 | $13,008,746,039 | $195,970,140 |
| 2010 | $11,859,312,725 | $165,458,433 |
| 2009 | $11,597,002,835 | $140,177,384 |
| 2008 | $10,432,962,635 | $147,017,895 |
| 2007 | $9,228,637,768 | $138,054,946 |
| 2006 | $7,638,739,123 | $112,338,353 |
| 2005 | $7,030,149,730 | $113,895,437 |
| 2004 | $6,087,360,684 | $104,085,892 |
| 2003 | $5,071,947,798 | $96,105,619 |
| 2002 | $6,205,847,214 | $74,743,869 |
| 2001 | $6,331,970,324 | $64,935,850 |
| 2000 | $6,813,566,099 | $74,910,527 |
| 1999 | $4,153,725,884 | $77,323,978 |
| 1998 | $3,723,903,724 | $74,905,706 |
| 1997 | $3,338,949,152 | $80,205,807 |
| 1996 | $2,907,517,604 | $81,456,854 |
| 1995 | $2,813,313,279 | $68,596,395 |
| 1994 | $2,167,569,046 | $67,055,334 |
| 1993 | $1,878,253,767 | $58,953,596 |
| 1992 | $2,257,129,792 | $61,491,369 |
| 1991 | $3,473,562,628 | $41,247,792 |
| 1990 | $3,096,289,800 | $36,534,295 |
| 1989 | $2,736,243,800 | $37,645,319 |
| 1988 | $2,613,926,800 | $38,278,810 |
| 1987 | $2,047,200,000 | $29,554,413 |
| 1986 | $2,318,000,000 | $25,993,009 |
| 1985 | $2,009,400,000 | $26,126,615 |
| 1984 | $1,816,200,000 | $34,394,167 |
| 1983 | $1,623,600,000 | $31,000,546 |
| 1982 | $1,474,200,000 | $32,742,713 |
| 1981 | $1,479,400,000 | $35,267,489 |
| 1980 | $1,383,800,000 | $33,157,723 |
| 1979 | $1,080,600,000 | $34,466,197 |
| 1978 | $974,200,000 | $36,563,965 |
| 1977 | $947,000,000 | $31,335,459 |
| 1976 | $879,000,000 | $33,246,817 |
| 1975 | $681,400,000 | $44,547,454 |
| 1974 | $565,399,322 | $69,256,489 |
| 1973 | $466,798,973 | $25,645,040 |
| 1972 | $371,998,958 | $15,314,346 |
| 1971 | $362,800,000 | $12,356,134 |
| 1970 | $331,200,000 | $11,560,877 |
| 1969 | $391,820,400 | - |
| 1968 | $367,968,800 | - |
| 1967 | $369,124,200 | - |
| 1966 | $368,948,600 | - |
| 1965 | $353,251,800 | - |
| 1964 | $325,281,200 | - |
| 1963 | $294,883,400 | - |
| 1962 | $281,896,800 | - |
| 1961 | $271,066,000 | - |
| 1960 | $273,187,200 | - |
Data sources: World Bank | Economy & Growth (1960–2025, retrieved 2026-07-08).
GeoRank.org/facts/haiti/kiribati | CC BY 
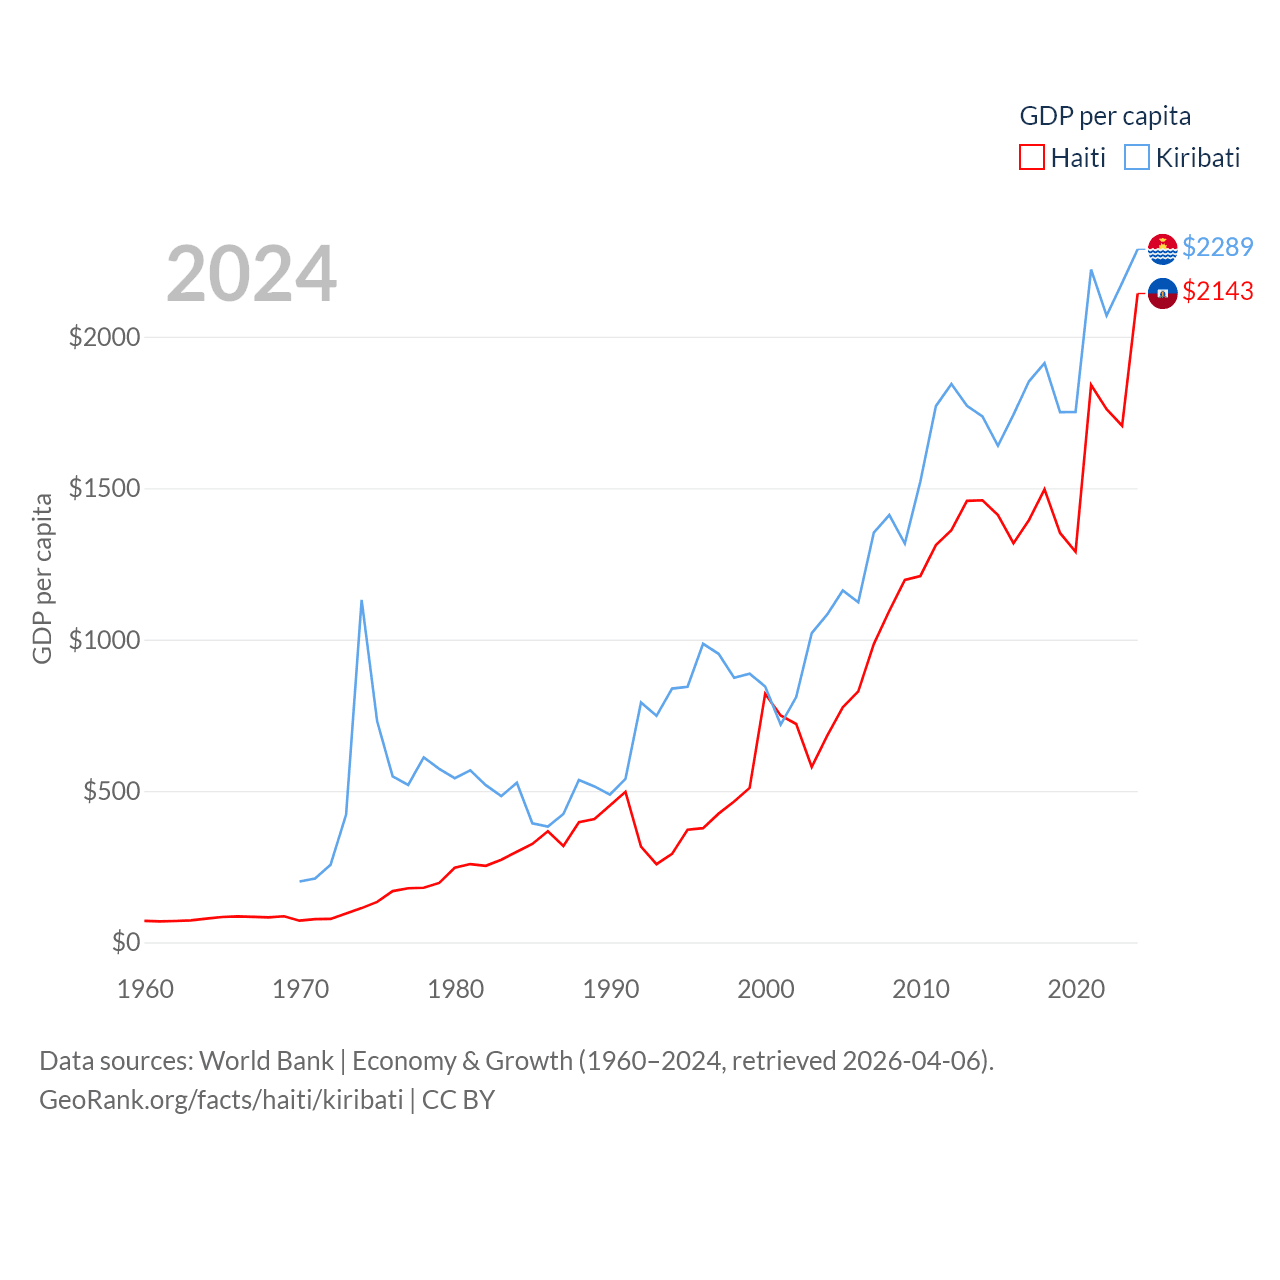
Haiti and Kiribati economies compared
| Year | GDP per capita | |
|---|---|---|
|
Haiti
|
Kiribati
|
|
| 2025 | $2,694 | $2,559 |
| 2024 | $2,060 | $2,551 |
| 2023 | $1,682 | $2,201 |
| 2022 | $1,748 | $2,079 |
| 2021 | $1,825 | $2,224 |
| 2020 | $1,290 | $1,752 |
| 2019 | $1,352 | $1,750 |
| 2018 | $1,496 | $1,916 |
| 2017 | $1,395 | $1,854 |
| 2016 | $1,318 | $1,743 |
| 2015 | $1,411 | $1,640 |
| 2014 | $1,460 | $1,737 |
| 2013 | $1,458 | $1,772 |
| 2012 | $1,361 | $1,844 |
| 2011 | $1,312 | $1,771 |
| 2010 | $1,210 | $1,522 |
| 2009 | $1,197 | $1,317 |
| 2008 | $1,095 | $1,411 |
| 2007 | $985 | $1,353 |
| 2006 | $829 | $1,123 |
| 2005 | $776 | $1,162 |
| 2004 | $683 | $1,083 |
| 2003 | $579 | $1,021 |
| 2002 | $721 | $810 |
| 2001 | $749 | $719 |
| 2000 | $821 | $845 |
| 1999 | $510 | $887 |
| 1998 | $465 | $874 |
| 1997 | $425 | $953 |
| 1996 | $377 | $986 |
| 1995 | $372 | $844 |
| 1994 | $292.1 | $838 |
| 1993 | $258.1 | $748 |
| 1992 | $316 | $792 |
| 1991 | $497 | $540 |
| 1990 | $452 | $488 |
| 1989 | $407 | $515 |
| 1988 | $397 | $536 |
| 1987 | $318 | $424 |
| 1986 | $367 | $382 |
| 1985 | $325 | $393 |
| 1984 | $299.2 | $527 |
| 1983 | $272.8 | $483 |
| 1982 | $252.6 | $519 |
| 1981 | $258.5 | $568 |
| 1980 | $246.5 | $542 |
| 1979 | $196.2 | $573 |
| 1978 | $180.3 | $611 |
| 1977 | $178.7 | $520 |
| 1976 | $169.1 | $548 |
| 1975 | $133.6 | $730 |
| 1974 | $113 | $1,131 |
| 1973 | $95.1 | $422 |
| 1972 | $77.3 | $256.2 |
| 1971 | $76.8 | $210.7 |
| 1970 | $71.5 | $201 |
| 1969 | $86.1 | - |
| 1968 | $82.4 | - |
| 1967 | $84.2 | - |
| 1966 | $85.7 | - |
| 1965 | $83.6 | - |
| 1964 | $78.5 | - |
| 1963 | $72.4 | - |
| 1962 | $70.4 | - |
| 1961 | $69 | - |
| 1960 | $70.8 | - |
Data sources: World Bank | Economy & Growth (1960–2025, retrieved 2026-07-08).
GeoRank.org/facts/haiti/kiribati | CC BY
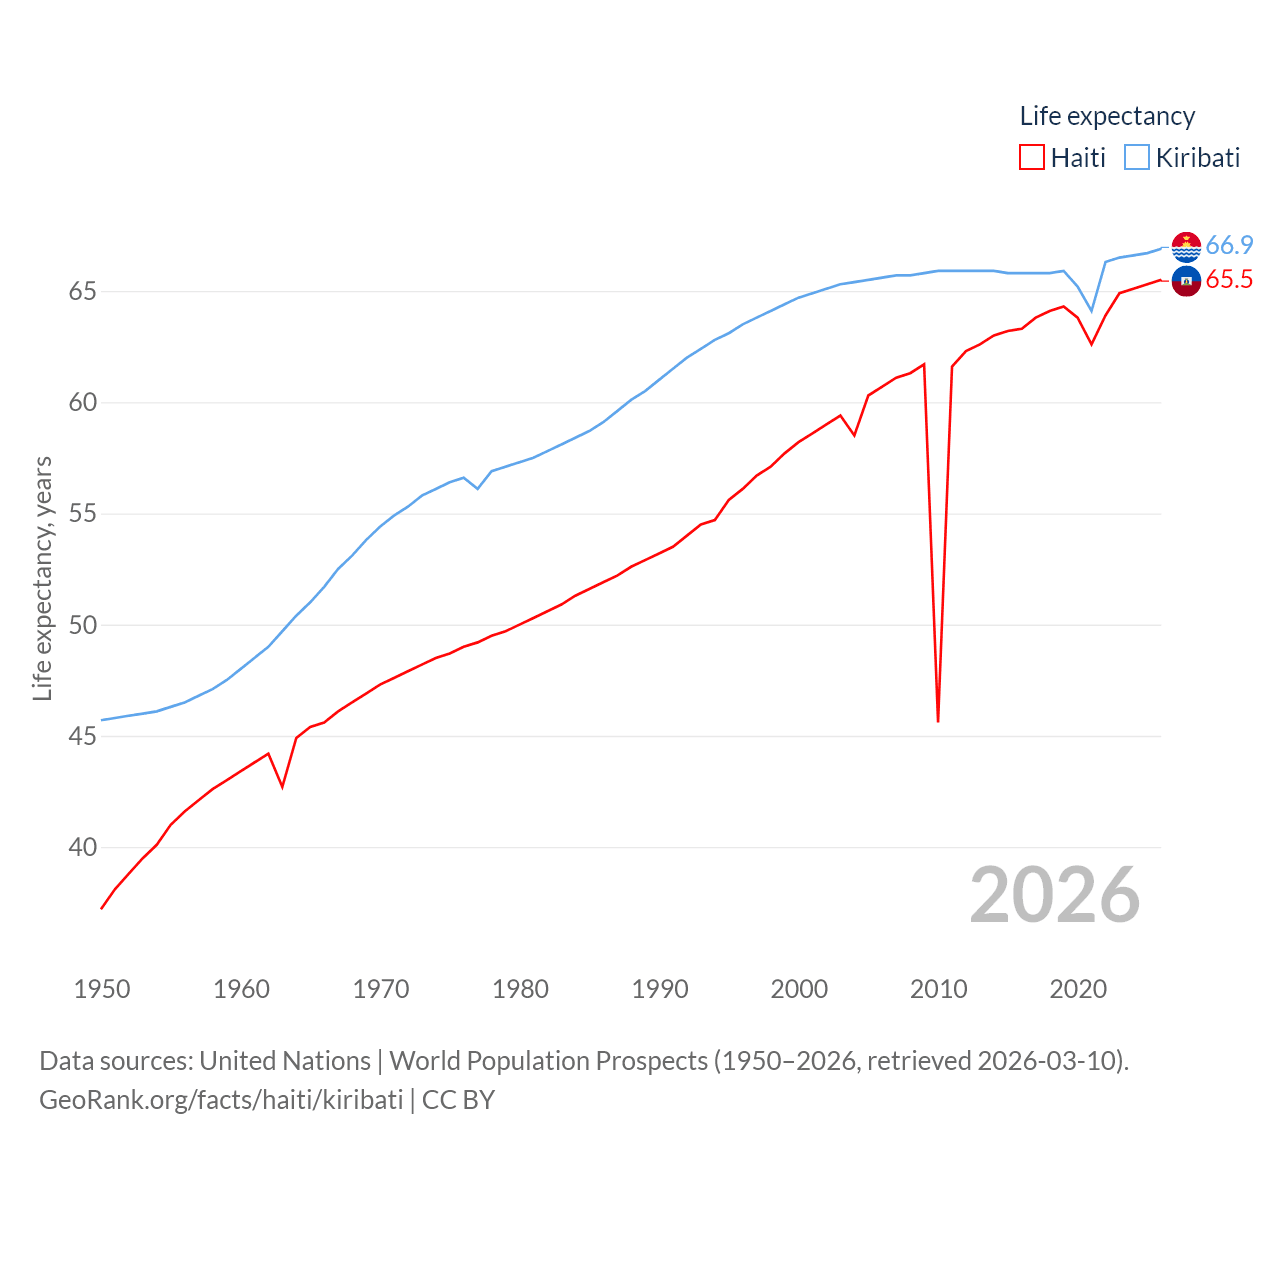
Haiti vs. Kiribati life expectancy calculator
| Year | Life expectancy, years | |
|---|---|---|
|
Haiti
|
Kiribati
|
|
| 2026 | 65.5 | 66.9 |
| 2025 | 65.3 | 66.7 |
| 2024 | 65.1 | 66.6 |
| 2023 | 64.9 | 66.5 |
| 2022 | 63.9 | 66.3 |
| 2021 | 62.6 | 64.1 |
| 2020 | 63.8 | 65.2 |
| 2019 | 64.3 | 65.9 |
| 2018 | 64.1 | 65.8 |
| 2017 | 63.8 | 65.8 |
| 2016 | 63.3 | 65.8 |
| 2015 | 63.2 | 65.8 |
| 2014 | 63 | 65.9 |
| 2013 | 62.6 | 65.9 |
| 2012 | 62.3 | 65.9 |
| 2011 | 61.6 | 65.9 |
| 2010 | 45.6 | 65.9 |
| 2009 | 61.7 | 65.8 |
| 2008 | 61.3 | 65.7 |
| 2007 | 61.1 | 65.7 |
| 2006 | 60.7 | 65.6 |
| 2005 | 60.3 | 65.5 |
| 2004 | 58.5 | 65.4 |
| 2003 | 59.4 | 65.3 |
| 2002 | 59 | 65.1 |
| 2001 | 58.6 | 64.9 |
| 2000 | 58.2 | 64.7 |
| 1999 | 57.7 | 64.4 |
| 1998 | 57.1 | 64.1 |
| 1997 | 56.7 | 63.8 |
| 1996 | 56.1 | 63.5 |
| 1995 | 55.6 | 63.1 |
| 1994 | 54.7 | 62.8 |
| 1993 | 54.5 | 62.4 |
| 1992 | 54 | 62 |
| 1991 | 53.5 | 61.5 |
| 1990 | 53.2 | 61 |
| 1989 | 52.9 | 60.5 |
| 1988 | 52.6 | 60.1 |
| 1987 | 52.2 | 59.6 |
| 1986 | 51.9 | 59.1 |
| 1985 | 51.6 | 58.7 |
| 1984 | 51.3 | 58.4 |
| 1983 | 50.9 | 58.1 |
| 1982 | 50.6 | 57.8 |
| 1981 | 50.3 | 57.5 |
| 1980 | 50 | 57.3 |
| 1979 | 49.7 | 57.1 |
| 1978 | 49.5 | 56.9 |
| 1977 | 49.2 | 56.1 |
| 1976 | 49 | 56.6 |
| 1975 | 48.7 | 56.4 |
| 1974 | 48.5 | 56.1 |
| 1973 | 48.2 | 55.8 |
| 1972 | 47.9 | 55.3 |
| 1971 | 47.6 | 54.9 |
| 1970 | 47.3 | 54.4 |
| 1969 | 46.9 | 53.8 |
| 1968 | 46.5 | 53.1 |
| 1967 | 46.1 | 52.5 |
| 1966 | 45.6 | 51.7 |
| 1965 | 45.4 | 51 |
| 1964 | 44.9 | 50.4 |
| 1963 | 42.7 | 49.7 |
| 1962 | 44.2 | 49 |
| 1961 | 43.8 | 48.5 |
| 1960 | 43.4 | 48 |
| 1959 | 43 | 47.5 |
| 1958 | 42.6 | 47.1 |
| 1957 | 42.1 | 46.8 |
| 1956 | 41.6 | 46.5 |
| 1955 | 41 | 46.3 |
| 1954 | 40.1 | 46.1 |
| 1953 | 39.5 | 46 |
| 1952 | 38.8 | 45.9 |
| 1951 | 38.1 | 45.8 |
| 1950 | 37.2 | 45.7 |
Data sources: United Nations | World Population Prospects (1950–2026, retrieved 2026-07-08).
GeoRank.org/facts/haiti/kiribati | CC BY
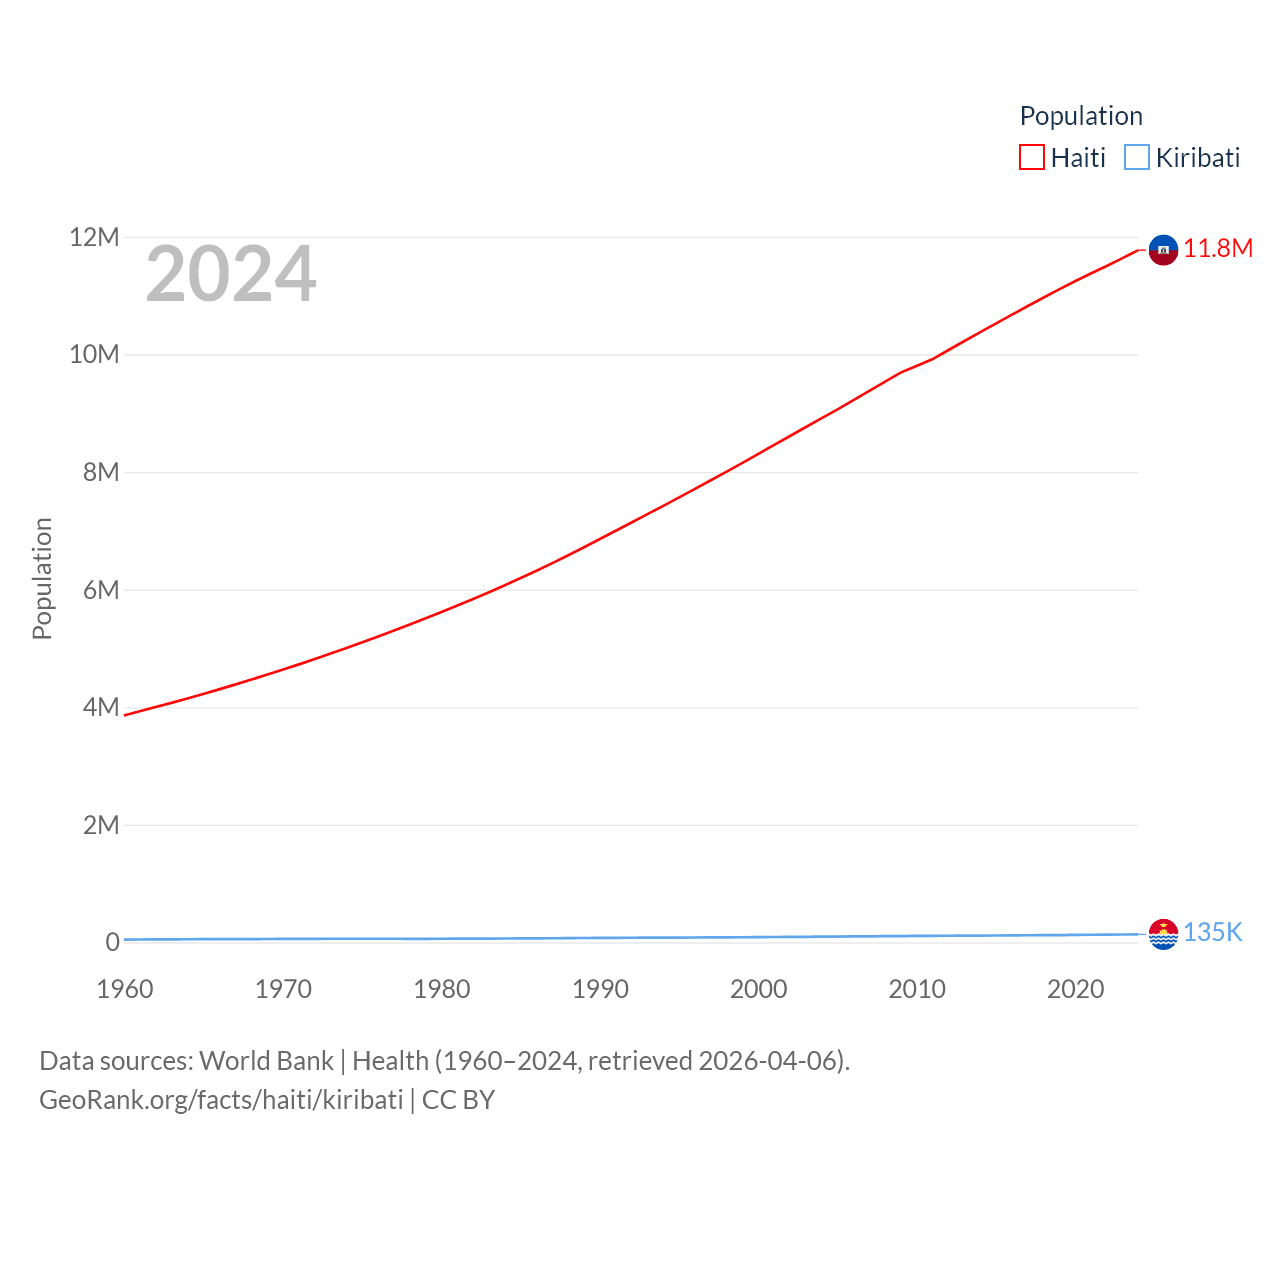
Haiti and Kiribati population clocks and comparison
| Year | Population | |
|---|---|---|
|
Haiti
|
Kiribati
|
|
| 2025 | 11,906,095 | 136,488 |
| 2024 | 11,772,557 | 134,518 |
| 2023 | 11,637,398 | 132,530 |
| 2022 | 11,503,606 | 130,469 |
| 2021 | 11,374,586 | 128,377 |
| 2020 | 11,243,848 | 126,099 |
| 2019 | 11,105,163 | 123,921 |
| 2018 | 10,962,362 | 122,084 |
| 2017 | 10,817,754 | 120,275 |
| 2016 | 10,671,457 | 118,478 |
| 2015 | 10,523,242 | 116,815 |
| 2014 | 10,373,235 | 115,326 |
| 2013 | 10,222,362 | 113,838 |
| 2012 | 10,069,771 | 112,284 |
| 2011 | 9,914,904 | 110,647 |
| 2010 | 9,803,294 | 108,704 |
| 2009 | 9,689,581 | 106,467 |
| 2008 | 9,530,774 | 104,222 |
| 2007 | 9,373,296 | 102,068 |
| 2006 | 9,216,562 | 100,017 |
| 2005 | 9,061,273 | 98,035 |
| 2004 | 8,910,263 | 96,085 |
| 2003 | 8,759,912 | 94,175 |
| 2002 | 8,607,641 | 92,264 |
| 2001 | 8,455,918 | 90,335 |
| 2000 | 8,303,151 | 88,613 |
| 1999 | 8,151,296 | 87,126 |
| 1998 | 8,002,143 | 85,657 |
| 1997 | 7,854,298 | 84,147 |
| 1996 | 7,707,557 | 82,623 |
| 1995 | 7,562,546 | 81,234 |
| 1994 | 7,419,771 | 80,021 |
| 1993 | 7,278,181 | 78,841 |
| 1992 | 7,136,571 | 77,641 |
| 1991 | 6,995,450 | 76,367 |
| 1990 | 6,854,441 | 74,855 |
| 1989 | 6,714,730 | 73,147 |
| 1988 | 6,578,145 | 71,427 |
| 1987 | 6,445,123 | 69,733 |
| 1986 | 6,316,122 | 68,059 |
| 1985 | 6,190,862 | 66,496 |
| 1984 | 6,069,230 | 65,228 |
| 1983 | 5,951,096 | 64,169 |
| 1982 | 5,835,937 | 63,134 |
| 1981 | 5,723,725 | 62,121 |
| 1980 | 5,614,493 | 61,148 |
| 1979 | 5,507,590 | 60,172 |
| 1978 | 5,402,580 | 59,864 |
| 1977 | 5,299,476 | 60,267 |
| 1976 | 5,198,357 | 60,661 |
| 1975 | 5,099,086 | 60,987 |
| 1974 | 5,001,796 | 61,219 |
| 1973 | 4,906,743 | 60,824 |
| 1972 | 4,813,868 | 59,778 |
| 1971 | 4,723,244 | 58,652 |
| 1970 | 4,635,124 | 57,510 |
| 1969 | 4,549,334 | 56,360 |
| 1968 | 4,465,328 | 55,529 |
| 1967 | 4,382,999 | 54,996 |
| 1966 | 4,302,639 | 54,425 |
| 1965 | 4,223,820 | 53,439 |
| 1964 | 4,146,244 | 52,088 |
| 1963 | 4,073,068 | 50,791 |
| 1962 | 4,001,575 | 49,538 |
| 1961 | 3,929,030 | 48,323 |
| 1960 | 3,858,443 | 47,157 |
Data sources: World Bank | Health (1960–2025, retrieved 2026-07-08).
GeoRank.org/facts/haiti/kiribati | CC BY
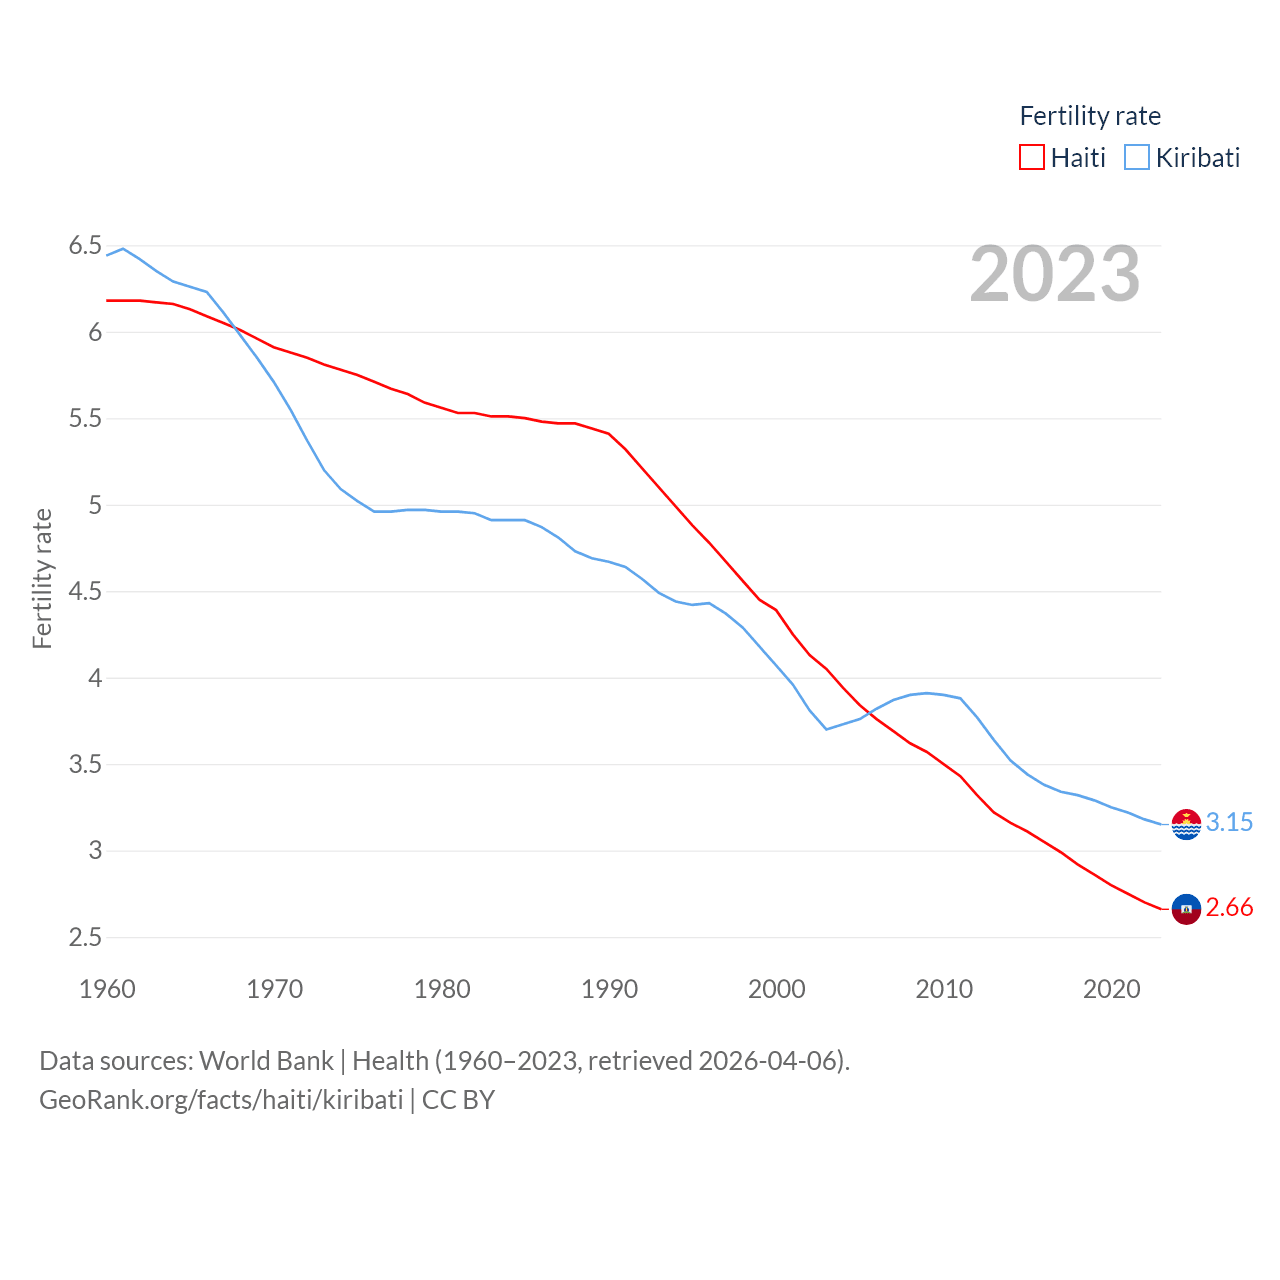
Fertility rates in Haiti and Kiribati
| Year | Fertility rate | |
|---|---|---|
|
Haiti
|
Kiribati
|
|
| 2024 | 2.63 | 3.12 |
| 2023 | 2.66 | 3.15 |
| 2022 | 2.7 | 3.18 |
| 2021 | 2.75 | 3.22 |
| 2020 | 2.8 | 3.25 |
| 2019 | 2.86 | 3.29 |
| 2018 | 2.92 | 3.32 |
| 2017 | 2.99 | 3.34 |
| 2016 | 3.05 | 3.38 |
| 2015 | 3.11 | 3.44 |
| 2014 | 3.16 | 3.52 |
| 2013 | 3.22 | 3.64 |
| 2012 | 3.32 | 3.77 |
| 2011 | 3.43 | 3.88 |
| 2010 | 3.5 | 3.9 |
| 2009 | 3.57 | 3.91 |
| 2008 | 3.62 | 3.9 |
| 2007 | 3.69 | 3.87 |
| 2006 | 3.76 | 3.82 |
| 2005 | 3.84 | 3.76 |
| 2004 | 3.94 | 3.73 |
| 2003 | 4.05 | 3.7 |
| 2002 | 4.13 | 3.81 |
| 2001 | 4.25 | 3.96 |
| 2000 | 4.39 | 4.07 |
| 1999 | 4.45 | 4.18 |
| 1998 | 4.56 | 4.29 |
| 1997 | 4.67 | 4.37 |
| 1996 | 4.78 | 4.43 |
| 1995 | 4.88 | 4.42 |
| 1994 | 4.99 | 4.44 |
| 1993 | 5.1 | 4.49 |
| 1992 | 5.21 | 4.57 |
| 1991 | 5.32 | 4.64 |
| 1990 | 5.41 | 4.67 |
| 1989 | 5.44 | 4.69 |
| 1988 | 5.47 | 4.73 |
| 1987 | 5.47 | 4.81 |
| 1986 | 5.48 | 4.87 |
| 1985 | 5.5 | 4.91 |
| 1984 | 5.51 | 4.91 |
| 1983 | 5.51 | 4.91 |
| 1982 | 5.53 | 4.95 |
| 1981 | 5.53 | 4.96 |
| 1980 | 5.56 | 4.96 |
| 1979 | 5.59 | 4.97 |
| 1978 | 5.64 | 4.97 |
| 1977 | 5.67 | 4.96 |
| 1976 | 5.71 | 4.96 |
| 1975 | 5.75 | 5.02 |
| 1974 | 5.78 | 5.09 |
| 1973 | 5.81 | 5.2 |
| 1972 | 5.85 | 5.37 |
| 1971 | 5.88 | 5.55 |
| 1970 | 5.91 | 5.71 |
| 1969 | 5.96 | 5.85 |
| 1968 | 6.01 | 5.98 |
| 1967 | 6.05 | 6.11 |
| 1966 | 6.09 | 6.23 |
| 1965 | 6.13 | 6.26 |
| 1964 | 6.16 | 6.29 |
| 1963 | 6.17 | 6.35 |
| 1962 | 6.18 | 6.42 |
| 1961 | 6.18 | 6.48 |
| 1960 | 6.18 | 6.44 |
Data sources: World Bank | Health (1960–2024, retrieved 2026-07-08).
GeoRank.org/facts/haiti/kiribati | CC BY
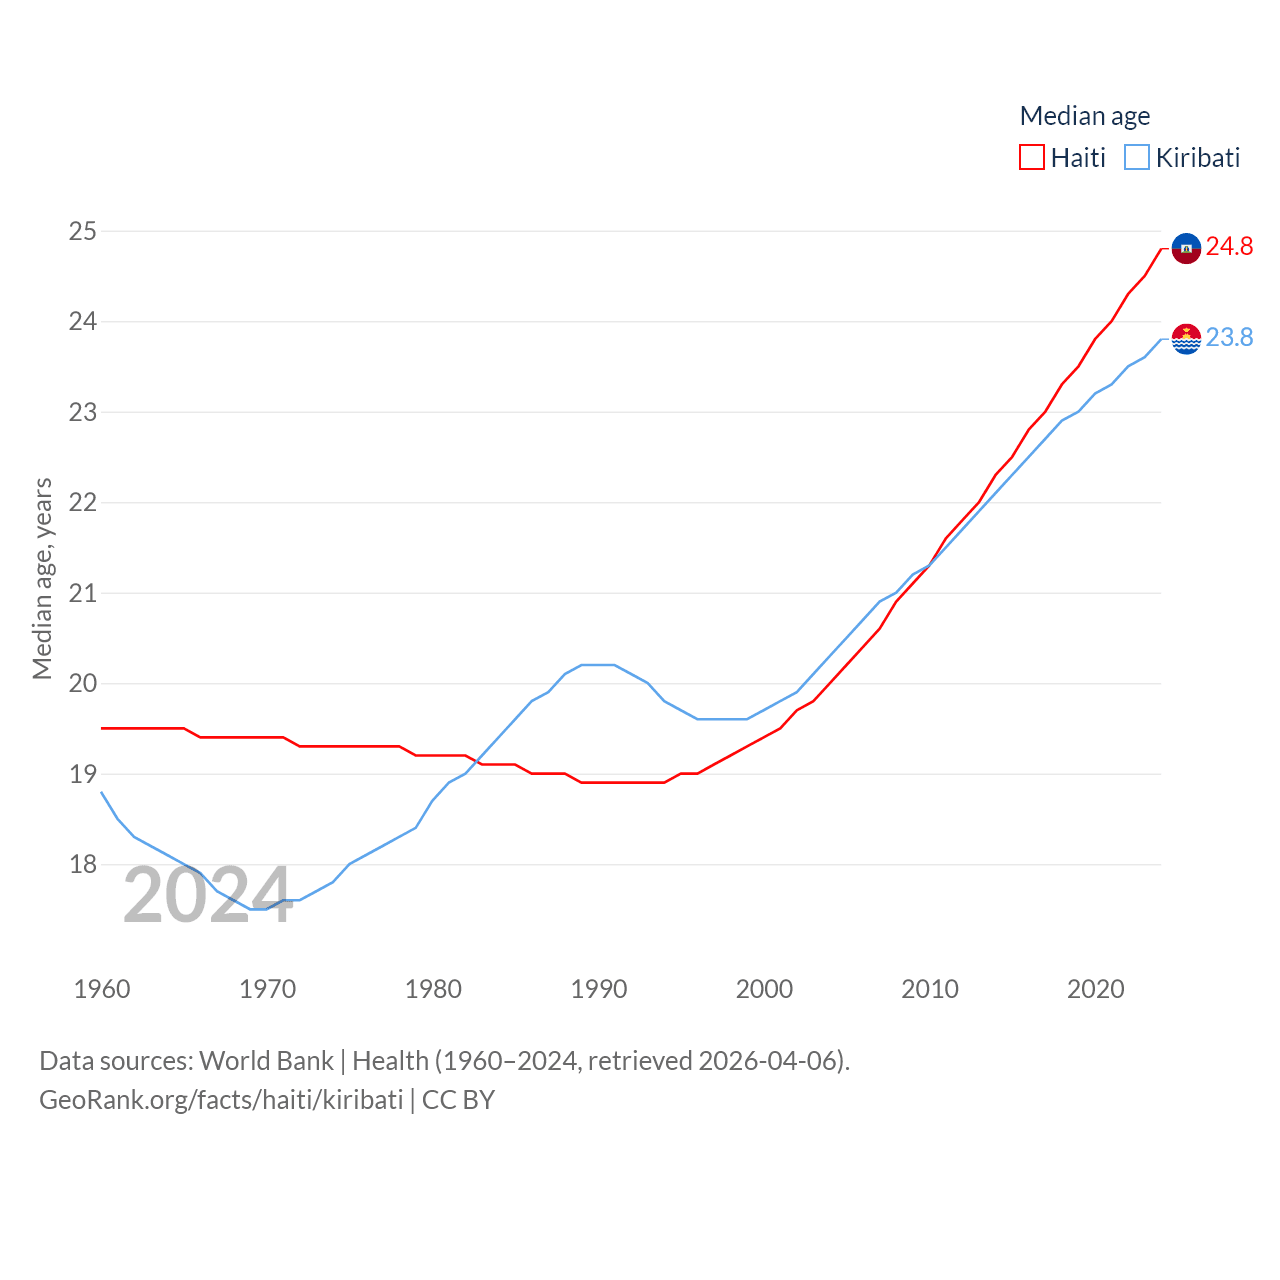
Haiti and Kiribati demographics compared
| Year | Median age, years | |
|---|---|---|
|
Haiti
|
Kiribati
|
|
| 2025 | 25.1 | 23.9 |
| 2024 | 24.8 | 23.8 |
| 2023 | 24.5 | 23.6 |
| 2022 | 24.3 | 23.5 |
| 2021 | 24 | 23.3 |
| 2020 | 23.8 | 23.2 |
| 2019 | 23.5 | 23 |
| 2018 | 23.3 | 22.9 |
| 2017 | 23 | 22.7 |
| 2016 | 22.8 | 22.5 |
| 2015 | 22.5 | 22.3 |
| 2014 | 22.3 | 22.1 |
| 2013 | 22 | 21.9 |
| 2012 | 21.8 | 21.7 |
| 2011 | 21.6 | 21.5 |
| 2010 | 21.3 | 21.3 |
| 2009 | 21.1 | 21.2 |
| 2008 | 20.9 | 21 |
| 2007 | 20.6 | 20.9 |
| 2006 | 20.4 | 20.7 |
| 2005 | 20.2 | 20.5 |
| 2004 | 20 | 20.3 |
| 2003 | 19.8 | 20.1 |
| 2002 | 19.7 | 19.9 |
| 2001 | 19.5 | 19.8 |
| 2000 | 19.4 | 19.7 |
| 1999 | 19.3 | 19.6 |
| 1998 | 19.2 | 19.6 |
| 1997 | 19.1 | 19.6 |
| 1996 | 19 | 19.6 |
| 1995 | 19 | 19.7 |
| 1994 | 18.9 | 19.8 |
| 1993 | 18.9 | 20 |
| 1992 | 18.9 | 20.1 |
| 1991 | 18.9 | 20.2 |
| 1990 | 18.9 | 20.2 |
| 1989 | 18.9 | 20.2 |
| 1988 | 19 | 20.1 |
| 1987 | 19 | 19.9 |
| 1986 | 19 | 19.8 |
| 1985 | 19.1 | 19.6 |
| 1984 | 19.1 | 19.4 |
| 1983 | 19.1 | 19.2 |
| 1982 | 19.2 | 19 |
| 1981 | 19.2 | 18.9 |
| 1980 | 19.2 | 18.7 |
| 1979 | 19.2 | 18.4 |
| 1978 | 19.3 | 18.3 |
| 1977 | 19.3 | 18.2 |
| 1976 | 19.3 | 18.1 |
| 1975 | 19.3 | 18 |
| 1974 | 19.3 | 17.8 |
| 1973 | 19.3 | 17.7 |
| 1972 | 19.3 | 17.6 |
| 1971 | 19.4 | 17.6 |
| 1970 | 19.4 | 17.5 |
| 1969 | 19.4 | 17.5 |
| 1968 | 19.4 | 17.6 |
| 1967 | 19.4 | 17.7 |
| 1966 | 19.4 | 17.9 |
| 1965 | 19.5 | 18 |
| 1964 | 19.5 | 18.1 |
| 1963 | 19.5 | 18.2 |
| 1962 | 19.5 | 18.3 |
| 1961 | 19.5 | 18.5 |
| 1960 | 19.5 | 18.8 |
Data sources: World Bank | Health (1960–2025, retrieved 2026-07-08).
GeoRank.org/facts/haiti/kiribati | CC BY
Interactive Maps
Use the buttons below to switch between world maps comparing statistics for Haiti and Kiribati.
National statistics comparison
Finance
|
Haiti
|
Kiribati
|
|
|---|---|---|
| GNI, Atlas method |
$23.9B
2025 |
$537M
2025 |
| Government expenditure, % of GDP |
6.19%
2025 |
88.2%
2025 |
| Education expenditure, % of GDP |
0.96%
2023 |
16.4%
2023 |
| Military expenditure, % of GDP |
0.07%
2024 |
n/a |
| Armed forces personnel |
1,000
2020 |
n/a |
| Deficit/surplus, % of GDP |
-0.22%
2025 |
-14.5%
2025 |
| Unemployment rate |
14.1%
2012 |
2.79%
2023 |
| Services, % of GDP |
54.2%
2025 |
70.3%
2024 |
| Industry, % of GDP |
27.5%
2025 |
11.8%
2024 |
| Economic freedom index |
46.1
2026 |
50.8
2026 |
| Income share by richest 10% |
31.2%
2012 |
20.9%
2023 |
| Income share by poorest 10% |
2.1%
2012 |
4.4%
2023 |
| Total reserves including gold |
$3.39B
2025 |
n/a |
| Personal remittances received |
$4.11B
2024 |
$14.7M
2024 |
| International tourist arrivals |
938,000
2019 |
12,000
2019 |
| International tourism as share of exports |
34.8%
2018 |
17.6%
2017 |
| Banked people share |
32.6%
2017 |
n/a |
Energy
|
Haiti
|
Kiribati
|
|
|---|---|---|
| Energy use, kg of oil equivalent per capita |
324 kg
2023 |
107.8 kg
2007 |
| GDP PPP per kg equivalent of energy use |
$10.2
2023 |
$16.6
2007 |
| Carbon dioxide (CO2) emissions |
3.51 megatons
2024 |
0.08 megatons
2024 |
| CO2 emissions per capita |
0.3 tons
2024 |
0.59 tons
2024 |
| Fossil fuel energy use share |
21.7%
2022 |
0%
2007 |
| Renewable energy use share |
76.7%
2021 |
41.9%
2022 |
| Alternative and nuclear energy use share |
0.38%
2023 |
n/a |
| Electric power consumption per capita |
76.2 kWh
2022 |
n/a |
| Renewable electricity output share |
20.5%
2021 |
16.4%
2021 |
| Hydroelectric share |
17.9%
2022 |
0%
2021 |
| Nuclear share |
0%
2021 |
0%
2021 |
| Electricity access |
51.3%
2023 |
95.9%
2023 |
Society
|
Haiti
|
Kiribati
|
|
|---|---|---|
| % of world population |
0.15%
2025 |
0.002%
2025 |
| Annual migration change |
-32,052
2025 |
-462
2025 |
| Urban population |
55.6%
2025 |
63.4%
2025 |
| Male:Female ratio |
49.5:50.5
2025 |
48.6:51.4
2025 |
| Average male height |
5.72 ft
2026 |
5.6 ft
2026 |
| Average female height |
5.2 ft
2026 |
5.2 ft
2026 |
| Quality of life index |
16.7
2026 |
33.2
2026 |
| Corruption Perceptions Index |
16
2025 |
40
2026 |
| Higher education index |
6
2026 |
n/a |
| Homicides per 100K people |
41.2
2023 |
7.13
2012 |
| Road traffic mortality per 100K people |
18.8
2019 |
1.9
2019 |
| Visa free countries |
60
2026 |
128
2026 |
| Adult literacy rate |
68%
2017 |
98.6%
2020 |
| English speaking |
1%
2026 |
72.9%
2026 |
| People using the Internet |
47.9%
2024 |
89.4%
2024 |
Health
|
Haiti
|
Kiribati
|
|
|---|---|---|
| Government health expenditure per capita |
$54.4
2023 |
$238.1
2023 |
| Out-of-pocket health expenditure per capita |
$28.5
2023 |
$6.93
2023 |
| Life expectancy |
65.5 years
2026 |
66.9 years
2026 |
| Foreign aid share of health expenditure |
31.6%
2023 |
9.25%
2023 |
| Physicians per 1,000 people |
0.29
2022 |
0.19
2013 |
| Age at first childbirth |
22.4 years
2025 |
23.1 years
2025 |
| Maternal mortality per 100K births |
328
2023 |
80
2023 |
| Mortality rate before reaching 5 years of age |
52.8
2024 |
53.1
2024 |
| Obesity rate |
11.1%
2022 |
46.9%
2022 |
| Diabetes prevalence |
8.5%
2024 |
24.6%
2024 |
| Air quality index |
94
2026 |
95
2026 |
| Tobacco use prevalence |
8%
2024 |
37.7%
2024 |
| Pure alcohol consumption per capita |
3.11 liters
2020 |
0.72 liters
2020 |
Territory
In-depth comparisons
Help us show the world through your eyes
Share a photo of your city and help others discover what it looks like to live there. Your contribution makes our data come alive.
Data sources:
- World Bank | Health (1960–2025, retrieved 2026-07-08)
- United Nations | World Population Prospects (1950–2026, retrieved 2026-07-08)
- U.S. Census Bureau (1960–2025, retrieved 2026-07-08)
- Central Intelligence Agency (CIA) (2000–2025, retrieved 2026-07-08)
- International Monetary Fund (IMF) | Fiscal Monitor (2025, retrieved 2026-07-08)
- LivingCost (2026, retrieved 2026-07-08)
- World Obesity Federation (2022, retrieved 2026-07-08)
- The Heritage Foundation | Economic Freedom Index (2026, retrieved 2026-07-08)
- Passport Index (2026, retrieved 2026-07-08)
- Transparency International (2025, retrieved 2026-07-08)
- EduRank (2026, retrieved 2026-07-08)
Creative Commons Attribution (CC BY) — you’re free to copy, share, remix, adapt, and use even commercially as long as you give appropriate credit and clearly indicate if you made changes. Other sources may be subject to different license terms.