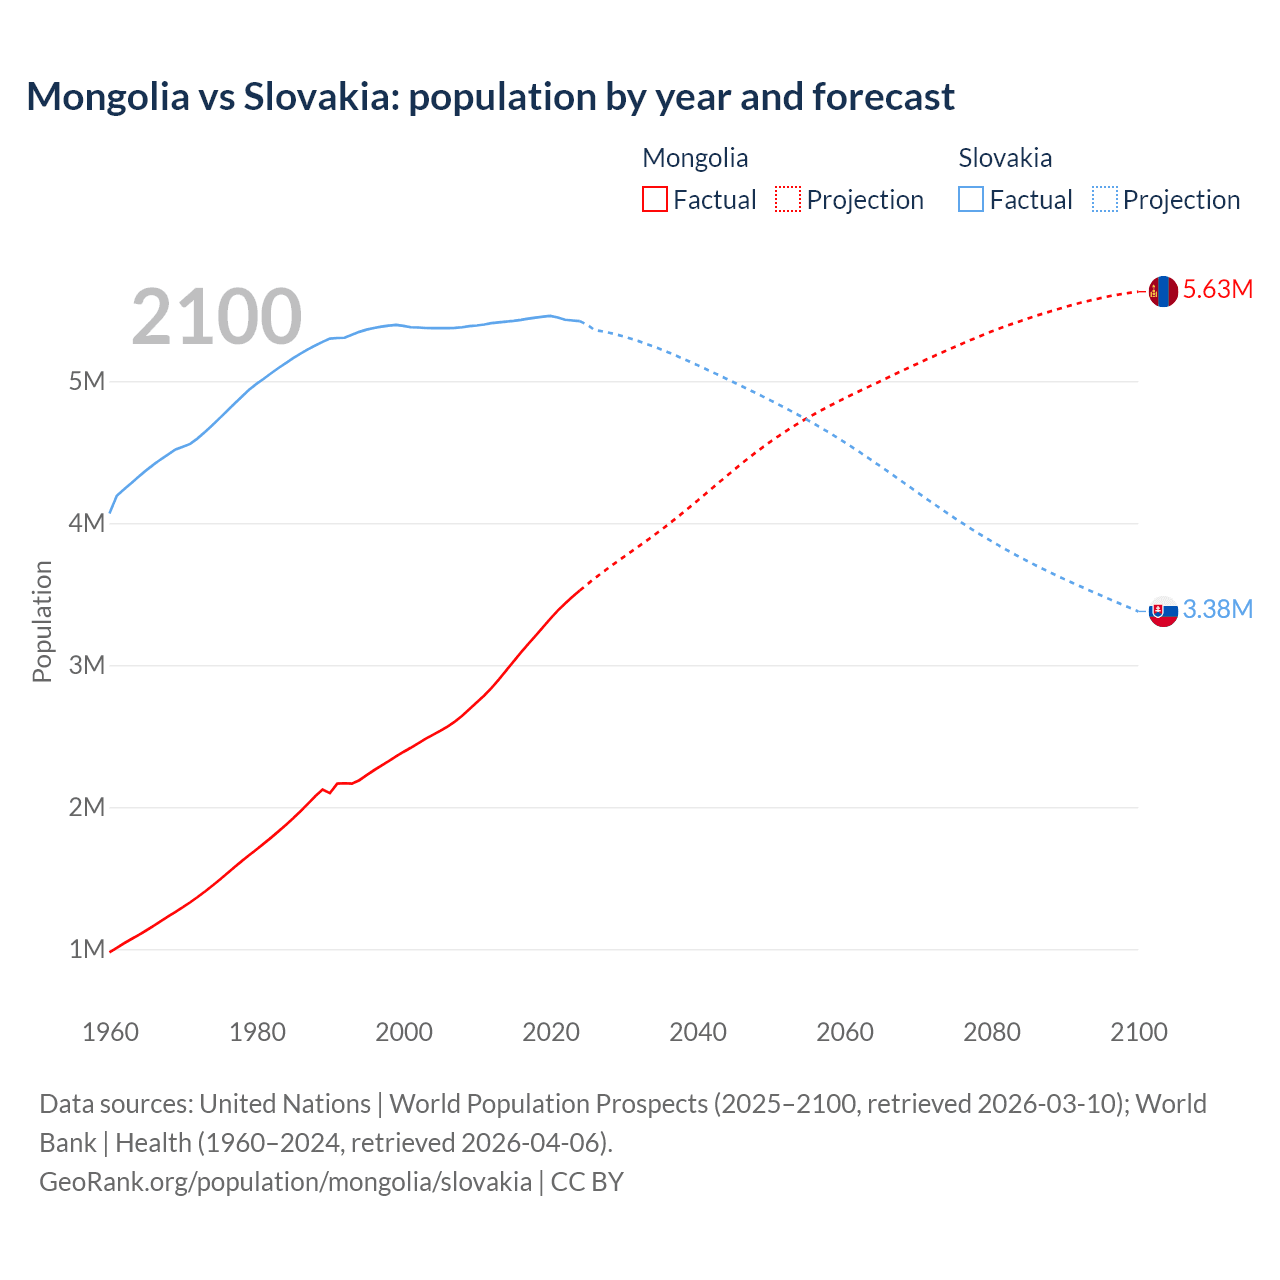
The latest officially reported population of Mongolia was 3,568,978 in 2025 vs 5,413,813 people in Slovakia in 2025. In 2026, based on the adjusted UN estimation, the current Mongolia's population is 3,630,744 people compared to 5,376,239 in Slovakia.
Population statistics:
- Slovakia's population is 1.48 times bigger than Mongolia's.
- Mongolia is ranked the 132nd most populous country in the world, while Slovakia is the 125th.
- The countries together account for 0.11% of the world: 0.04% for Mongolia vs 0.06% for Slovakia.
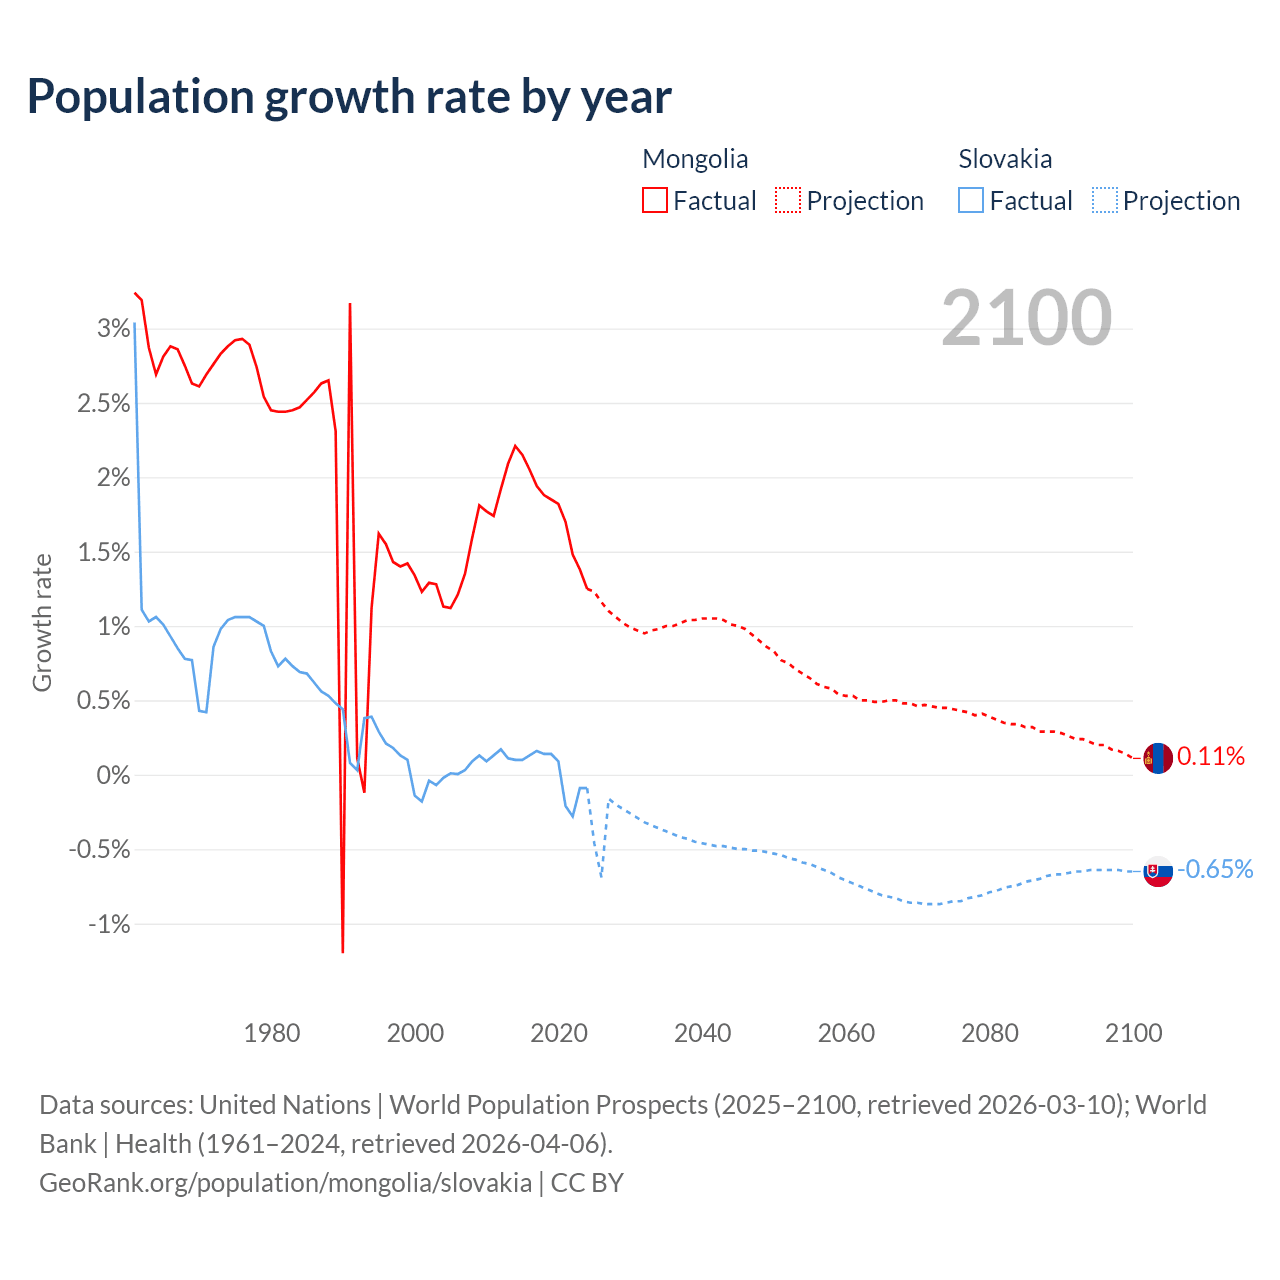
- For the last 10 years, Mongolia has had an average growth rate of +1.71% per year vs -0.008% in Slovakia.
- Since 2006, the population of Mongolia has increased from 2.57M people to 3.63M (41.4% growth), while Slovakia has grown from 5.37M to 5.38M (0.06% growth).
Mongolia vs Slovakia: population by year and forecast
| Year | Population | |
|---|---|---|
 Mongolia
|
 Slovakia
|
|
| 2100 | 5,630,532 | 3,388,353 |
| 2099 | 5,624,298 | 3,410,527 |
| 2098 | 5,616,442 | 3,432,738 |
| 2097 | 5,607,739 | 3,454,958 |
| 2096 | 5,598,366 | 3,477,150 |
| 2095 | 5,587,141 | 3,499,531 |
| 2094 | 5,575,743 | 3,522,068 |
| 2093 | 5,563,600 | 3,544,820 |
| 2092 | 5,550,506 | 3,567,858 |
| 2091 | 5,537,031 | 3,591,243 |
| 2090 | 5,522,419 | 3,614,972 |
| 2089 | 5,507,083 | 3,639,184 |
| 2088 | 5,491,226 | 3,663,803 |
| 2087 | 5,475,425 | 3,688,979 |
| 2086 | 5,459,661 | 3,714,826 |
| 2085 | 5,442,388 | 3,741,361 |
| 2084 | 5,424,928 | 3,768,554 |
| 2083 | 5,406,747 | 3,796,482 |
| 2082 | 5,388,623 | 3,825,124 |
| 2081 | 5,369,593 | 3,854,574 |
| 2080 | 5,349,817 | 3,884,854 |
| 2079 | 5,329,240 | 3,915,890 |
| 2078 | 5,307,283 | 3,947,687 |
| 2077 | 5,286,383 | 3,980,420 |
| 2076 | 5,264,220 | 4,013,906 |
| 2075 | 5,241,700 | 4,048,115 |
| 2074 | 5,218,897 | 4,082,918 |
| 2073 | 5,195,622 | 4,118,344 |
| 2072 | 5,172,532 | 4,154,378 |
| 2071 | 5,149,066 | 4,190,678 |
| 2070 | 5,124,853 | 4,227,297 |
| 2069 | 5,101,195 | 4,264,100 |
| 2068 | 5,077,035 | 4,301,007 |
| 2067 | 5,052,818 | 4,337,728 |
| 2066 | 5,027,552 | 4,374,132 |
| 2065 | 5,002,655 | 4,410,344 |
| 2064 | 4,978,185 | 4,446,244 |
| 2063 | 4,953,806 | 4,481,639 |
| 2062 | 4,929,364 | 4,516,504 |
| 2061 | 4,904,690 | 4,550,644 |
| 2060 | 4,878,877 | 4,584,186 |
| 2059 | 4,852,963 | 4,616,990 |
| 2058 | 4,826,761 | 4,649,013 |
| 2057 | 4,799,120 | 4,680,116 |
| 2056 | 4,771,151 | 4,710,464 |
| 2055 | 4,742,184 | 4,739,960 |
| 2054 | 4,711,735 | 4,768,542 |
| 2053 | 4,679,745 | 4,796,670 |
| 2052 | 4,646,658 | 4,824,228 |
| 2051 | 4,612,090 | 4,851,216 |
| 2050 | 4,576,701 | 4,877,755 |
| 2049 | 4,539,215 | 4,903,974 |
| 2048 | 4,500,638 | 4,929,712 |
| 2047 | 4,460,511 | 4,955,205 |
| 2046 | 4,419,188 | 4,980,481 |
| 2045 | 4,376,222 | 5,005,547 |
| 2044 | 4,333,010 | 5,030,570 |
| 2043 | 4,289,776 | 5,055,426 |
| 2042 | 4,245,757 | 5,079,926 |
| 2041 | 4,201,838 | 5,104,270 |
| 2040 | 4,158,320 | 5,128,291 |
| 2039 | 4,115,023 | 5,151,796 |
| 2038 | 4,072,646 | 5,174,897 |
| 2037 | 4,030,644 | 5,197,430 |
| 2036 | 3,989,867 | 5,219,344 |
| 2035 | 3,950,239 | 5,240,519 |
| 2034 | 3,911,316 | 5,260,607 |
| 2033 | 3,873,353 | 5,279,808 |
| 2032 | 3,836,311 | 5,297,883 |
| 2031 | 3,800,027 | 5,314,815 |
| 2030 | 3,763,374 | 5,330,403 |
| 2029 | 3,726,490 | 5,344,463 |
| 2028 | 3,688,767 | 5,356,733 |
| 2027 | 3,650,012 | 5,367,421 |
| 2026 | 3,610,395 | 5,376,239 |
| 2025 | 3,568,978 | 5,413,813 |
| 2024 | 3,524,788 | 5,422,069 |
| 2023 | 3,481,145 | 5,426,740 |
| 2022 | 3,433,748 | 5,431,752 |
| 2021 | 3,383,741 | 5,447,247 |
| 2020 | 3,327,204 | 5,458,827 |
| 2019 | 3,267,673 | 5,454,147 |
| 2018 | 3,208,189 | 5,446,771 |
| 2017 | 3,148,917 | 5,439,232 |
| 2016 | 3,088,856 | 5,430,798 |
| 2015 | 3,026,864 | 5,423,801 |
| 2014 | 2,963,113 | 5,418,649 |
| 2013 | 2,899,011 | 5,413,393 |
| 2012 | 2,839,705 | 5,407,579 |
| 2011 | 2,786,317 | 5,398,384 |
| 2010 | 2,738,622 | 5,391,428 |
| 2009 | 2,691,115 | 5,386,406 |
| 2008 | 2,643,201 | 5,379,233 |
| 2007 | 2,601,850 | 5,374,622 |
| 2006 | 2,567,168 | 5,373,054 |
| 2005 | 2,536,407 | 5,372,807 |
| 2004 | 2,508,412 | 5,372,280 |
| 2003 | 2,480,374 | 5,373,374 |
| 2002 | 2,449,027 | 5,376,912 |
| 2001 | 2,417,751 | 5,378,867 |
| 2000 | 2,388,299 | 5,388,720 |
| 1999 | 2,356,813 | 5,396,020 |
| 1998 | 2,323,809 | 5,390,516 |
| 1997 | 2,291,750 | 5,383,291 |
| 1996 | 2,259,507 | 5,373,361 |
| 1995 | 2,224,945 | 5,361,999 |
| 1994 | 2,189,395 | 5,346,331 |
| 1993 | 2,165,130 | 5,325,305 |
| 1992 | 2,167,790 | 5,305,016 |
| 1991 | 2,165,342 | 5,303,294 |
| 1990 | 2,098,710 | 5,299,187 |
| 1989 | 2,124,185 | 5,275,942 |
| 1988 | 2,076,322 | 5,250,596 |
| 1987 | 2,022,800 | 5,222,840 |
| 1986 | 1,970,965 | 5,193,838 |
| 1985 | 1,921,514 | 5,161,768 |
| 1984 | 1,874,349 | 5,127,097 |
| 1983 | 1,829,092 | 5,091,971 |
| 1982 | 1,785,364 | 5,055,099 |
| 1981 | 1,742,857 | 5,016,105 |
| 1980 | 1,701,335 | 4,979,815 |
| 1979 | 1,660,659 | 4,938,973 |
| 1978 | 1,619,468 | 4,890,125 |
| 1977 | 1,576,245 | 4,840,501 |
| 1976 | 1,531,945 | 4,789,507 |
| 1975 | 1,488,296 | 4,739,105 |
| 1974 | 1,446,050 | 4,689,623 |
| 1973 | 1,405,502 | 4,641,445 |
| 1972 | 1,366,821 | 4,596,622 |
| 1971 | 1,330,071 | 4,557,449 |
| 1970 | 1,295,272 | 4,538,223 |
| 1969 | 1,262,284 | 4,518,607 |
| 1968 | 1,229,930 | 4,483,915 |
| 1967 | 1,196,996 | 4,449,367 |
| 1966 | 1,163,754 | 4,411,666 |
| 1965 | 1,131,177 | 4,370,983 |
| 1964 | 1,100,234 | 4,327,341 |
| 1963 | 1,071,362 | 4,282,017 |
| 1962 | 1,041,444 | 4,238,188 |
| 1961 | 1,009,284 | 4,191,667 |
| 1960 | 977,595 | 4,068,095 |
Data sources: United Nations | World Population Prospects (2026–2100, retrieved 2026-07-08); World Bank | Health (1960–2025, retrieved 2026-07-08).
GeoRank.org/population/mongolia/slovakia | CC BY 
From 2006 to 2016, the population of Mongolia increased by 521,688 people (a 20.3% growth), while Slovakia gained 57,744 people (a 1.07% growth).
For the next 10 years, from 2016 to 2026, Mongolia gained 541,888 people (a 17.5% growth), while Slovakia's population decreased by 54,559 people (a 1% decline).
Mongolia was ranked 137th most populous country in 2006 and is 132nd in 2026. Slovakia was ranked 110th in 2006 and ranked 125th now.
The UN's World Population Prospects forecasts that in 24 years (in 2050) Mongolia's population will grow by 26.1% to 4,576,701 people with a rank change from 132nd to 130th. The population of Slovakia will decrease by 9.27% to 4,877,755 people and rank change from 125th to 129th.
Mongolia is projected to reach its peak in 2100 at 5.63M people, while Slovakia's population already peaked in 2020 at 5.46M people and is projected to decrease to 3.39M people by 2100.
Population growth rate by year
| Year | Growth rate | |
|---|---|---|
|
Mongolia
|
Slovakia
|
|
| 2100 | 0.11% | -0.65% |
| 2099 | 0.14% | -0.65% |
| 2098 | 0.16% | -0.64% |
| 2097 | 0.17% | -0.64% |
| 2096 | 0.2% | -0.64% |
| 2095 | 0.2% | -0.64% |
| 2094 | 0.22% | -0.64% |
| 2093 | 0.24% | -0.65% |
| 2092 | 0.24% | -0.65% |
| 2091 | 0.26% | -0.66% |
| 2090 | 0.28% | -0.67% |
| 2089 | 0.29% | -0.67% |
| 2088 | 0.29% | -0.68% |
| 2087 | 0.29% | -0.7% |
| 2086 | 0.32% | -0.71% |
| 2085 | 0.32% | -0.72% |
| 2084 | 0.34% | -0.74% |
| 2083 | 0.34% | -0.75% |
| 2082 | 0.35% | -0.76% |
| 2081 | 0.37% | -0.78% |
| 2080 | 0.39% | -0.79% |
| 2079 | 0.41% | -0.81% |
| 2078 | 0.4% | -0.82% |
| 2077 | 0.42% | -0.83% |
| 2076 | 0.43% | -0.85% |
| 2075 | 0.44% | -0.85% |
| 2074 | 0.45% | -0.86% |
| 2073 | 0.45% | -0.87% |
| 2072 | 0.46% | -0.87% |
| 2071 | 0.47% | -0.87% |
| 2070 | 0.46% | -0.86% |
| 2069 | 0.48% | -0.86% |
| 2068 | 0.48% | -0.85% |
| 2067 | 0.5% | -0.83% |
| 2066 | 0.5% | -0.82% |
| 2065 | 0.49% | -0.81% |
| 2064 | 0.49% | -0.79% |
| 2063 | 0.5% | -0.77% |
| 2062 | 0.5% | -0.75% |
| 2061 | 0.53% | -0.73% |
| 2060 | 0.53% | -0.71% |
| 2059 | 0.54% | -0.69% |
| 2058 | 0.58% | -0.66% |
| 2057 | 0.59% | -0.64% |
| 2056 | 0.61% | -0.62% |
| 2055 | 0.65% | -0.6% |
| 2054 | 0.68% | -0.59% |
| 2053 | 0.71% | -0.57% |
| 2052 | 0.75% | -0.56% |
| 2051 | 0.77% | -0.54% |
| 2050 | 0.83% | -0.53% |
| 2049 | 0.86% | -0.52% |
| 2048 | 0.9% | -0.51% |
| 2047 | 0.94% | -0.51% |
| 2046 | 0.98% | -0.5% |
| 2045 | 1% | -0.5% |
| 2044 | 1.01% | -0.49% |
| 2043 | 1.04% | -0.48% |
| 2042 | 1.05% | -0.48% |
| 2041 | 1.05% | -0.47% |
| 2040 | 1.05% | -0.46% |
| 2039 | 1.04% | -0.45% |
| 2038 | 1.04% | -0.43% |
| 2037 | 1.02% | -0.42% |
| 2036 | 1% | -0.4% |
| 2035 | 1% | -0.38% |
| 2034 | 0.98% | -0.36% |
| 2033 | 0.97% | -0.34% |
| 2032 | 0.95% | -0.32% |
| 2031 | 0.97% | -0.29% |
| 2030 | 0.99% | -0.26% |
| 2029 | 1.02% | -0.23% |
| 2028 | 1.06% | -0.2% |
| 2027 | 1.1% | -0.16% |
| 2026 | 1.16% | -0.69% |
| 2025 | 1.25% | -0.15% |
| 2024 | 1.25% | -0.09% |
| 2023 | 1.38% | -0.09% |
| 2022 | 1.48% | -0.28% |
| 2021 | 1.7% | -0.21% |
| 2020 | 1.82% | 0.09% |
| 2019 | 1.85% | 0.14% |
| 2018 | 1.88% | 0.14% |
| 2017 | 1.94% | 0.16% |
| 2016 | 2.05% | 0.13% |
| 2015 | 2.15% | 0.1% |
| 2014 | 2.21% | 0.1% |
| 2013 | 2.09% | 0.11% |
| 2012 | 1.92% | 0.17% |
| 2011 | 1.74% | 0.13% |
| 2010 | 1.77% | 0.09% |
| 2009 | 1.81% | 0.13% |
| 2008 | 1.59% | 0.09% |
| 2007 | 1.35% | 0.03% |
| 2006 | 1.21% | 0.005% |
| 2005 | 1.12% | 0.01% |
| 2004 | 1.13% | -0.02% |
| 2003 | 1.28% | -0.07% |
| 2002 | 1.29% | -0.04% |
| 2001 | 1.23% | -0.18% |
| 2000 | 1.34% | -0.14% |
| 1999 | 1.42% | 0.1% |
| 1998 | 1.4% | 0.13% |
| 1997 | 1.43% | 0.18% |
| 1996 | 1.55% | 0.21% |
| 1995 | 1.62% | 0.29% |
| 1994 | 1.12% | 0.39% |
| 1993 | -0.12% | 0.38% |
| 1992 | 0.11% | 0.03% |
| 1991 | 3.17% | 0.08% |
| 1990 | -1.2% | 0.44% |
| 1989 | 2.31% | 0.48% |
| 1988 | 2.65% | 0.53% |
| 1987 | 2.63% | 0.56% |
| 1986 | 2.57% | 0.62% |
| 1985 | 2.52% | 0.68% |
| 1984 | 2.47% | 0.69% |
| 1983 | 2.45% | 0.73% |
| 1982 | 2.44% | 0.78% |
| 1981 | 2.44% | 0.73% |
| 1980 | 2.45% | 0.83% |
| 1979 | 2.54% | 1% |
| 1978 | 2.74% | 1.03% |
| 1977 | 2.89% | 1.06% |
| 1976 | 2.93% | 1.06% |
| 1975 | 2.92% | 1.06% |
| 1974 | 2.88% | 1.04% |
| 1973 | 2.83% | 0.98% |
| 1972 | 2.76% | 0.86% |
| 1971 | 2.69% | 0.42% |
| 1970 | 2.61% | 0.43% |
| 1969 | 2.63% | 0.77% |
| 1968 | 2.75% | 0.78% |
| 1967 | 2.86% | 0.85% |
| 1966 | 2.88% | 0.93% |
| 1965 | 2.81% | 1.01% |
| 1964 | 2.69% | 1.06% |
| 1963 | 2.87% | 1.03% |
| 1962 | 3.19% | 1.11% |
| 1961 | 3.24% | 3.04% |
Data sources: United Nations | World Population Prospects (2026–2100, retrieved 2026-07-08); World Bank | Health (1961–2025, retrieved 2026-07-08).
GeoRank.org/population/mongolia/slovakia | CC BY
In 2025, the population of Mongolia grew by 1.25%, while Slovakia's population declined by 0.15%.
Live population counters
|
Mongolia
|
Slovakia
|
|
|---|---|---|
| Current population |
3630744
|
5376239
|
| Population rank | 132/197 | 125/197 |
| Percent of world population | 0.04% | 0.06% |
| One net population change |
11.9 minutes
|
1.06 hours
|
| One birth every |
8.82 minutes
|
11.4 minutes
|
| One death every |
27.1 minutes
|
9.79 minutes
|
| Daily growth/decline | +121 | -23 |
| Annual growth/decline | +44,190 | -8,256 |
| Annual growth/decline rate | +1.25% | -0.15% |
| Population growth rate rank | 81/197 | 170/197 |
| One migration net change every |
4.63 days
|
16.8 minutes
|
| Annual migration change | +79 | -31,377 |
| Net migration rank | 74/196 | 166/196 |
| Foreign-born residents | 22,589 | 323,991 |
| Foreign-born residents rank | 169/195 | 96/195 |
| Foreign-born share of population | 0.6% | 5.9% |
| Foreign-born share rank | 171/195 | 88/195 |
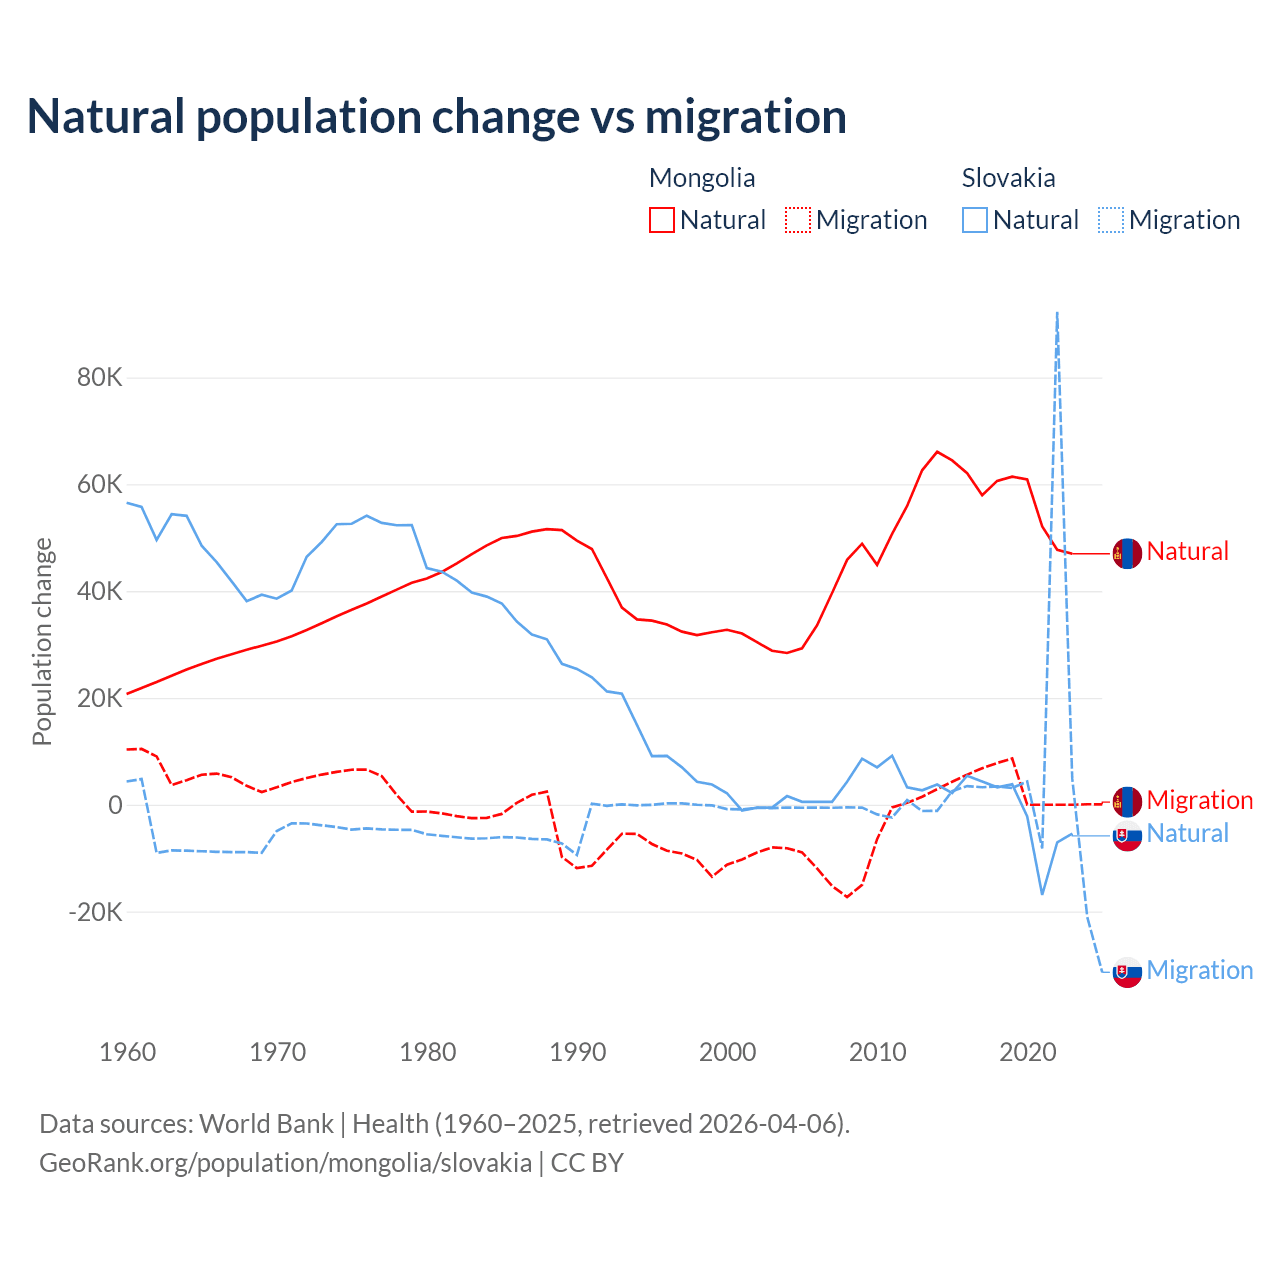
Natural population change vs migration
| Year | Population change | |||
|---|---|---|---|---|
|
Mongolia
|
Slovakia
|
|||
| Natural | Migration | Natural | Migration | |
| 2025 | - | 79 | - | -31,377 |
| 2024 | 40,182 | 83 | -7,591 | -21,027 |
| 2023 | 46,995 | 0 | -5,427 | 4,933 |
| 2022 | 47,730 | 0 | -7,062 | 92,314 |
| 2021 | 52,109 | 0 | -16,886 | -8,172 |
| 2020 | 60,888 | 0 | -2,184 | 4,350 |
| 2019 | 61,433 | 8,660 | 3,818 | 3,128 |
| 2018 | 60,635 | 7,811 | 3,268 | 3,446 |
| 2017 | 57,940 | 6,831 | 4,351 | 3,279 |
| 2016 | 62,086 | 5,633 | 5,431 | 3,487 |
| 2015 | 64,473 | 4,307 | 2,170 | 2,549 |
| 2014 | 66,078 | 2,921 | 3,793 | -1,158 |
| 2013 | 62,618 | 1,505 | 2,707 | -1,181 |
| 2012 | 55,942 | 351 | 3,245 | 871 |
| 2011 | 50,711 | -505 | 9,177 | -2,392 |
| 2010 | 44,914 | -6,444 | 7,008 | -1,814 |
| 2009 | 48,876 | -15,007 | 8,619 | -542 |
| 2008 | 45,843 | -17,277 | 4,303 | -495 |
| 2007 | 39,636 | -15,220 | 537 | -571 |
| 2006 | 33,609 | -11,934 | 537 | -549 |
| 2005 | 29,290 | -8,924 | 537 | -561 |
| 2004 | 28,418 | -8,148 | 1,611 | -522 |
| 2003 | 28,827 | -7,986 | -537 | -646 |
| 2002 | 30,439 | -8,934 | -538 | -580 |
| 2001 | 32,052 | -10,244 | -1,076 | -860 |
| 2000 | 32,753 | -11,241 | 2,155 | -831 |
| 1999 | 32,283 | -13,481 | 3,777 | -119 |
| 1998 | 31,757 | -10,315 | 4,312 | -12 |
| 1997 | 32,403 | -9,132 | 6,999 | 247 |
| 1996 | 33,741 | -8,626 | 9,135 | 246 |
| 1995 | 34,473 | -7,346 | 9,115 | -30 |
| 1994 | 34,711 | -5,449 | 14,970 | -109 |
| 1993 | 36,924 | -5,429 | 20,769 | 72 |
| 1992 | 42,437 | -8,404 | 21,220 | -201 |
| 1991 | 47,884 | -11,427 | 23,865 | 174 |
| 1990 | 49,443 | -11,881 | 25,436 | -9,402 |
| 1989 | 51,420 | -9,757 | 26,380 | -7,254 |
| 1988 | 51,588 | 2,459 | 30,979 | -6,500 |
| 1987 | 51,140 | 1,855 | 31,859 | -6,401 |
| 1986 | 50,329 | 354 | 34,279 | -6,143 |
| 1985 | 49,944 | -1,719 | 37,680 | -6,068 |
| 1984 | 48,562 | -2,452 | 38,966 | -6,276 |
| 1983 | 46,919 | -2,522 | 39,717 | -6,361 |
| 1982 | 45,179 | -2,132 | 41,958 | -6,088 |
| 1981 | 43,588 | -1,615 | 43,640 | -5,821 |
| 1980 | 42,343 | -1,268 | 44,320 | -5,522 |
| 1979 | 41,568 | -1,296 | 52,353 | -4,712 |
| 1978 | 40,276 | 1,833 | 52,324 | -4,689 |
| 1977 | 38,995 | 5,354 | 52,762 | -4,621 |
| 1976 | 37,670 | 6,577 | 54,121 | -4,432 |
| 1975 | 36,490 | 6,556 | 52,604 | -4,652 |
| 1974 | 35,297 | 6,153 | 52,524 | -4,190 |
| 1973 | 33,993 | 5,647 | 49,199 | -3,854 |
| 1972 | 32,727 | 4,999 | 46,426 | -3,516 |
| 1971 | 31,536 | 4,238 | 40,105 | -3,495 |
| 1970 | 30,558 | 3,263 | 38,575 | -4,919 |
| 1969 | 29,781 | 2,366 | 39,312 | -8,998 |
| 1968 | 29,017 | 3,535 | 38,113 | -8,881 |
| 1967 | 28,178 | 5,139 | 41,824 | -8,876 |
| 1966 | 27,338 | 5,837 | 45,440 | -8,817 |
| 1965 | 26,364 | 5,610 | 48,517 | -8,707 |
| 1964 | 25,317 | 4,599 | 54,092 | -8,608 |
| 1963 | 24,142 | 3,687 | 54,382 | -8,548 |
| 1962 | 22,960 | 9,049 | 49,587 | -9,019 |
| 1961 | 21,873 | 10,440 | 55,749 | 4,812 |
| 1960 | 20,726 | 10,334 | 56,546 | 4,344 |
Data sources: World Bank | Health (1960–2025, retrieved 2026-07-08).
GeoRank.org/population/mongolia/slovakia | CC BY
Over the last 10 years, 94.3% of the population change in Mongolia is from natural causes (a gain of 554,471 people) and 5.67% is from migration (a gain of 33,325 people). In Slovakia 18.6% is from natural causes (a loss of 20,112 people) and 81.4% is from migration (a gain of 88,287 people).
As of 2024, 22,589 residents or 0.6% of the population were not native-born in Mongolia, compared to 323,991 people or 5.9% in Slovakia.
Biggest cities by population
Compare countries by 7 more topics
Population differences between Mongolia and Slovakia
|
Mongolia
|
Slovakia
|
|
|---|---|---|
| Life expectancy | 72.5 years | 78.8 years |
| Average age | 29.9 years | 42.3 years |
| Median age | 27.9 years | 43.3 years |
| Male:Female ratio | 49.8:50.2 | 48.8:51.2 |
| Fertility rate | 2.5 births per woman | 1.46 births per woman |
| Population density | 6 ppl/mi² | 289.6 ppl/mi² |
Population map with other countries
Data sources: World Bank | Health (1960–2025, retrieved 2026-07-08); United Nations | World Population Prospects (1960–2026, retrieved 2026-07-08); U.S. Census Bureau (1960–2025, retrieved 2026-07-08); Central Intelligence Agency (CIA) (2000–2019, retrieved 2026-07-08).
GeoRank.org/population/mongolia/slovakia | CC BY
Help us show the world through your eyes
Share a photo of your city and help others discover what it looks like to live there. Your contribution makes our data come alive.
Data sources:
- World Bank | Health (1960–2025, retrieved 2026-07-08)
- United Nations | World Population Prospects (1960–2100, retrieved 2026-07-08)
- U.S. Census Bureau (1960–2025, retrieved 2026-07-08)
- Central Intelligence Agency (CIA) (2000–2019, retrieved 2026-07-08)
- Wikidata (2026, retrieved 2026-07-08)
Creative Commons Attribution (CC BY) — you’re free to copy, share, remix, adapt, and use even commercially as long as you give appropriate credit and clearly indicate if you made changes. Other sources may be subject to different license terms.