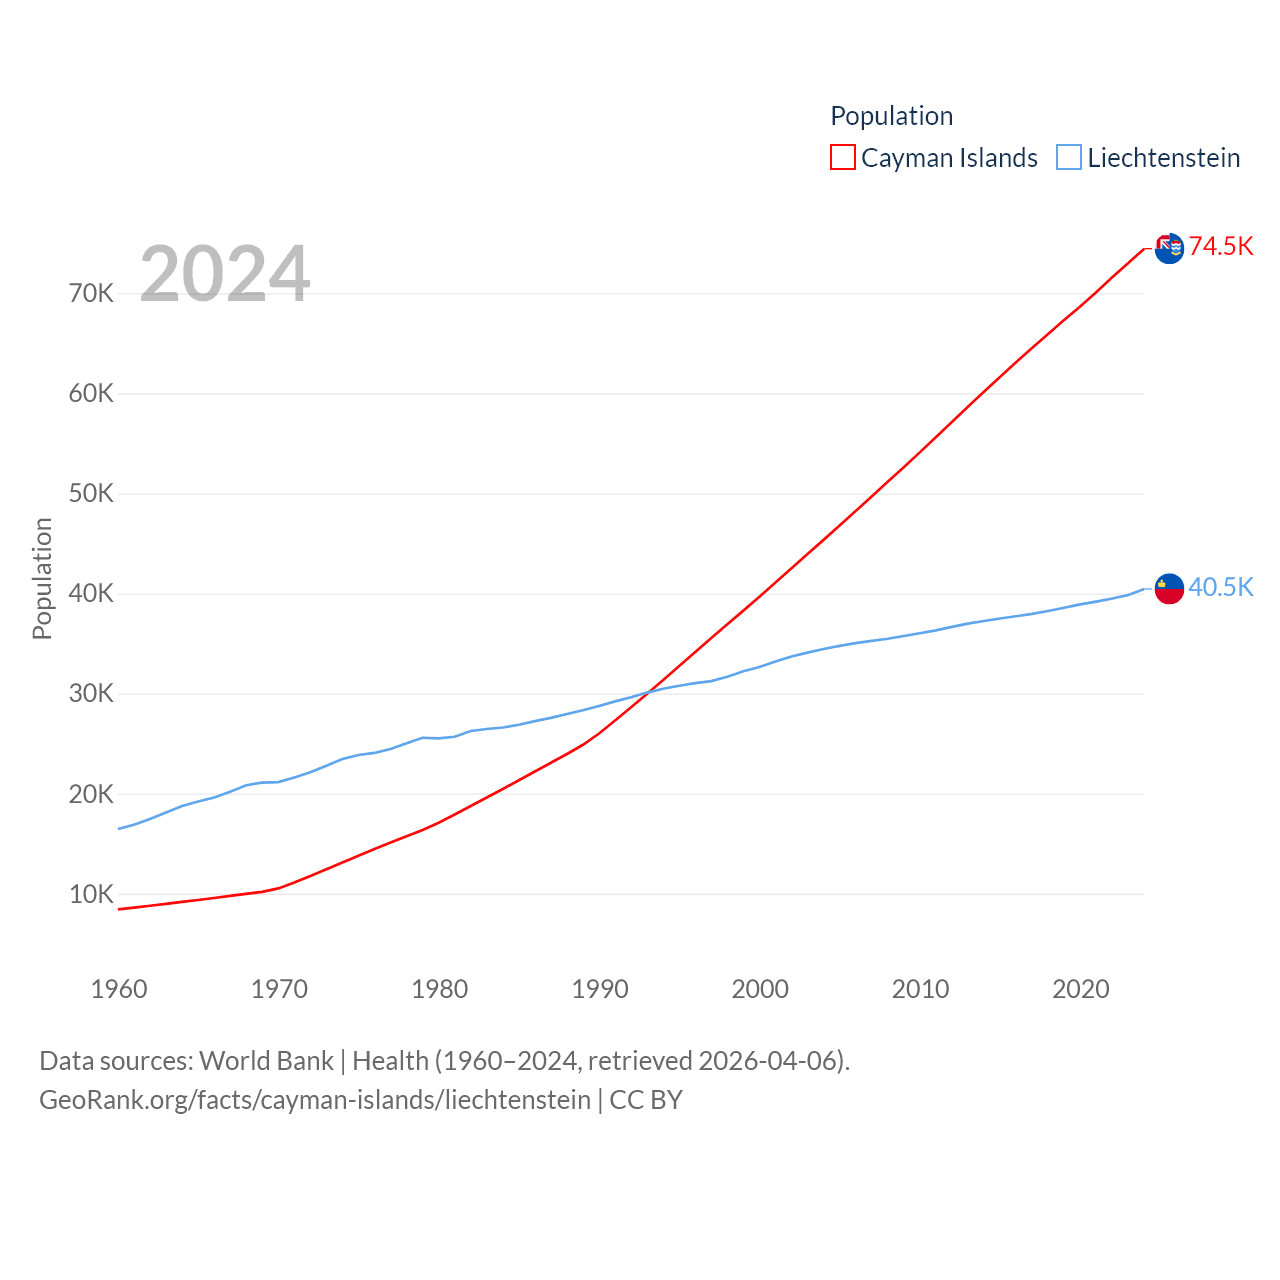
The Cayman Islands has a population of 74.5K (ranked 187/197), compared with 40.4K in Liechtenstein (ranked 190/197). The Cayman Islands' land area is 92.7 sq mi versus 61.8 sq mi for Liechtenstein (ranked 190th vs. 192nd).
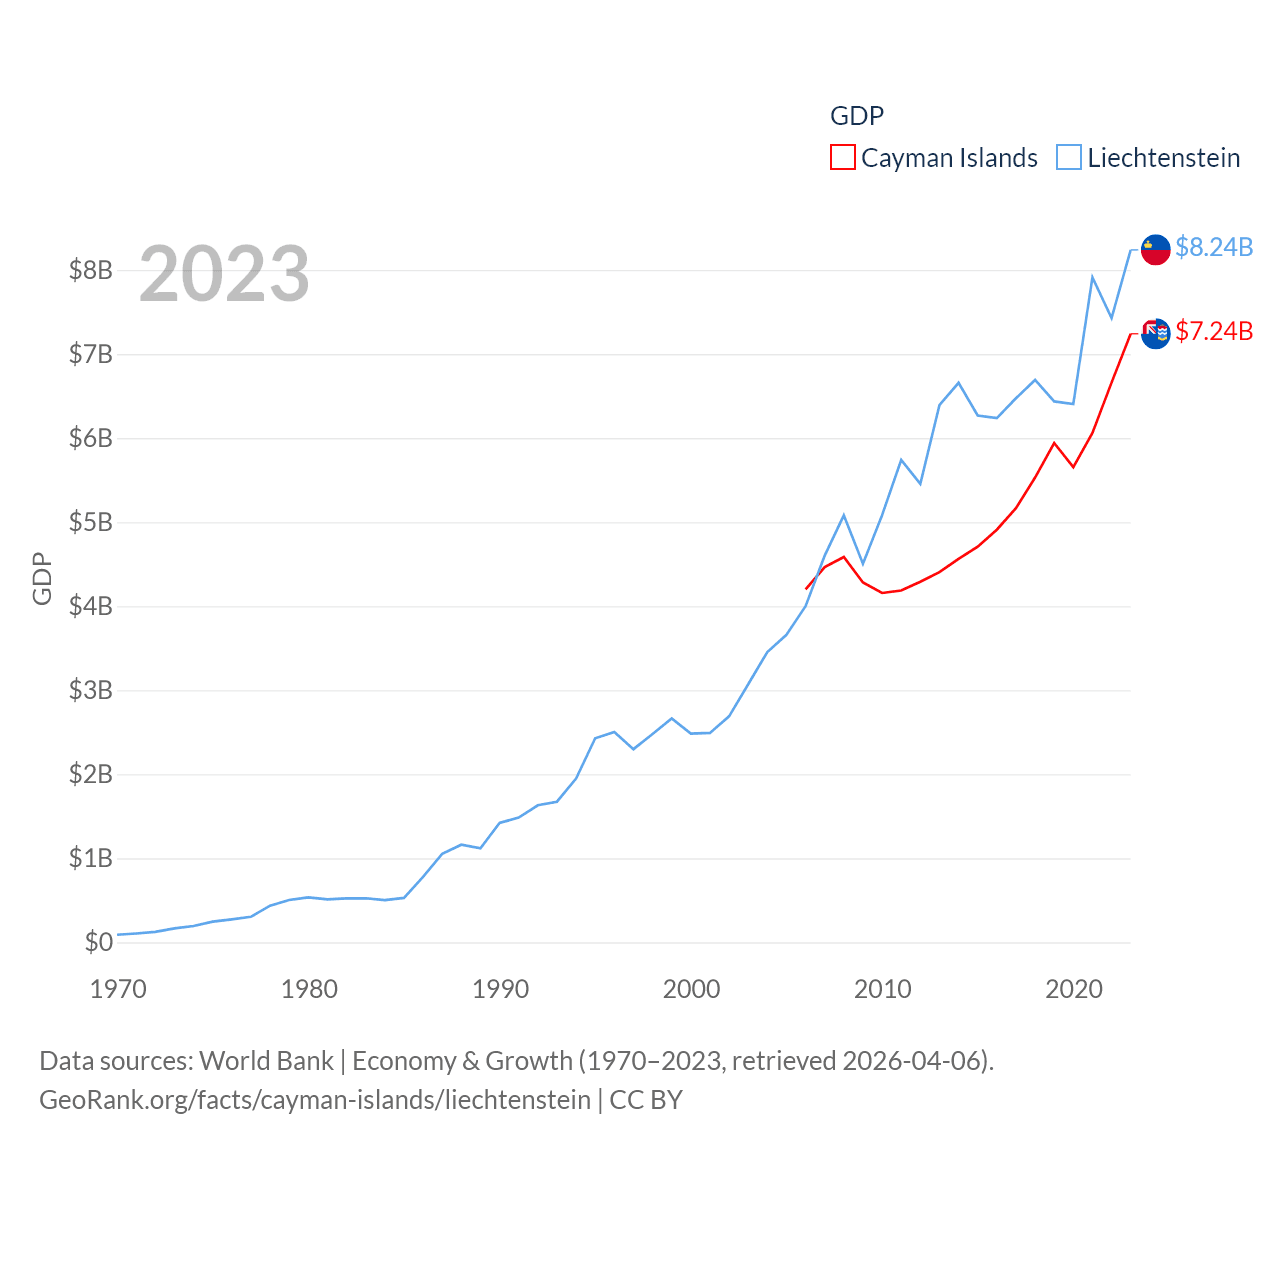
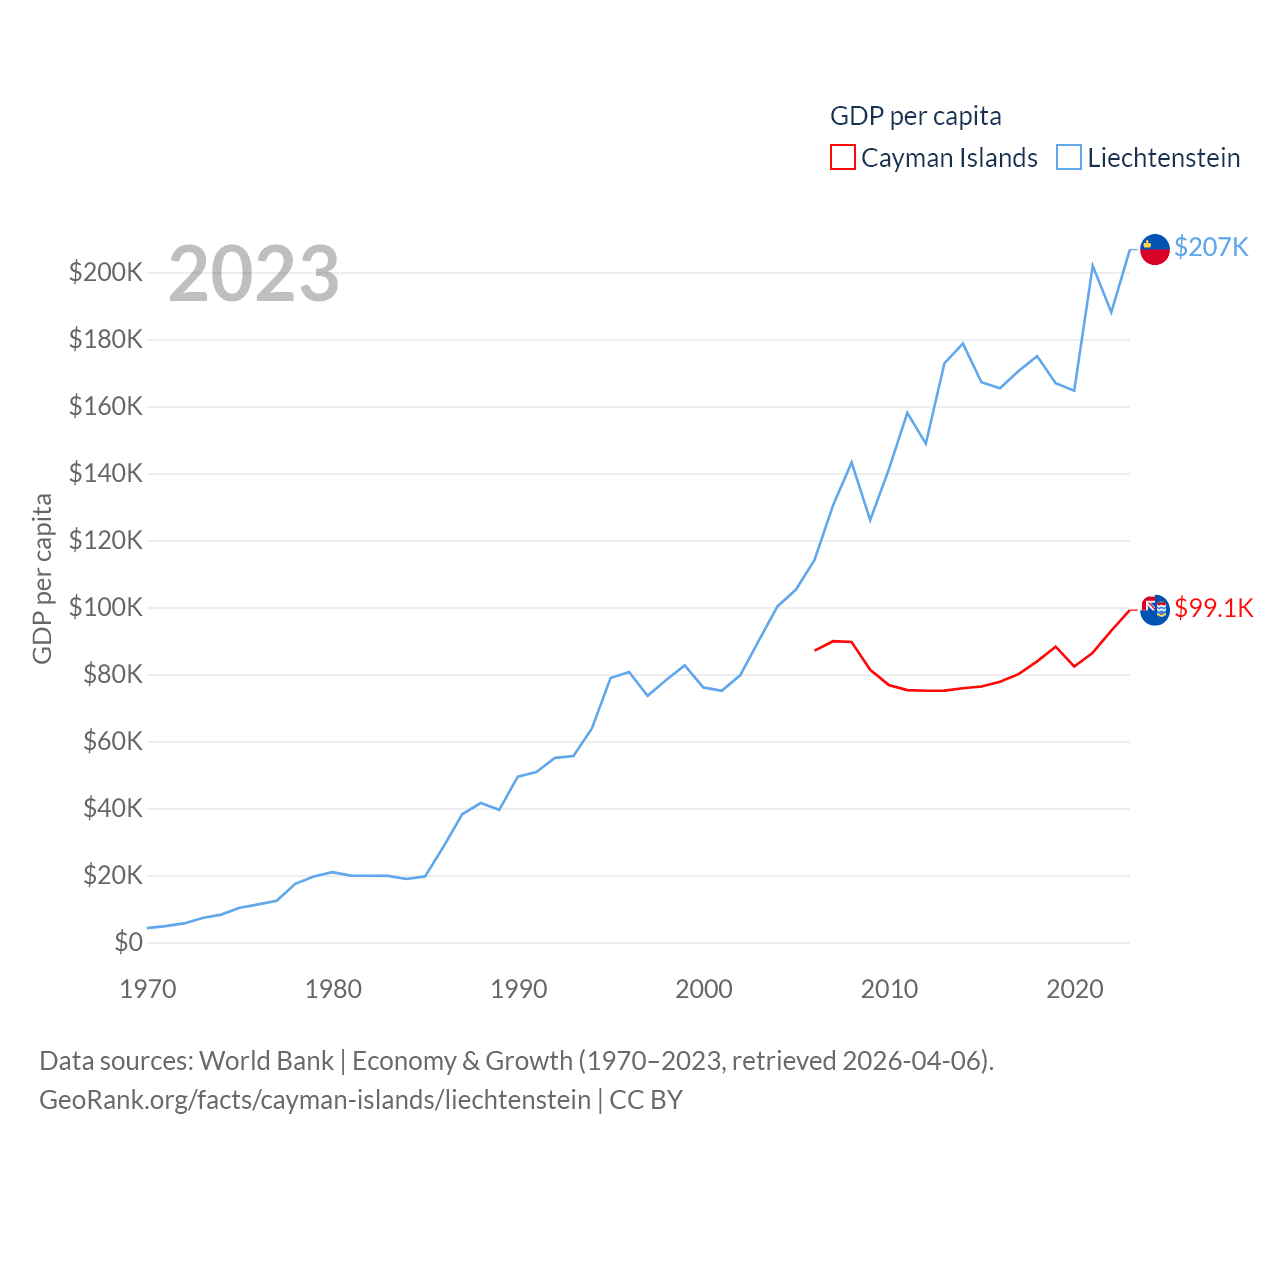
By GDP, The Cayman Islands ranks 158/197 ($7.24B) and Liechtenstein ranks 156/197 ($8.24B). By GDP per capita, The Cayman Islands ranks 6/197 ($99,144), while Liechtenstein ranks 2/197 ($206,781).
Main facts and rankings
 Cayman Islands
|
 Liechtenstein
|
|
|---|---|---|
| Population |
77619
|
41038
|
| Population rank | 187/197 | 190/197 |
| GDP |
$7.24B
2023 |
$8.24B
2023 |
| GDP rank | 158/197 | 156/197 |
| GDP per capita |
$99,144
2023 |
$206,781
2023 |
| GDP per capita rank | 6/197 | 2/197 |
| GDP per capita, PPP |
$88,428
2023 |
$139,100
2009 |
| Average annual personal income after taxes |
$93,253
2026 |
$97,806
2026 |
| Land area | 92.7 sq mi | 61.8 sq mi |
| Population density |
834 ppl/mi²
2026 |
663 ppl/mi²
2026 |
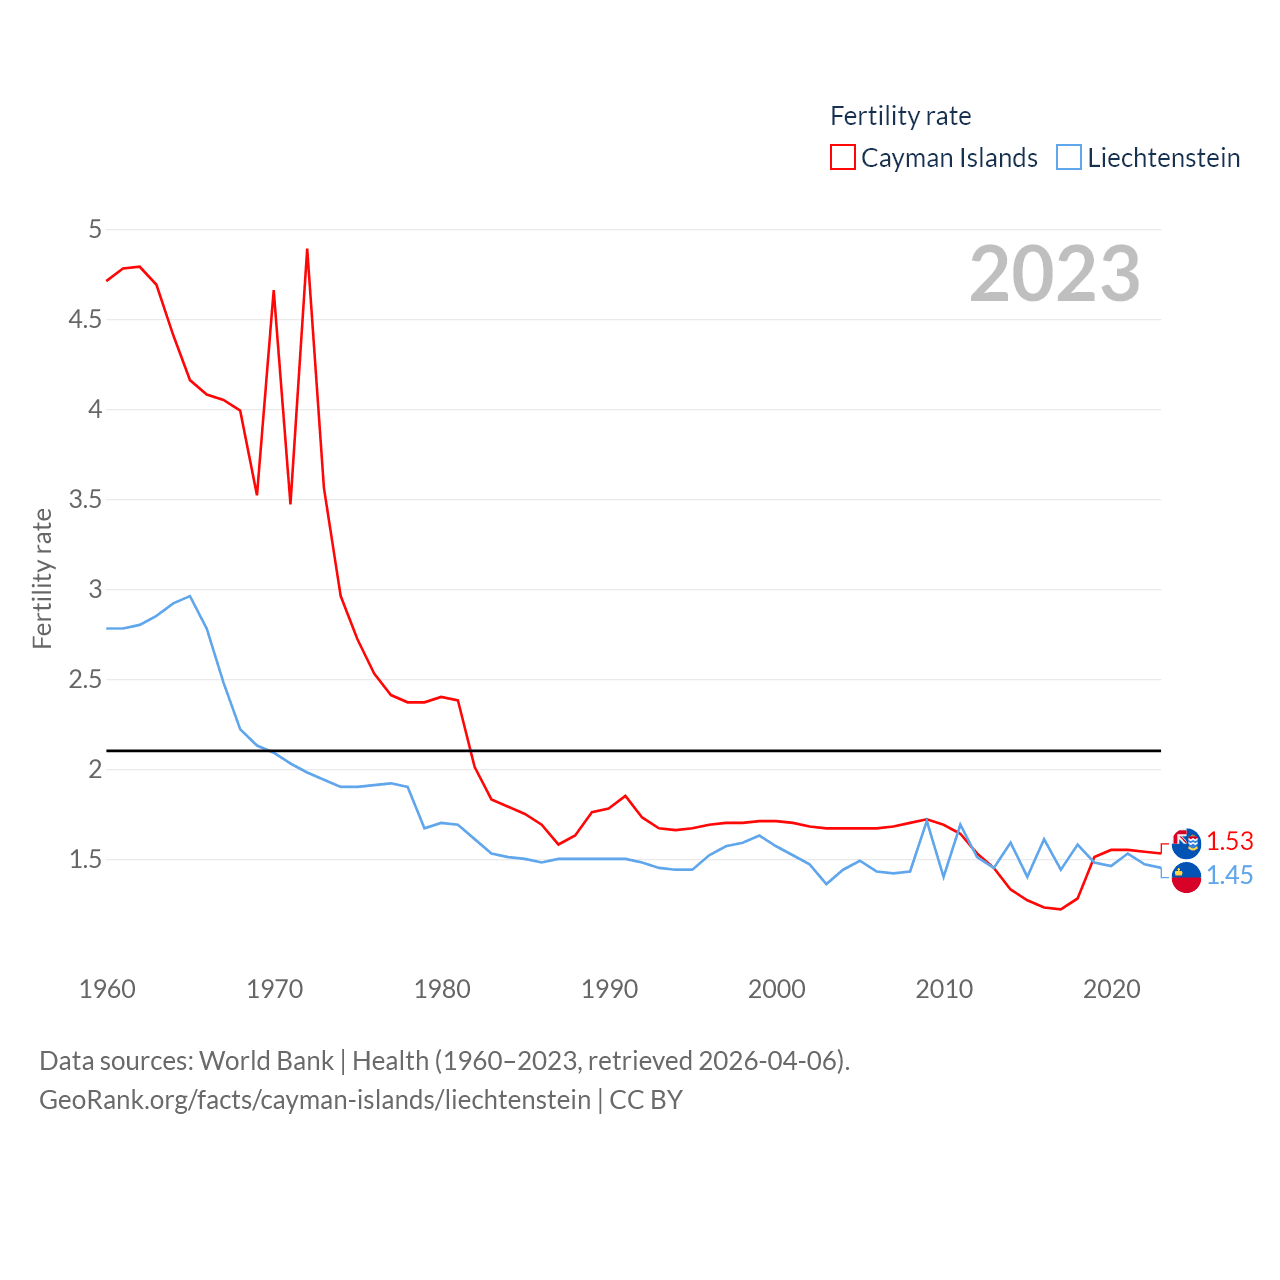
| Fertility rate |
1.53
2023 |
1.45
2023 |
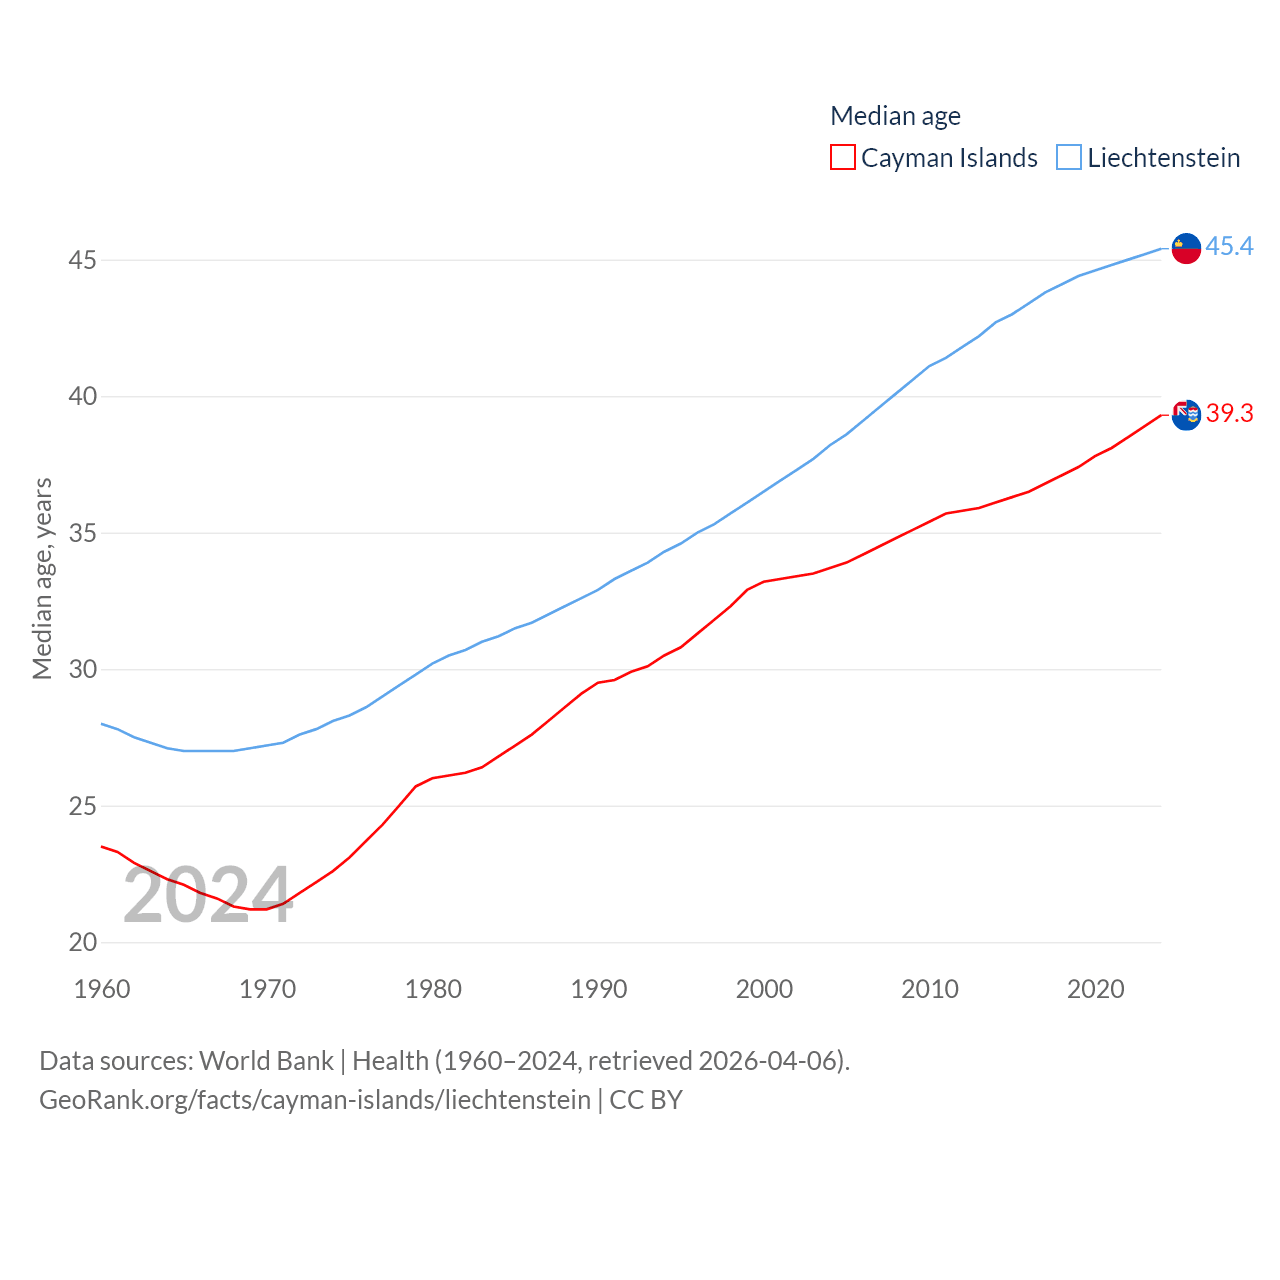
| Median age |
39.3 years
2024 |
45.4 years
2024 |
| Life expectancy |
80.9 years
2026 |
84.1 years
2026 |
Cayman Islands and Liechtenstein: Comparison Charts
Cayman Islands and Liechtenstein economies compared
| Year | GDP | |
|---|---|---|
|
Cayman Islands
|
Liechtenstein
|
|
| 2023 | $7,241,244,269 | $8,239,379,403 |
| 2022 | $6,660,161,212 | $7,426,856,243 |
| 2021 | $6,060,813,808 | $7,912,602,342 |
| 2020 | $5,655,357,984 | $6,405,870,210 |
| 2019 | $5,941,896,600 | $6,436,467,007 |
| 2018 | $5,530,178,499 | $6,692,620,692 |
| 2017 | $5,166,281,293 | $6,474,308,718 |
| 2016 | $4,909,322,200 | $6,237,302,034 |
| 2015 | $4,708,167,255 | $6,268,515,276 |
| 2014 | $4,562,853,582 | $6,657,526,980 |
| 2013 | $4,405,796,081 | $6,391,708,311 |
| 2012 | $4,291,004,486 | $5,456,102,482 |
| 2011 | $4,186,073,160 | $5,739,706,005 |
| 2010 | $4,156,841,164 | $5,082,337,238 |
| 2009 | $4,281,714,618 | $4,504,375,348 |
| 2008 | $4,585,948,969 | $5,081,479,840 |
| 2007 | $4,466,278,031 | $4,601,429,897 |
| 2006 | $4,200,288,282 | $4,000,102,086 |
| 2005 | - | $3,659,319,117 |
| 2004 | - | $3,454,373,798 |
| 2003 | - | $3,070,803,051 |
| 2002 | - | $2,688,618,747 |
| 2001 | - | $2,491,800,559 |
| 2000 | - | $2,483,889,858 |
| 1999 | - | $2,664,105,901 |
| 1998 | - | $2,479,699,106 |
| 1997 | - | $2,298,389,803 |
| 1996 | - | $2,504,012,993 |
| 1995 | - | $2,428,525,061 |
| 1994 | - | $1,948,129,623 |
| 1993 | - | $1,673,085,245 |
| 1992 | - | $1,631,177,029 |
| 1991 | - | $1,484,160,302 |
| 1990 | - | $1,421,509,216 |
| 1989 | - | $1,119,983,801 |
| 1988 | - | $1,161,757,671 |
| 1987 | - | $1,052,848,996 |
| 1986 | - | $779,357,803 |
| 1985 | - | $529,073,612 |
| 1984 | - | $502,620,992 |
| 1983 | - | $524,023,625 |
| 1982 | - | $522,096,760 |
| 1981 | - | $511,647,750 |
| 1980 | - | $534,699,363 |
| 1979 | - | $503,173,104 |
| 1978 | - | $436,912,068 |
| 1977 | - | $303,493,119 |
| 1976 | - | $272,489,300 |
| 1975 | - | $246,389,102 |
| 1974 | - | $193,980,465 |
| 1973 | - | $165,928,882 |
| 1972 | - | $124,940,289 |
| 1971 | - | $104,889,795 |
| 1970 | - | $90,099,361 |
Data sources: World Bank | Economy & Growth (1970–2023, retrieved 2026-04-06).
GeoRank.org/facts/cayman-islands/liechtenstein | CC BY 
Cayman Islands and Liechtenstein economies compared
| Year | GDP per capita | |
|---|---|---|
|
Cayman Islands
|
Liechtenstein
|
|
| 2023 | $99,144 | $206,781 |
| 2022 | $93,031 | $188,055 |
| 2021 | $86,450 | $201,945 |
| 2020 | $82,339 | $164,671 |
| 2019 | $88,254 | $166,908 |
| 2018 | $83,866 | $174,989 |
| 2017 | $80,054 | $170,547 |
| 2016 | $77,802 | $165,375 |
| 2015 | $76,379 | $167,187 |
| 2014 | $75,845 | $178,735 |
| 2013 | $75,114 | $172,824 |
| 2012 | $75,102 | $148,842 |
| 2011 | $75,281 | $158,066 |
| 2010 | $76,838 | $141,090 |
| 2009 | $81,374 | $126,025 |
| 2008 | $89,655 | $143,249 |
| 2007 | $89,888 | $130,493 |
| 2006 | $87,085 | $114,168 |
| 2005 | - | $105,295 |
| 2004 | - | $100,281 |
| 2003 | - | $90,108 |
| 2002 | - | $79,795 |
| 2001 | - | $75,068 |
| 2000 | - | $76,088 |
| 1999 | - | $82,682 |
| 1998 | - | $78,303 |
| 1997 | - | $73,591 |
| 1996 | - | $80,689 |
| 1995 | - | $78,910 |
| 1994 | - | $63,936 |
| 1993 | - | $55,605 |
| 1992 | - | $55,057 |
| 1991 | - | $50,812 |
| 1990 | - | $49,458 |
| 1989 | - | $39,552 |
| 1988 | - | $41,569 |
| 1987 | - | $38,206 |
| 1986 | - | $28,613 |
| 1985 | - | $19,684 |
| 1984 | - | $18,898 |
| 1983 | - | $19,815 |
| 1982 | - | $19,886 |
| 1981 | - | $19,929 |
| 1980 | - | $20,959 |
| 1979 | - | $19,674 |
| 1978 | - | $17,457 |
| 1977 | - | $12,417 |
| 1976 | - | $11,326 |
| 1975 | - | $10,333 |
| 1974 | - | $8,272 |
| 1973 | - | $7,282 |
| 1972 | - | $5,645 |
| 1971 | - | $4,856 |
| 1970 | - | $4,262 |
Data sources: World Bank | Economy & Growth (1970–2023, retrieved 2026-04-06).
GeoRank.org/facts/cayman-islands/liechtenstein | CC BY
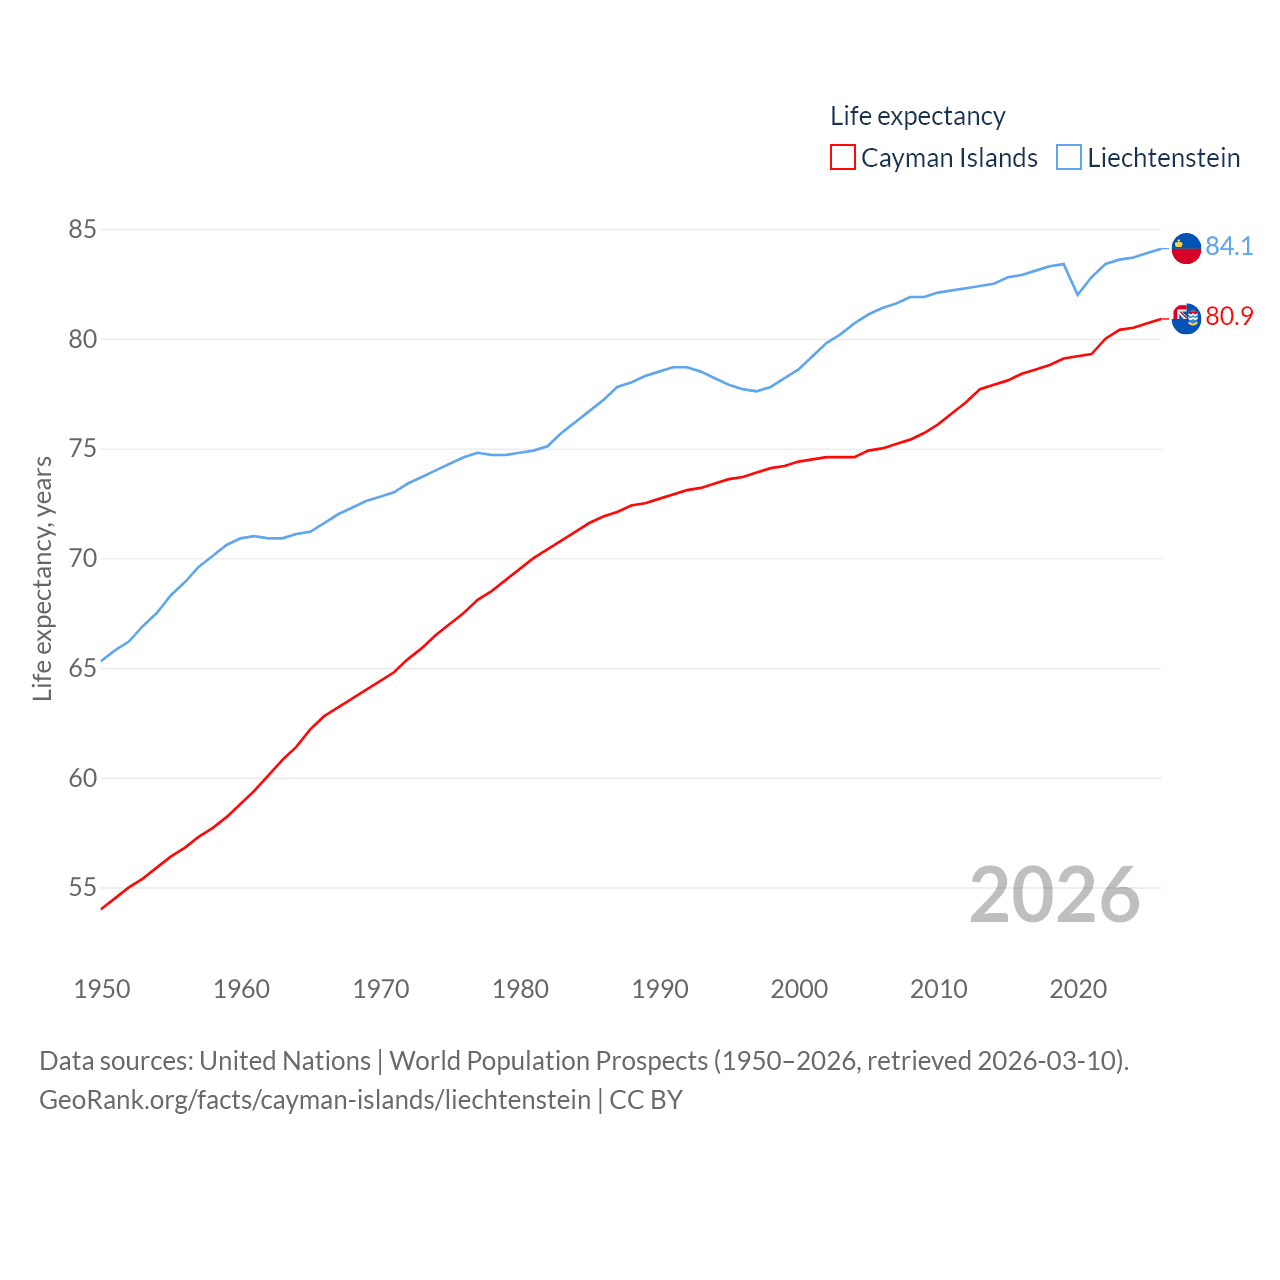
Cayman Islands vs. Liechtenstein life expectancy calculator
| Year | Life expectancy, years | |
|---|---|---|
|
Cayman Islands
|
Liechtenstein
|
|
| 2026 | 80.9 | 84.1 |
| 2025 | 80.7 | 83.9 |
| 2024 | 80.5 | 83.7 |
| 2023 | 80.4 | 83.6 |
| 2022 | 80 | 83.4 |
| 2021 | 79.3 | 82.8 |
| 2020 | 79.2 | 82 |
| 2019 | 79.1 | 83.4 |
| 2018 | 78.8 | 83.3 |
| 2017 | 78.6 | 83.1 |
| 2016 | 78.4 | 82.9 |
| 2015 | 78.1 | 82.8 |
| 2014 | 77.9 | 82.5 |
| 2013 | 77.7 | 82.4 |
| 2012 | 77.1 | 82.3 |
| 2011 | 76.6 | 82.2 |
| 2010 | 76.1 | 82.1 |
| 2009 | 75.7 | 81.9 |
| 2008 | 75.4 | 81.9 |
| 2007 | 75.2 | 81.6 |
| 2006 | 75 | 81.4 |
| 2005 | 74.9 | 81.1 |
| 2004 | 74.6 | 80.7 |
| 2003 | 74.6 | 80.2 |
| 2002 | 74.6 | 79.8 |
| 2001 | 74.5 | 79.2 |
| 2000 | 74.4 | 78.6 |
| 1999 | 74.2 | 78.2 |
| 1998 | 74.1 | 77.8 |
| 1997 | 73.9 | 77.6 |
| 1996 | 73.7 | 77.7 |
| 1995 | 73.6 | 77.9 |
| 1994 | 73.4 | 78.2 |
| 1993 | 73.2 | 78.5 |
| 1992 | 73.1 | 78.7 |
| 1991 | 72.9 | 78.7 |
| 1990 | 72.7 | 78.5 |
| 1989 | 72.5 | 78.3 |
| 1988 | 72.4 | 78 |
| 1987 | 72.1 | 77.8 |
| 1986 | 71.9 | 77.2 |
| 1985 | 71.6 | 76.7 |
| 1984 | 71.2 | 76.2 |
| 1983 | 70.8 | 75.7 |
| 1982 | 70.4 | 75.1 |
| 1981 | 70 | 74.9 |
| 1980 | 69.5 | 74.8 |
| 1979 | 69 | 74.7 |
| 1978 | 68.5 | 74.7 |
| 1977 | 68.1 | 74.8 |
| 1976 | 67.5 | 74.6 |
| 1975 | 67 | 74.3 |
| 1974 | 66.5 | 74 |
| 1973 | 65.9 | 73.7 |
| 1972 | 65.4 | 73.4 |
| 1971 | 64.8 | 73 |
| 1970 | 64.4 | 72.8 |
| 1969 | 64 | 72.6 |
| 1968 | 63.6 | 72.3 |
| 1967 | 63.2 | 72 |
| 1966 | 62.8 | 71.6 |
| 1965 | 62.2 | 71.2 |
| 1964 | 61.4 | 71.1 |
| 1963 | 60.8 | 70.9 |
| 1962 | 60.1 | 70.9 |
| 1961 | 59.4 | 71 |
| 1960 | 58.8 | 70.9 |
| 1959 | 58.2 | 70.6 |
| 1958 | 57.7 | 70.1 |
| 1957 | 57.3 | 69.6 |
| 1956 | 56.8 | 68.9 |
| 1955 | 56.4 | 68.3 |
| 1954 | 55.9 | 67.5 |
| 1953 | 55.4 | 66.9 |
| 1952 | 55 | 66.2 |
| 1951 | 54.5 | 65.8 |
| 1950 | 54 | 65.3 |
Data sources: United Nations | World Population Prospects (1950–2026, retrieved 2026-03-10).
GeoRank.org/facts/cayman-islands/liechtenstein | CC BY
Cayman Islands and Liechtenstein population clocks and comparison
| Year | Population | |
|---|---|---|
|
Cayman Islands
|
Liechtenstein
|
|
| 2024 | 74,457 | 40,450 |
| 2023 | 73,038 | 39,846 |
| 2022 | 71,591 | 39,493 |
| 2021 | 70,108 | 39,182 |
| 2020 | 68,684 | 38,901 |
| 2019 | 67,327 | 38,563 |
| 2018 | 65,941 | 38,246 |
| 2017 | 64,535 | 37,962 |
| 2016 | 63,100 | 37,716 |
| 2015 | 61,642 | 37,494 |
| 2014 | 60,160 | 37,248 |
| 2013 | 58,655 | 36,984 |
| 2012 | 57,136 | 36,657 |
| 2011 | 55,606 | 36,312 |
| 2010 | 54,099 | 36,022 |
| 2009 | 52,618 | 35,742 |
| 2008 | 51,151 | 35,473 |
| 2007 | 49,687 | 35,262 |
| 2006 | 48,232 | 35,037 |
| 2005 | 46,788 | 34,753 |
| 2004 | 45,352 | 34,447 |
| 2003 | 43,934 | 34,079 |
| 2002 | 42,514 | 33,694 |
| 2001 | 41,089 | 33,194 |
| 2000 | 39,674 | 32,645 |
| 1999 | 38,284 | 32,221 |
| 1998 | 36,922 | 31,668 |
| 1997 | 35,543 | 31,232 |
| 1996 | 34,143 | 31,033 |
| 1995 | 32,743 | 30,776 |
| 1994 | 31,352 | 30,470 |
| 1993 | 29,976 | 30,089 |
| 1992 | 28,621 | 29,627 |
| 1991 | 27,294 | 29,209 |
| 1990 | 25,999 | 28,742 |
| 1989 | 24,874 | 28,317 |
| 1988 | 23,951 | 27,948 |
| 1987 | 23,073 | 27,557 |
| 1986 | 22,197 | 27,238 |
| 1985 | 21,324 | 26,878 |
| 1984 | 20,454 | 26,596 |
| 1983 | 19,598 | 26,446 |
| 1982 | 18,750 | 26,255 |
| 1981 | 17,905 | 25,673 |
| 1980 | 17,079 | 25,512 |
| 1979 | 16,351 | 25,575 |
| 1978 | 15,727 | 25,028 |
| 1977 | 15,105 | 24,442 |
| 1976 | 14,454 | 24,058 |
| 1975 | 13,788 | 23,846 |
| 1974 | 13,114 | 23,451 |
| 1973 | 12,438 | 22,785 |
| 1972 | 11,764 | 22,132 |
| 1971 | 11,098 | 21,600 |
| 1970 | 10,517 | 21,140 |
| 1969 | 10,165 | 21,084 |
| 1968 | 9,971 | 20,835 |
| 1967 | 9,769 | 20,175 |
| 1966 | 9,560 | 19,610 |
| 1965 | 9,361 | 19,195 |
| 1964 | 9,166 | 18,755 |
| 1963 | 8,970 | 18,093 |
| 1962 | 8,781 | 17,443 |
| 1961 | 8,601 | 16,877 |
| 1960 | 8,428 | 16,451 |
Data sources: World Bank | Health (1960–2024, retrieved 2026-04-06).
GeoRank.org/facts/cayman-islands/liechtenstein | CC BY
Fertility rates in Cayman Islands and Liechtenstein
| Year | Fertility rate | |
|---|---|---|
|
Cayman Islands
|
Liechtenstein
|
|
| 2023 | 1.53 | 1.45 |
| 2022 | 1.54 | 1.47 |
| 2021 | 1.55 | 1.53 |
| 2020 | 1.55 | 1.46 |
| 2019 | 1.51 | 1.48 |
| 2018 | 1.28 | 1.58 |
| 2017 | 1.22 | 1.44 |
| 2016 | 1.23 | 1.61 |
| 2015 | 1.27 | 1.4 |
| 2014 | 1.33 | 1.59 |
| 2013 | 1.45 | 1.45 |
| 2012 | 1.53 | 1.51 |
| 2011 | 1.64 | 1.69 |
| 2010 | 1.69 | 1.4 |
| 2009 | 1.72 | 1.71 |
| 2008 | 1.7 | 1.43 |
| 2007 | 1.68 | 1.42 |
| 2006 | 1.67 | 1.43 |
| 2005 | 1.67 | 1.49 |
| 2004 | 1.67 | 1.44 |
| 2003 | 1.67 | 1.36 |
| 2002 | 1.68 | 1.47 |
| 2001 | 1.7 | 1.52 |
| 2000 | 1.71 | 1.57 |
| 1999 | 1.71 | 1.63 |
| 1998 | 1.7 | 1.59 |
| 1997 | 1.7 | 1.57 |
| 1996 | 1.69 | 1.52 |
| 1995 | 1.67 | 1.44 |
| 1994 | 1.66 | 1.44 |
| 1993 | 1.67 | 1.45 |
| 1992 | 1.73 | 1.48 |
| 1991 | 1.85 | 1.5 |
| 1990 | 1.78 | 1.5 |
| 1989 | 1.76 | 1.5 |
| 1988 | 1.63 | 1.5 |
| 1987 | 1.58 | 1.5 |
| 1986 | 1.69 | 1.48 |
| 1985 | 1.75 | 1.5 |
| 1984 | 1.79 | 1.51 |
| 1983 | 1.83 | 1.53 |
| 1982 | 2.01 | 1.61 |
| 1981 | 2.38 | 1.69 |
| 1980 | 2.4 | 1.7 |
| 1979 | 2.37 | 1.67 |
| 1978 | 2.37 | 1.9 |
| 1977 | 2.41 | 1.92 |
| 1976 | 2.53 | 1.91 |
| 1975 | 2.72 | 1.9 |
| 1974 | 2.96 | 1.9 |
| 1973 | 3.56 | 1.94 |
| 1972 | 4.89 | 1.98 |
| 1971 | 3.47 | 2.03 |
| 1970 | 4.66 | 2.09 |
| 1969 | 3.52 | 2.13 |
| 1968 | 3.99 | 2.22 |
| 1967 | 4.05 | 2.48 |
| 1966 | 4.08 | 2.78 |
| 1965 | 4.16 | 2.96 |
| 1964 | 4.41 | 2.92 |
| 1963 | 4.69 | 2.85 |
| 1962 | 4.79 | 2.8 |
| 1961 | 4.78 | 2.78 |
| 1960 | 4.71 | 2.78 |
Data sources: World Bank | Health (1960–2023, retrieved 2026-04-06).
GeoRank.org/facts/cayman-islands/liechtenstein | CC BY
Cayman Islands and Liechtenstein demographics compared
| Year | Median age, years | |
|---|---|---|
|
Cayman Islands
|
Liechtenstein
|
|
| 2024 | 39.3 | 45.4 |
| 2023 | 38.9 | 45.2 |
| 2022 | 38.5 | 45 |
| 2021 | 38.1 | 44.8 |
| 2020 | 37.8 | 44.6 |
| 2019 | 37.4 | 44.4 |
| 2018 | 37.1 | 44.1 |
| 2017 | 36.8 | 43.8 |
| 2016 | 36.5 | 43.4 |
| 2015 | 36.3 | 43 |
| 2014 | 36.1 | 42.7 |
| 2013 | 35.9 | 42.2 |
| 2012 | 35.8 | 41.8 |
| 2011 | 35.7 | 41.4 |
| 2010 | 35.4 | 41.1 |
| 2009 | 35.1 | 40.6 |
| 2008 | 34.8 | 40.1 |
| 2007 | 34.5 | 39.6 |
| 2006 | 34.2 | 39.1 |
| 2005 | 33.9 | 38.6 |
| 2004 | 33.7 | 38.2 |
| 2003 | 33.5 | 37.7 |
| 2002 | 33.4 | 37.3 |
| 2001 | 33.3 | 36.9 |
| 2000 | 33.2 | 36.5 |
| 1999 | 32.9 | 36.1 |
| 1998 | 32.3 | 35.7 |
| 1997 | 31.8 | 35.3 |
| 1996 | 31.3 | 35 |
| 1995 | 30.8 | 34.6 |
| 1994 | 30.5 | 34.3 |
| 1993 | 30.1 | 33.9 |
| 1992 | 29.9 | 33.6 |
| 1991 | 29.6 | 33.3 |
| 1990 | 29.5 | 32.9 |
| 1989 | 29.1 | 32.6 |
| 1988 | 28.6 | 32.3 |
| 1987 | 28.1 | 32 |
| 1986 | 27.6 | 31.7 |
| 1985 | 27.2 | 31.5 |
| 1984 | 26.8 | 31.2 |
| 1983 | 26.4 | 31 |
| 1982 | 26.2 | 30.7 |
| 1981 | 26.1 | 30.5 |
| 1980 | 26 | 30.2 |
| 1979 | 25.7 | 29.8 |
| 1978 | 25 | 29.4 |
| 1977 | 24.3 | 29 |
| 1976 | 23.7 | 28.6 |
| 1975 | 23.1 | 28.3 |
| 1974 | 22.6 | 28.1 |
| 1973 | 22.2 | 27.8 |
| 1972 | 21.8 | 27.6 |
| 1971 | 21.4 | 27.3 |
| 1970 | 21.2 | 27.2 |
| 1969 | 21.2 | 27.1 |
| 1968 | 21.3 | 27 |
| 1967 | 21.6 | 27 |
| 1966 | 21.8 | 27 |
| 1965 | 22.1 | 27 |
| 1964 | 22.3 | 27.1 |
| 1963 | 22.6 | 27.3 |
| 1962 | 22.9 | 27.5 |
| 1961 | 23.3 | 27.8 |
| 1960 | 23.5 | 28 |
Data sources: World Bank | Health (1960–2024, retrieved 2026-04-06).
GeoRank.org/facts/cayman-islands/liechtenstein | CC BY
Interactive Maps
Use the buttons below to switch between world maps comparing statistics for the Cayman Islands and Liechtenstein.
National statistics comparison
Finance
|
Cayman Islands
|
Liechtenstein
|
|
|---|---|---|
| GNI, Atlas method |
$5.53B
2023 |
$4.16B
2009 |
| Government expenditure, % of GDP |
14%
2025 |
22.6%
2025 |
| Education expenditure, % of GDP |
1.57%
2023 |
2.56%
2011 |
| Unemployment rate |
4.24%
2015 |
2.01%
2007 |
| Services, % of GDP |
86%
2023 |
57.4%
2023 |
| Industry, % of GDP |
7.84%
2023 |
39.1%
2023 |
| Economic freedom index |
74
2025 |
74
2025 |
| Number of billionaires | n/a |
1
2025 |
| Percentage of billionaires | n/a |
0.003%
2025 |
| Listed domestic companies |
4
2020 |
n/a |
| Market capitalization of domestic companies |
$644M
2020 |
n/a |
| Total reserves including gold |
$234M
2023 |
n/a |
| Personal remittances received |
$10.2M
2024 |
n/a |
| International tourist arrivals |
660,000
2020 |
58,400
2020 |
| International tourism as share of exports |
22.9%
2019 |
n/a |
Energy
|
Cayman Islands
|
Liechtenstein
|
|
|---|---|---|
| Carbon dioxide (CO2) emissions |
0.37 megatons
2024 |
n/a |
| CO2 emissions per capita |
5 tons
2024 |
n/a |
| Renewable energy use share |
0%
2022 |
56.9%
2022 |
| Renewable electricity output share |
2.94%
2021 |
n/a |
| Hydroelectric share |
0%
2021 |
n/a |
| Nuclear share |
0%
2021 |
n/a |
| Electricity access |
100%
2023 |
100%
2023 |
Society
|
Cayman Islands
|
Liechtenstein
|
|
|---|---|---|
| % of world population |
0.0009%
2024 |
0.0005%
2024 |
| Annual migration change |
+888
2025 |
+194
2025 |
| Urban population |
100%
2024 |
14.7%
2024 |
| Male:Female ratio |
50.2:49.8
2024 |
49.7:50.3
2024 |
| Quality of life index |
85.1
2026 |
96.8
2026 |
| Corruption Perceptions Index |
76
2025 |
82
2025 |
| Higher education index |
13
2026 |
44
2026 |
| Homicides per 100K people |
4.46
2020 |
5.12
2021 |
| Road traffic mortality per 100K people |
14
2025 |
0.5
2025 |
| Visa free countries | n/a |
169
2025 |
| Adult literacy rate |
99%
2017 |
100%
2013 |
| English speaking |
76.6%
2023 |
35%
2025 |
| People using the Internet |
81.1%
2017 |
97.3%
2023 |
Health
|
Cayman Islands
|
Liechtenstein
|
|
|---|---|---|
| Government health expenditure per capita | n/a |
$11,495
2023 |
| Out-of-pocket health expenditure per capita | n/a |
$2,266
2023 |
| Life expectancy |
80.9 years
2026 |
84.1 years
2026 |
| Physicians per 1,000 people |
1.94
1997 |
n/a |
| Age at first childbirth | n/a |
31.3 years
2017 |
| Diabetes prevalence |
11.1%
2024 |
7.2%
2024 |
| Air quality index |
78
2026 |
86
2026 |
Territory
|
Cayman Islands
|
Liechtenstein
|
|
|---|---|---|
| % of world land |
0.0002%
2026 |
0.0001%
2026 |
| Land area per capita |
1,245 sq mi
2024 |
1,527 sq mi
2024 |
| Agricultural land area |
10.4 sq mi
2026 |
20 sq mi
2026 |
| Forest area |
48.6 sq mi
2026 |
25.9 sq mi
2026 |
| Roads length |
488 mi
2007 |
391 mi
2019 |
In-depth comparisons
Help us show the world through your eyes
Share a photo of your city and help others discover what it looks like to live there. Your contribution makes our data come alive.
Data sources:
- World Bank | Health (1960–2025, retrieved 2026-04-06)
- United Nations | World Population Prospects (1950–2026, retrieved 2026-03-10)
- U.S. Census Bureau (1960–2025, retrieved 2026-02-08)
- Central Intelligence Agency (CIA) (2000–2019, retrieved 2026-02-20)
- LivingCost (2026, retrieved 2025-10-14)
- EduRank (2026, retrieved 2025-10-13)
- United Nations Economic Commission for Europe (UNECE) (2017, retrieved 2026-03-10)
- Passport Index (2025, retrieved 2026-02-08)
Creative Commons Attribution (CC BY) — you’re free to copy, share, remix, adapt, and use even commercially as long as you give appropriate credit and clearly indicate if you made changes. Other sources may be subject to different license terms.