The latest officially reported population of the Czech Republic was 10,886,878 in 2025 vs 23,331,886 people in Taiwan in 2025. In 2026, based on the adjusted UN estimation, the current Czech Republic's population is 10,742,283 people compared to 23,229,461 in Taiwan.
Population statistics:
- Taiwan's population is 2.16 times bigger than the Czech Republic's.
- The Czech Republic is ranked the 92nd most populous country in the world, while Taiwan is the 60th.
- The countries together account for 0.41% of the world: 0.13% for the Czech Republic vs 0.28% for Taiwan.
- For the last 10 years, the Czech Republic has had an average growth rate of +0.31% per year vs -0.03% in Taiwan.
- Since 2006, the population of the Czech Republic has increased from 10.2M people to 10.7M (4.92% growth), while Taiwan has grown from 22.8M to 23.2M (1.78% growth).
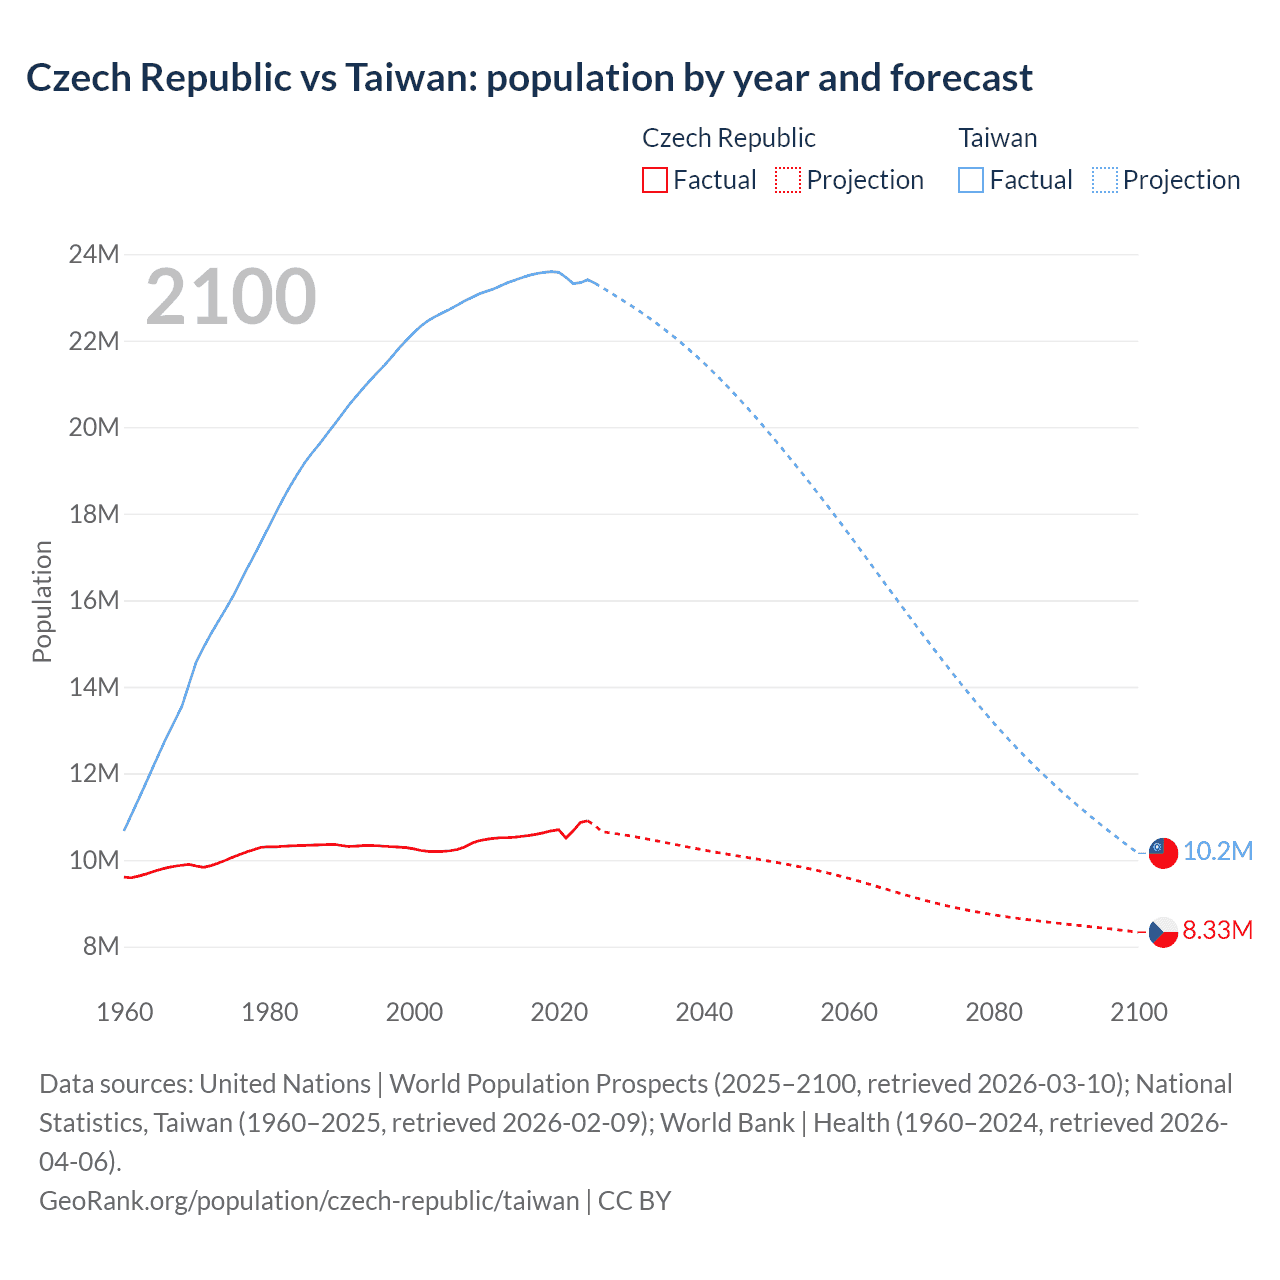
Czech Republic vs Taiwan: population by year and forecast
| Year | Population | |
|---|---|---|
 Czech Republic
|
 Taiwan
|
|
| 2100 | 8,398,703 | 10,150,338 |
| 2099 | 8,420,054 | 10,273,881 |
| 2098 | 8,440,780 | 10,399,680 |
| 2097 | 8,460,511 | 10,527,804 |
| 2096 | 8,480,556 | 10,657,536 |
| 2095 | 8,499,484 | 10,789,978 |
| 2094 | 8,518,286 | 10,925,075 |
| 2093 | 8,536,499 | 11,062,491 |
| 2092 | 8,554,517 | 11,202,670 |
| 2091 | 8,572,195 | 11,346,131 |
| 2090 | 8,590,647 | 11,494,369 |
| 2089 | 8,609,075 | 11,644,743 |
| 2088 | 8,627,611 | 11,799,177 |
| 2087 | 8,647,206 | 11,956,109 |
| 2086 | 8,667,774 | 12,116,149 |
| 2085 | 8,688,472 | 12,281,248 |
| 2084 | 8,710,097 | 12,451,872 |
| 2083 | 8,732,416 | 12,625,681 |
| 2082 | 8,756,281 | 12,803,442 |
| 2081 | 8,781,441 | 12,986,931 |
| 2080 | 8,807,994 | 13,174,137 |
| 2079 | 8,836,073 | 13,366,920 |
| 2078 | 8,865,602 | 13,564,788 |
| 2077 | 8,896,421 | 13,765,770 |
| 2076 | 8,928,964 | 13,969,802 |
| 2075 | 8,963,945 | 14,178,904 |
| 2074 | 9,000,807 | 14,391,331 |
| 2073 | 9,039,770 | 14,606,033 |
| 2072 | 9,080,946 | 14,824,987 |
| 2071 | 9,123,937 | 15,045,310 |
| 2070 | 9,168,851 | 15,266,143 |
| 2069 | 9,215,360 | 15,488,280 |
| 2068 | 9,262,938 | 15,714,125 |
| 2067 | 9,311,827 | 15,940,945 |
| 2066 | 9,361,827 | 16,167,553 |
| 2065 | 9,412,850 | 16,396,032 |
| 2064 | 9,463,141 | 16,625,600 |
| 2063 | 9,513,448 | 16,854,355 |
| 2062 | 9,562,710 | 17,084,600 |
| 2061 | 9,610,889 | 17,314,450 |
| 2060 | 9,657,465 | 17,541,998 |
| 2059 | 9,702,379 | 17,767,014 |
| 2058 | 9,745,727 | 17,988,239 |
| 2057 | 9,787,770 | 18,208,151 |
| 2056 | 9,827,846 | 18,423,453 |
| 2055 | 9,865,895 | 18,639,554 |
| 2054 | 9,902,399 | 18,853,384 |
| 2053 | 9,936,727 | 19,063,428 |
| 2052 | 9,969,256 | 19,270,076 |
| 2051 | 10,000,522 | 19,474,323 |
| 2050 | 10,030,910 | 19,677,203 |
| 2049 | 10,059,551 | 19,878,438 |
| 2048 | 10,087,904 | 20,073,645 |
| 2047 | 10,115,848 | 20,267,326 |
| 2046 | 10,144,045 | 20,454,154 |
| 2045 | 10,171,882 | 20,640,565 |
| 2044 | 10,199,799 | 20,819,477 |
| 2043 | 10,228,264 | 20,995,111 |
| 2042 | 10,257,414 | 21,166,213 |
| 2041 | 10,287,621 | 21,331,710 |
| 2040 | 10,318,078 | 21,491,361 |
| 2039 | 10,349,820 | 21,645,911 |
| 2038 | 10,381,806 | 21,794,529 |
| 2037 | 10,414,999 | 21,939,617 |
| 2036 | 10,447,885 | 22,077,701 |
| 2035 | 10,481,420 | 22,211,115 |
| 2034 | 10,514,820 | 22,340,809 |
| 2033 | 10,547,938 | 22,463,465 |
| 2032 | 10,580,423 | 22,582,449 |
| 2031 | 10,611,839 | 22,698,460 |
| 2030 | 10,641,892 | 22,809,605 |
| 2029 | 10,670,568 | 22,916,803 |
| 2028 | 10,697,290 | 23,022,058 |
| 2027 | 10,720,806 | 23,127,410 |
| 2026 | 10,742,283 | 23,229,461 |
| 2025 | 10,886,878 | 23,331,886 |
| 2024 | 10,905,028 | 23,410,331 |
| 2023 | 10,864,042 | 23,342,541 |
| 2022 | 10,672,118 | 23,319,977 |
| 2021 | 10,505,772 | 23,468,275 |
| 2020 | 10,697,858 | 23,582,179 |
| 2019 | 10,671,870 | 23,596,027 |
| 2018 | 10,629,928 | 23,580,080 |
| 2017 | 10,594,438 | 23,555,522 |
| 2016 | 10,566,332 | 23,515,945 |
| 2015 | 10,546,059 | 23,462,914 |
| 2014 | 10,525,347 | 23,403,635 |
| 2013 | 10,514,272 | 23,344,670 |
| 2012 | 10,510,785 | 23,270,367 |
| 2011 | 10,496,088 | 23,193,518 |
| 2010 | 10,474,410 | 23,140,948 |
| 2009 | 10,443,936 | 23,078,402 |
| 2008 | 10,384,603 | 22,997,696 |
| 2007 | 10,298,828 | 22,917,444 |
| 2006 | 10,238,905 | 22,823,455 |
| 2005 | 10,211,216 | 22,729,753 |
| 2004 | 10,197,101 | 22,646,836 |
| 2003 | 10,193,998 | 22,562,663 |
| 2002 | 10,196,916 | 22,463,172 |
| 2001 | 10,216,605 | 22,341,120 |
| 2000 | 10,255,063 | 22,184,530 |
| 1999 | 10,283,860 | 22,010,489 |
| 1998 | 10,294,373 | 21,835,703 |
| 1997 | 10,304,131 | 21,634,124 |
| 1996 | 10,315,241 | 21,441,432 |
| 1995 | 10,327,253 | 21,267,653 |
| 1994 | 10,333,587 | 21,086,645 |
| 1993 | 10,329,855 | 20,899,019 |
| 1992 | 10,319,123 | 20,704,227 |
| 1991 | 10,308,578 | 20,503,568 |
| 1990 | 10,333,355 | 20,278,946 |
| 1989 | 10,361,068 | 20,055,492 |
| 1988 | 10,355,276 | 19,839,704 |
| 1987 | 10,347,318 | 19,617,046 |
| 1986 | 10,342,227 | 19,411,454 |
| 1985 | 10,337,118 | 19,191,510 |
| 1984 | 10,330,213 | 18,929,866 |
| 1983 | 10,323,856 | 18,653,146 |
| 1982 | 10,314,826 | 18,354,855 |
| 1981 | 10,300,591 | 18,029,982 |
| 1980 | 10,304,193 | 17,704,538 |
| 1979 | 10,292,341 | 17,372,779 |
| 1978 | 10,242,098 | 17,042,272 |
| 1977 | 10,186,755 | 16,730,895 |
| 1976 | 10,125,939 | 16,401,413 |
| 1975 | 10,058,620 | 16,075,128 |
| 1974 | 9,988,459 | 15,784,817 |
| 1973 | 9,922,266 | 15,505,121 |
| 1972 | 9,867,632 | 15,220,495 |
| 1971 | 9,826,815 | 14,913,564 |
| 1970 | 9,858,071 | 14,582,944 |
| 1969 | 9,896,580 | 14,068,984 |
| 1968 | 9,876,346 | 13,548,537 |
| 1967 | 9,852,899 | 13,210,344 |
| 1966 | 9,821,040 | 12,874,153 |
| 1965 | 9,779,358 | 12,511,863 |
| 1964 | 9,727,804 | 12,137,143 |
| 1963 | 9,670,685 | 11,762,101 |
| 1962 | 9,624,660 | 11,392,513 |
| 1961 | 9,586,651 | 11,030,385 |
| 1960 | 9,602,006 | 10,667,705 |
Data sources: United Nations | World Population Prospects (2026–2100, retrieved 2026-07-08); National Statistics, Taiwan (1960–2025, retrieved 2026-07-08); World Bank | Health (1960–2025, retrieved 2026-07-08).
GeoRank.org/population/czech-republic/taiwan | CC BY 
From 2006 to 2016, the population of the Czech Republic increased by 327,427 people (a 3.2% growth), while Taiwan gained 692,490 people (a 3.03% growth).
For the next 10 years, from 2016 to 2026, the Czech Republic gained 175,951 people (a 1.67% growth), while Taiwan's population decreased by 286,484 people (a 1.22% decline).
The Czech Republic was ranked 80th most populous country in 2006 and is 92nd in 2026. Taiwan was ranked 49th in 2006 and ranked 60th now.
The UN's World Population Prospects forecasts that in 24 years (in 2050) the Czech Republic's population will shrink by 6.62% to 10,030,910 people with a rank change from 92nd to 98th. The population of Taiwan will decrease by 15.3% to 19,677,203 people and rank change from 60th to 76th.
Both countries are in a period of decline and in 50 years are projected to lose 16.9% of the population in the Czech Republic and 39.9% in Taiwan.
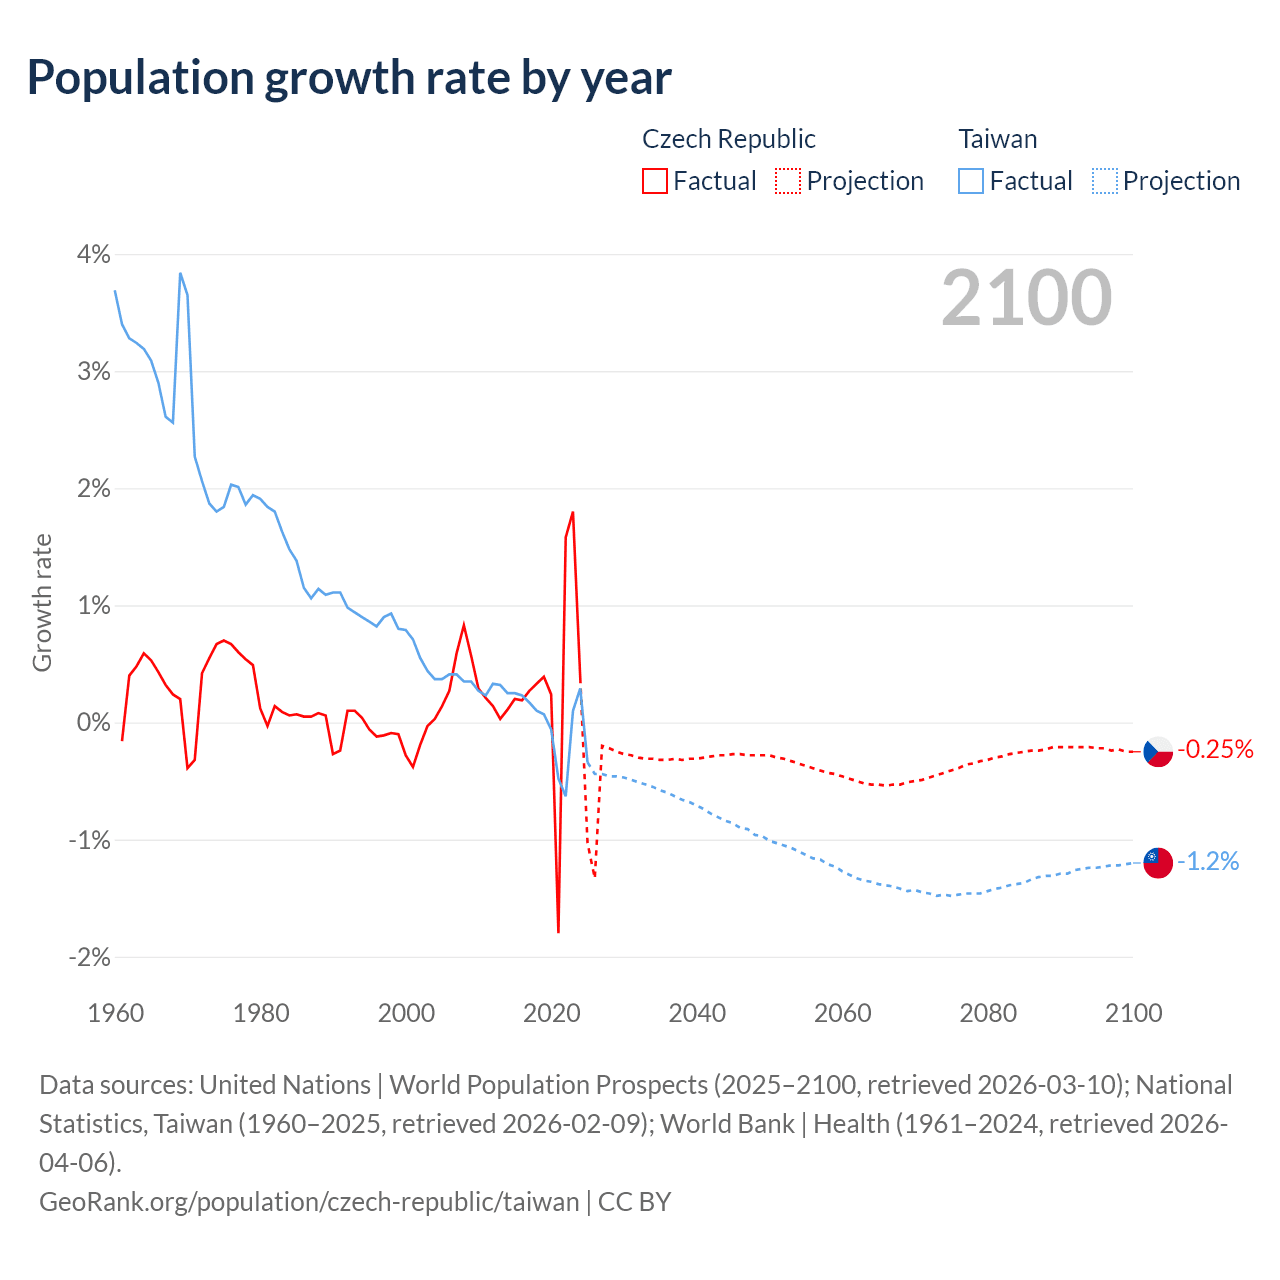
Population growth rate by year
| Year | Growth rate | |
|---|---|---|
|
Czech Republic
|
Taiwan
|
|
| 2100 | -0.25% | -1.2% |
| 2099 | -0.25% | -1.21% |
| 2098 | -0.23% | -1.22% |
| 2097 | -0.24% | -1.22% |
| 2096 | -0.22% | -1.23% |
| 2095 | -0.22% | -1.24% |
| 2094 | -0.21% | -1.24% |
| 2093 | -0.21% | -1.25% |
| 2092 | -0.21% | -1.26% |
| 2091 | -0.21% | -1.29% |
| 2090 | -0.21% | -1.29% |
| 2089 | -0.21% | -1.31% |
| 2088 | -0.23% | -1.31% |
| 2087 | -0.24% | -1.32% |
| 2086 | -0.24% | -1.34% |
| 2085 | -0.25% | -1.37% |
| 2084 | -0.26% | -1.38% |
| 2083 | -0.27% | -1.39% |
| 2082 | -0.29% | -1.41% |
| 2081 | -0.3% | -1.42% |
| 2080 | -0.32% | -1.44% |
| 2079 | -0.33% | -1.46% |
| 2078 | -0.35% | -1.46% |
| 2077 | -0.36% | -1.46% |
| 2076 | -0.39% | -1.47% |
| 2075 | -0.41% | -1.48% |
| 2074 | -0.43% | -1.47% |
| 2073 | -0.45% | -1.48% |
| 2072 | -0.47% | -1.46% |
| 2071 | -0.49% | -1.45% |
| 2070 | -0.5% | -1.43% |
| 2069 | -0.51% | -1.44% |
| 2068 | -0.53% | -1.42% |
| 2067 | -0.53% | -1.4% |
| 2066 | -0.54% | -1.39% |
| 2065 | -0.53% | -1.38% |
| 2064 | -0.53% | -1.36% |
| 2063 | -0.52% | -1.35% |
| 2062 | -0.5% | -1.33% |
| 2061 | -0.48% | -1.3% |
| 2060 | -0.46% | -1.27% |
| 2059 | -0.44% | -1.23% |
| 2058 | -0.43% | -1.21% |
| 2057 | -0.41% | -1.17% |
| 2056 | -0.39% | -1.16% |
| 2055 | -0.37% | -1.13% |
| 2054 | -0.35% | -1.1% |
| 2053 | -0.33% | -1.07% |
| 2052 | -0.31% | -1.05% |
| 2051 | -0.3% | -1.03% |
| 2050 | -0.28% | -1.01% |
| 2049 | -0.28% | -0.97% |
| 2048 | -0.28% | -0.96% |
| 2047 | -0.28% | -0.91% |
| 2046 | -0.27% | -0.9% |
| 2045 | -0.27% | -0.86% |
| 2044 | -0.28% | -0.84% |
| 2043 | -0.28% | -0.81% |
| 2042 | -0.29% | -0.78% |
| 2041 | -0.3% | -0.74% |
| 2040 | -0.31% | -0.71% |
| 2039 | -0.31% | -0.68% |
| 2038 | -0.32% | -0.66% |
| 2037 | -0.31% | -0.63% |
| 2036 | -0.32% | -0.6% |
| 2035 | -0.32% | -0.58% |
| 2034 | -0.31% | -0.55% |
| 2033 | -0.31% | -0.53% |
| 2032 | -0.3% | -0.51% |
| 2031 | -0.28% | -0.49% |
| 2030 | -0.27% | -0.47% |
| 2029 | -0.25% | -0.46% |
| 2028 | -0.22% | -0.46% |
| 2027 | -0.2% | -0.44% |
| 2026 | -1.33% | -0.44% |
| 2025 | -0.17% | -0.34% |
| 2024 | 0.38% | 0.29% |
| 2023 | 1.8% | 0.1% |
| 2022 | 1.58% | -0.63% |
| 2021 | -1.8% | -0.48% |
| 2020 | 0.24% | -0.06% |
| 2019 | 0.39% | 0.07% |
| 2018 | 0.33% | 0.1% |
| 2017 | 0.27% | 0.17% |
| 2016 | 0.19% | 0.23% |
| 2015 | 0.2% | 0.25% |
| 2014 | 0.11% | 0.25% |
| 2013 | 0.03% | 0.32% |
| 2012 | 0.14% | 0.33% |
| 2011 | 0.21% | 0.23% |
| 2010 | 0.29% | 0.27% |
| 2009 | 0.57% | 0.35% |
| 2008 | 0.83% | 0.35% |
| 2007 | 0.59% | 0.41% |
| 2006 | 0.27% | 0.41% |
| 2005 | 0.14% | 0.37% |
| 2004 | 0.03% | 0.37% |
| 2003 | -0.03% | 0.44% |
| 2002 | -0.19% | 0.55% |
| 2001 | -0.38% | 0.71% |
| 2000 | -0.28% | 0.79% |
| 1999 | -0.1% | 0.8% |
| 1998 | -0.09% | 0.93% |
| 1997 | -0.11% | 0.9% |
| 1996 | -0.12% | 0.82% |
| 1995 | -0.06% | 0.86% |
| 1994 | 0.04% | 0.9% |
| 1993 | 0.1% | 0.94% |
| 1992 | 0.1% | 0.98% |
| 1991 | -0.24% | 1.11% |
| 1990 | -0.27% | 1.11% |
| 1989 | 0.06% | 1.09% |
| 1988 | 0.08% | 1.14% |
| 1987 | 0.05% | 1.06% |
| 1986 | 0.05% | 1.15% |
| 1985 | 0.07% | 1.38% |
| 1984 | 0.06% | 1.48% |
| 1983 | 0.09% | 1.63% |
| 1982 | 0.14% | 1.8% |
| 1981 | -0.03% | 1.84% |
| 1980 | 0.12% | 1.91% |
| 1979 | 0.49% | 1.94% |
| 1978 | 0.54% | 1.86% |
| 1977 | 0.6% | 2.01% |
| 1976 | 0.67% | 2.03% |
| 1975 | 0.7% | 1.84% |
| 1974 | 0.67% | 1.8% |
| 1973 | 0.55% | 1.87% |
| 1972 | 0.42% | 2.06% |
| 1971 | -0.32% | 2.27% |
| 1970 | -0.39% | 3.65% |
| 1969 | 0.2% | 3.84% |
| 1968 | 0.24% | 2.56% |
| 1967 | 0.32% | 2.61% |
| 1966 | 0.43% | 2.9% |
| 1965 | 0.53% | 3.09% |
| 1964 | 0.59% | 3.19% |
| 1963 | 0.48% | 3.24% |
| 1962 | 0.4% | 3.28% |
| 1961 | -0.16% | 3.4% |
| 1960 | - | 3.69% |
Data sources: United Nations | World Population Prospects (2026–2100, retrieved 2026-07-08); National Statistics, Taiwan (1960–2025, retrieved 2026-07-08); World Bank | Health (1961–2025, retrieved 2026-07-08).
GeoRank.org/population/czech-republic/taiwan | CC BY
In 2025, the population of the Czech Republic declined by 0.17%, while Taiwan's population declined by 0.34%.
Live population counters
|
Czech Republic
|
Taiwan
|
|
|---|---|---|
| Current population |
10742283
|
23229461
|
| Population rank | 92/197 | 60/197 |
| Percent of world population | 0.13% | 0.28% |
| One net population change |
29 minutes
|
6.72 minutes
|
| One birth every |
6.26 minutes
|
3.9 minutes
|
| One death every |
4.68 minutes
|
2.6 minutes
|
| Daily growth/decline | -50 | -215 |
| Annual growth/decline | -18,150 | -78,445 |
| Annual growth/decline rate | -0.17% | -0.34% |
| Population growth rate rank | 173/197 | 178/197 |
| One migration net change every |
4.7 minutes
|
11.2 minutes
|
| Annual migration change | -112,188 | +47,029 |
| Net migration rank | 182/196 | 23/196 |
| Foreign-born residents | 1,025,199 | n/a |
| Foreign-born residents rank | 59/195 | |
| Foreign-born share of population | 9.5% | n/a |
| Foreign-born share rank | 67/195 |
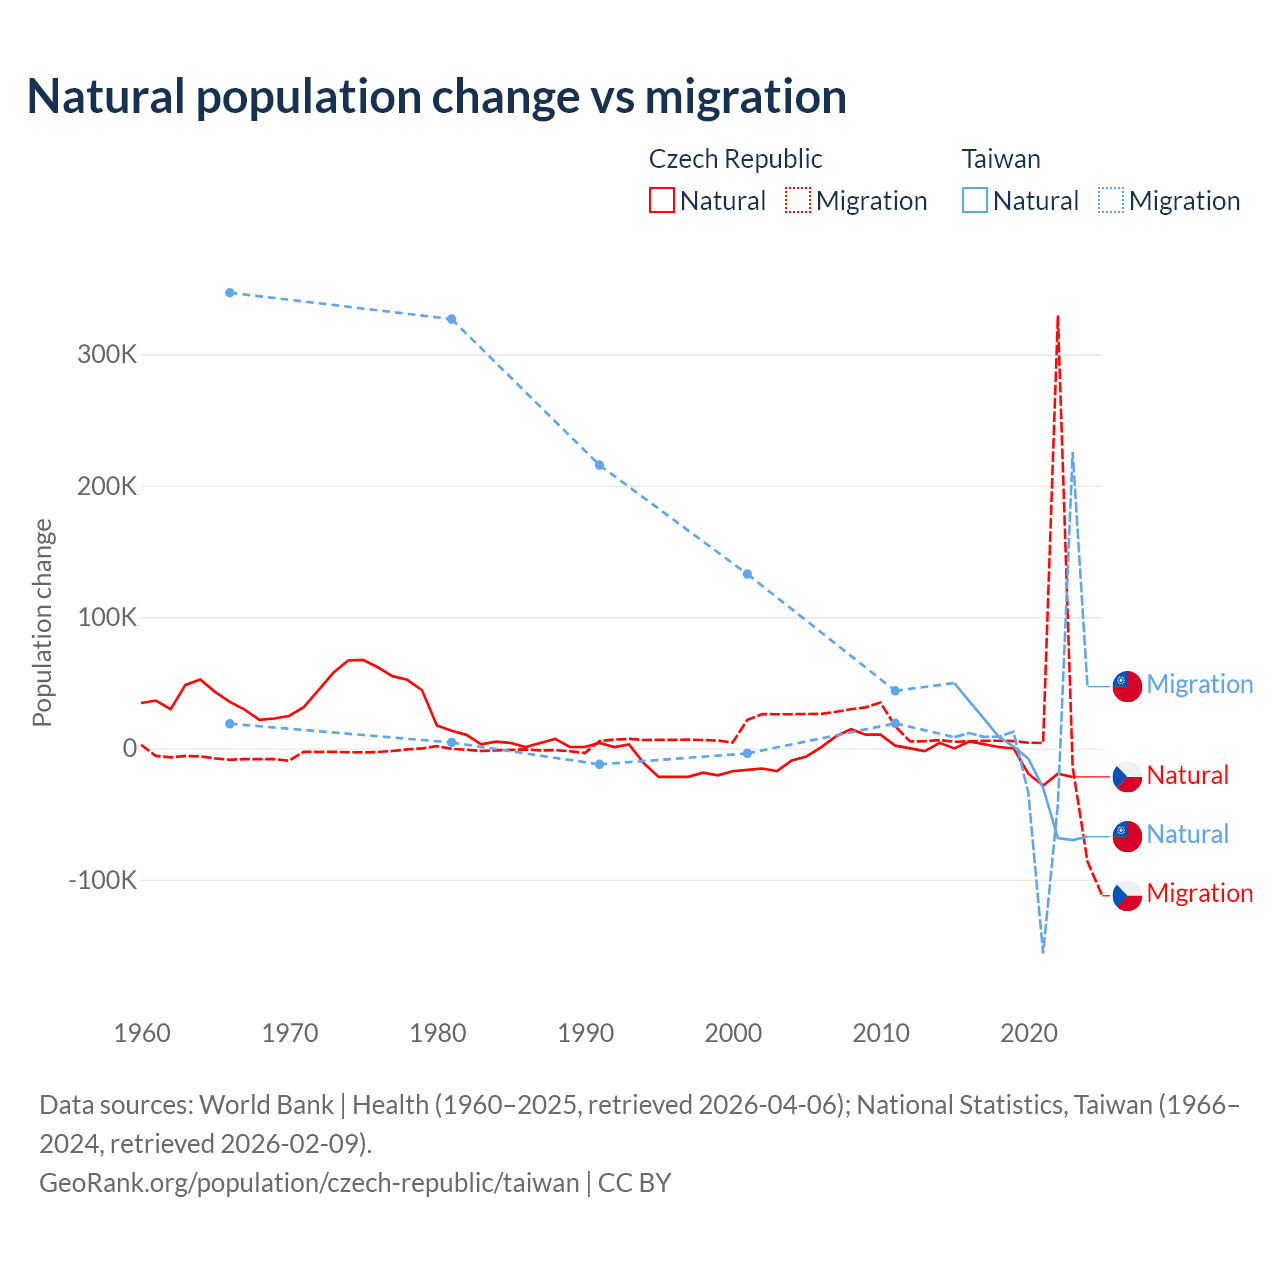
Natural population change vs migration
| Year | Population change | |||
|---|---|---|---|---|
|
Czech Republic
|
Taiwan
|
|||
| Natural | Migration | Natural | Migration | |
| 2025 | - | -112,188 | - | - |
| 2024 | -28,353 | -86,169 | -67,188 | 47,029 |
| 2023 | -21,729 | -14,638 | -69,794 | 225,599 |
| 2022 | -19,209 | 329,739 | -68,327 | -42,430 |
| 2021 | -28,365 | 4,111 | -30,039 | -156,010 |
| 2020 | -19,257 | 4,336 | -7,782 | -33,978 |
| 2019 | 0 | 5,553 | 1,416 | 12,718 |
| 2018 | 1,063 | 5,849 | 8,725 | 8,888 |
| 2017 | 3,178 | 5,747 | 22,613 | 8,809 |
| 2016 | 5,283 | 5,465 | 35,980 | 11,707 |
| 2015 | 0 | 5,037 | 49,741 | 8,581 |
| 2014 | 4,210 | 6,303 | - | - |
| 2013 | -2,103 | 5,427 | - | - |
| 2012 | 0 | 5,347 | - | - |
| 2011 | 2,099 | 16,841 | 43,836 | 19,077 |
| 2010 | 10,475 | 34,927 | - | - |
| 2009 | 10,444 | 31,270 | - | - |
| 2008 | 14,538 | 29,813 | - | - |
| 2007 | 9,268 | 27,887 | - | - |
| 2006 | 1,024 | 26,259 | - | - |
| 2005 | -6,126 | 26,203 | - | - |
| 2004 | -9,177 | 26,030 | - | - |
| 2003 | -17,330 | 25,997 | - | - |
| 2002 | -15,296 | 26,089 | - | - |
| 2001 | -16,347 | 21,749 | 132,707 | -3,811 |
| 2000 | -17,433 | 4,420 | - | - |
| 1999 | -20,568 | 5,965 | - | - |
| 1998 | -18,530 | 6,374 | - | - |
| 1997 | -21,639 | 6,664 | - | - |
| 1996 | -21,662 | 6,539 | - | - |
| 1995 | -21,687 | 6,459 | - | - |
| 1994 | -11,367 | 6,401 | - | - |
| 1993 | 3,099 | 7,197 | - | - |
| 1992 | 1,032 | 6,718 | - | - |
| 1991 | 4,124 | 5,568 | 215,698 | -12,128 |
| 1990 | 1,034 | -3,529 | - | - |
| 1989 | 1,036 | -2,175 | - | - |
| 1988 | 7,249 | -1,359 | - | - |
| 1987 | 4,138 | -1,514 | - | - |
| 1986 | 1,034 | -771 | - | - |
| 1985 | 4,135 | -1,173 | - | - |
| 1984 | 5,165 | -1,481 | - | - |
| 1983 | 3,097 | -1,971 | - | - |
| 1982 | 10,315 | -1,018 | - | - |
| 1981 | 13,391 | -372 | 326,883 | 4,508 |
| 1980 | 17,517 | 1,738 | - | - |
| 1979 | 44,257 | -13 | - | - |
| 1978 | 52,234 | -795 | - | - |
| 1977 | 55,009 | -1,968 | - | - |
| 1976 | 61,768 | -2,727 | - | - |
| 1975 | 67,393 | -3,057 | - | - |
| 1974 | 66,923 | -2,919 | - | - |
| 1973 | 57,549 | -2,625 | - | - |
| 1972 | 44,404 | -2,755 | - | - |
| 1971 | 31,445 | -2,598 | - | - |
| 1970 | 24,646 | -9,353 | - | - |
| 1969 | 22,762 | -8,133 | - | - |
| 1968 | 21,728 | -8,111 | - | - |
| 1967 | 29,558 | -8,137 | - | - |
| 1966 | 35,355 | -8,675 | 346,958 | 18,774 |
| 1965 | 43,029 | -7,545 | - | - |
| 1964 | 52,531 | -6,122 | - | - |
| 1963 | 48,353 | -5,753 | - | - |
| 1962 | 29,836 | -6,886 | - | - |
| 1961 | 36,430 | -5,712 | - | - |
| 1960 | 34,567 | 2,748 | - | - |
Data sources: World Bank | Health (1960–2025, retrieved 2026-07-08); National Statistics, Taiwan (1966–2024, retrieved 2026-07-08).
GeoRank.org/population/czech-republic/taiwan | CC BY
Over the last 10 years, 28.8% of the population change in the Czech Republic is from natural causes (a loss of 107,389 people) and 71.2% is from migration (a gain of 265,030 people). In Taiwan 57.8% is from natural causes (a loss of 124,655 people) and 42.2% is from migration (a gain of 90,913 people).
Biggest cities by population
|
Czech Republic
|
|
|---|---|
| City | Population |
| Prague | 1.4M |
| Brno | 403K |
| Ostrava | 283K |
| Plzen | 188K |
| Liberec | 108K |
| Olomouc | 103K |
| Ceske Budejovice | 97.2K |
| Hradec Kralove | 94.3K |
| Pardubice | 92.3K |
| Usti nad Labem | 90.9K |
|
Taiwan
|
|
|---|---|
| City | Population |
| New Taipei | 4.04M |
| Taichung | 2.87M |
| Kaohsiung | 2.71M |
| Taipei | 2.43M |
| Taoyuan | 2.36M |
| Tainan | 1.85M |
| Hsinchu | 456K |
| Keelung | 359K |
| Chiayi | 262K |
| Zhubei | 221K |
Compare countries by 7 more topics
Population differences between the Czech Republic and Taiwan
|
Czech Republic
|
Taiwan
|
|
|---|---|---|
| Life expectancy | 80.3 years | 81.1 years |
| Average age | 43.4 years | 44.6 years |
| Median age | 44.8 years | 45.7 years |
| Male:Female ratio | 49.3:50.7 | 49.2:50.8 |
| Fertility rate | 1.36 births per woman | 0.89 births per woman |
| Population density | 361 ppl/mi² | 1,662 ppl/mi² |
Population map with other countries
Data sources: World Bank | Health (1960–2025, retrieved 2026-07-08); United Nations | World Population Prospects (1960–2026, retrieved 2026-07-08); U.S. Census Bureau (1960–2025, retrieved 2026-07-08); National Statistics, Taiwan (1960–2025, retrieved 2026-07-08); Central Intelligence Agency (CIA) (2000–2019, retrieved 2026-07-08).
GeoRank.org/population/czech-republic/taiwan | CC BY
Help us show the world through your eyes
Share a photo of your city and help others discover what it looks like to live there. Your contribution makes our data come alive.
Data sources:
- World Bank | Health (1960–2025, retrieved 2026-07-08)
- United Nations | World Population Prospects (1960–2100, retrieved 2026-07-08)
- National Statistics, Taiwan (1960–2026, retrieved 2026-07-08)
- U.S. Census Bureau (1960–2025, retrieved 2026-07-08)
- Wikidata (2026, retrieved 2026-07-08)
- Central Intelligence Agency (CIA) (2000–2019, retrieved 2026-07-08)
Creative Commons Attribution (CC BY) — you’re free to copy, share, remix, adapt, and use even commercially as long as you give appropriate credit and clearly indicate if you made changes. Other sources may be subject to different license terms.