The latest officially reported population of Albania was 2,349,580 in 2025 vs 2,822,093 people in the Gambia in 2025. In 2026, based on the adjusted UN estimation, the current Albania's population is 2,332,078 people compared to 2,916,990 in the Gambia.
Population statistics:
- The Gambia's population is 1.25 times bigger than Albania's.
- Albania is ranked the 144th most populous country in the world, while the Gambia is the 138th.
- The countries together account for 0.06% of the world: 0.03% for Albania vs 0.04% for the Gambia.
- For the last 10 years, Albania has had an average growth rate of -1.5% per year vs +2.44% in the Gambia.
- Since 2006, the population of Albania has decreased from 2.99M people to 2.33M (22.1% decline), while the Gambia has grown from 1.72M to 2.92M (70.1% growth).
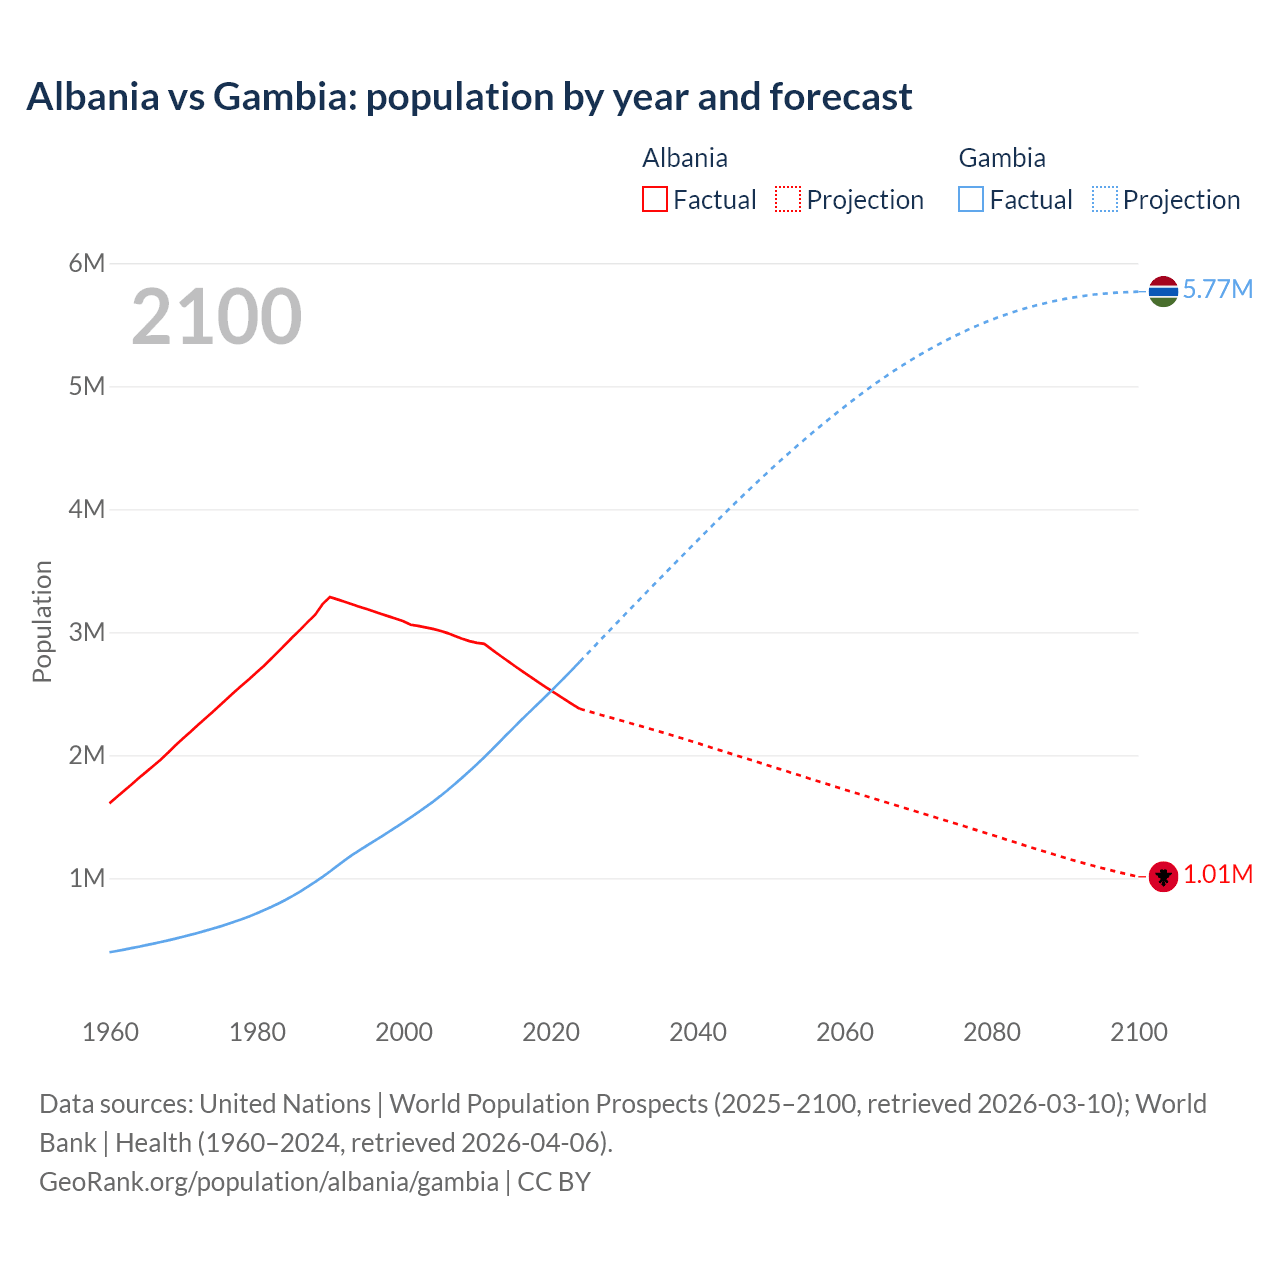
Albania vs Gambia: population by year and forecast
| Year | Population | |
|---|---|---|
 Albania
|
 Gambia
|
|
| 2100 | 1,007,401 | 5,766,099 |
| 2099 | 1,020,801 | 5,764,092 |
| 2098 | 1,034,604 | 5,761,403 |
| 2097 | 1,048,803 | 5,758,064 |
| 2096 | 1,063,434 | 5,753,864 |
| 2095 | 1,078,498 | 5,748,821 |
| 2094 | 1,094,070 | 5,742,977 |
| 2093 | 1,110,138 | 5,735,465 |
| 2092 | 1,126,699 | 5,727,035 |
| 2091 | 1,143,691 | 5,717,851 |
| 2090 | 1,161,098 | 5,707,322 |
| 2089 | 1,178,925 | 5,695,590 |
| 2088 | 1,197,085 | 5,682,547 |
| 2087 | 1,215,294 | 5,668,415 |
| 2086 | 1,233,850 | 5,653,552 |
| 2085 | 1,252,611 | 5,637,112 |
| 2084 | 1,271,550 | 5,619,538 |
| 2083 | 1,290,612 | 5,600,932 |
| 2082 | 1,309,713 | 5,581,062 |
| 2081 | 1,328,652 | 5,559,781 |
| 2080 | 1,347,569 | 5,537,312 |
| 2079 | 1,366,124 | 5,513,586 |
| 2078 | 1,384,697 | 5,488,256 |
| 2077 | 1,403,421 | 5,461,819 |
| 2076 | 1,421,800 | 5,434,380 |
| 2075 | 1,440,364 | 5,405,474 |
| 2074 | 1,459,118 | 5,375,255 |
| 2073 | 1,477,286 | 5,343,873 |
| 2072 | 1,495,509 | 5,311,755 |
| 2071 | 1,513,666 | 5,278,538 |
| 2070 | 1,531,671 | 5,243,773 |
| 2069 | 1,549,614 | 5,207,961 |
| 2068 | 1,567,665 | 5,170,739 |
| 2067 | 1,585,847 | 5,132,640 |
| 2066 | 1,603,642 | 5,093,072 |
| 2065 | 1,621,885 | 5,051,871 |
| 2064 | 1,640,153 | 5,009,758 |
| 2063 | 1,658,561 | 4,966,686 |
| 2062 | 1,676,857 | 4,922,343 |
| 2061 | 1,695,153 | 4,876,639 |
| 2060 | 1,713,670 | 4,830,317 |
| 2059 | 1,732,288 | 4,783,233 |
| 2058 | 1,750,766 | 4,735,557 |
| 2057 | 1,769,493 | 4,686,764 |
| 2056 | 1,788,106 | 4,637,220 |
| 2055 | 1,807,040 | 4,586,935 |
| 2054 | 1,826,070 | 4,535,328 |
| 2053 | 1,845,139 | 4,483,472 |
| 2052 | 1,864,095 | 4,430,621 |
| 2051 | 1,882,592 | 4,376,942 |
| 2050 | 1,901,517 | 4,322,480 |
| 2049 | 1,920,402 | 4,267,374 |
| 2048 | 1,939,175 | 4,211,530 |
| 2047 | 1,957,603 | 4,154,844 |
| 2046 | 1,976,486 | 4,097,814 |
| 2045 | 1,995,320 | 4,040,118 |
| 2044 | 2,013,616 | 3,981,892 |
| 2043 | 2,032,321 | 3,923,058 |
| 2042 | 2,050,944 | 3,863,611 |
| 2041 | 2,069,916 | 3,804,282 |
| 2040 | 2,088,692 | 3,744,293 |
| 2039 | 2,107,936 | 3,684,045 |
| 2038 | 2,126,229 | 3,623,285 |
| 2037 | 2,144,493 | 3,562,776 |
| 2036 | 2,162,466 | 3,502,038 |
| 2035 | 2,179,783 | 3,441,138 |
| 2034 | 2,197,495 | 3,380,088 |
| 2033 | 2,214,803 | 3,318,743 |
| 2032 | 2,231,467 | 3,257,194 |
| 2031 | 2,248,104 | 3,195,735 |
| 2030 | 2,265,270 | 3,134,115 |
| 2029 | 2,281,932 | 3,072,145 |
| 2028 | 2,298,632 | 3,009,805 |
| 2027 | 2,314,980 | 2,947,443 |
| 2026 | 2,332,078 | 2,884,828 |
| 2025 | 2,349,580 | 2,822,093 |
| 2024 | 2,377,128 | 2,759,988 |
| 2023 | 2,411,658 | 2,697,845 |
| 2022 | 2,451,636 | 2,636,470 |
| 2021 | 2,489,762 | 2,576,010 |
| 2020 | 2,528,480 | 2,515,733 |
| 2019 | 2,567,801 | 2,456,844 |
| 2018 | 2,607,733 | 2,399,632 |
| 2017 | 2,648,285 | 2,342,189 |
| 2016 | 2,689,469 | 2,283,769 |
| 2015 | 2,731,293 | 2,224,529 |
| 2014 | 2,773,767 | 2,164,528 |
| 2013 | 2,816,902 | 2,103,820 |
| 2012 | 2,860,708 | 2,043,094 |
| 2011 | 2,905,195 | 1,983,784 |
| 2010 | 2,913,021 | 1,926,630 |
| 2009 | 2,927,519 | 1,871,422 |
| 2008 | 2,947,314 | 1,817,852 |
| 2007 | 2,970,017 | 1,765,774 |
| 2006 | 2,992,547 | 1,715,275 |
| 2005 | 3,011,487 | 1,667,037 |
| 2004 | 3,026,939 | 1,621,312 |
| 2003 | 3,039,616 | 1,577,611 |
| 2002 | 3,051,010 | 1,535,691 |
| 2001 | 3,060,173 | 1,495,011 |
| 2000 | 3,089,027 | 1,455,084 |
| 1999 | 3,108,778 | 1,415,779 |
| 1998 | 3,128,530 | 1,376,987 |
| 1997 | 3,148,281 | 1,338,889 |
| 1996 | 3,168,033 | 1,301,410 |
| 1995 | 3,187,784 | 1,264,313 |
| 1994 | 3,207,536 | 1,227,226 |
| 1993 | 3,227,287 | 1,188,365 |
| 1992 | 3,247,039 | 1,145,582 |
| 1991 | 3,266,790 | 1,099,959 |
| 1990 | 3,286,542 | 1,054,696 |
| 1989 | 3,227,943 | 1,011,357 |
| 1988 | 3,142,336 | 970,160 |
| 1987 | 3,083,605 | 931,091 |
| 1986 | 3,022,635 | 894,019 |
| 1985 | 2,964,762 | 858,874 |
| 1984 | 2,904,429 | 825,631 |
| 1983 | 2,843,960 | 794,525 |
| 1982 | 2,784,278 | 765,753 |
| 1981 | 2,726,056 | 739,125 |
| 1980 | 2,671,997 | 713,913 |
| 1979 | 2,617,832 | 689,781 |
| 1978 | 2,566,266 | 667,103 |
| 1977 | 2,513,546 | 645,770 |
| 1976 | 2,458,526 | 625,667 |
| 1975 | 2,404,831 | 606,821 |
| 1974 | 2,350,124 | 589,085 |
| 1973 | 2,296,752 | 571,991 |
| 1972 | 2,243,126 | 555,370 |
| 1971 | 2,187,853 | 539,388 |
| 1970 | 2,135,479 | 524,105 |
| 1969 | 2,081,695 | 509,440 |
| 1968 | 2,022,272 | 495,269 |
| 1967 | 1,965,598 | 481,588 |
| 1966 | 1,914,573 | 468,516 |
| 1965 | 1,864,791 | 455,952 |
| 1964 | 1,814,135 | 443,687 |
| 1963 | 1,762,621 | 431,757 |
| 1962 | 1,711,319 | 420,163 |
| 1961 | 1,659,800 | 408,930 |
| 1960 | 1,608,800 | 398,060 |
Data sources: United Nations | World Population Prospects (2026–2100, retrieved 2026-07-08); World Bank | Health (1960–2025, retrieved 2026-07-08).
GeoRank.org/population/albania/gambia | CC BY 
From 2006 to 2016, the population of Albania decreased by 303,078 people (a 10.1% decline), while the Gambia gained 568,494 people (a 33.1% growth).
For the next 10 years, from 2016 to 2026, Albania lost 357,391 people (a 13.3% decline), while the Gambia's population increased by 633,221 people (a 27.7% growth).
Albania was ranked 133rd most populous country in 2006 and is 144th in 2026. The Gambia was ranked 146th in 2006 and ranked 138th now.
The UN's World Population Prospects forecasts that in 24 years (in 2050) Albania's population will shrink by 18.5% to 1,901,517 people with a rank change from 144th to 148th. The population of the Gambia will increase by 48.2% to 4,322,480 people and rank change from 138th to 132nd.
The Gambia is projected to reach its peak in 2100 at 5.77M people, while Albania's population already peaked in 1990 at 3.29M people and is projected to decrease to 1.01M people by 2100.
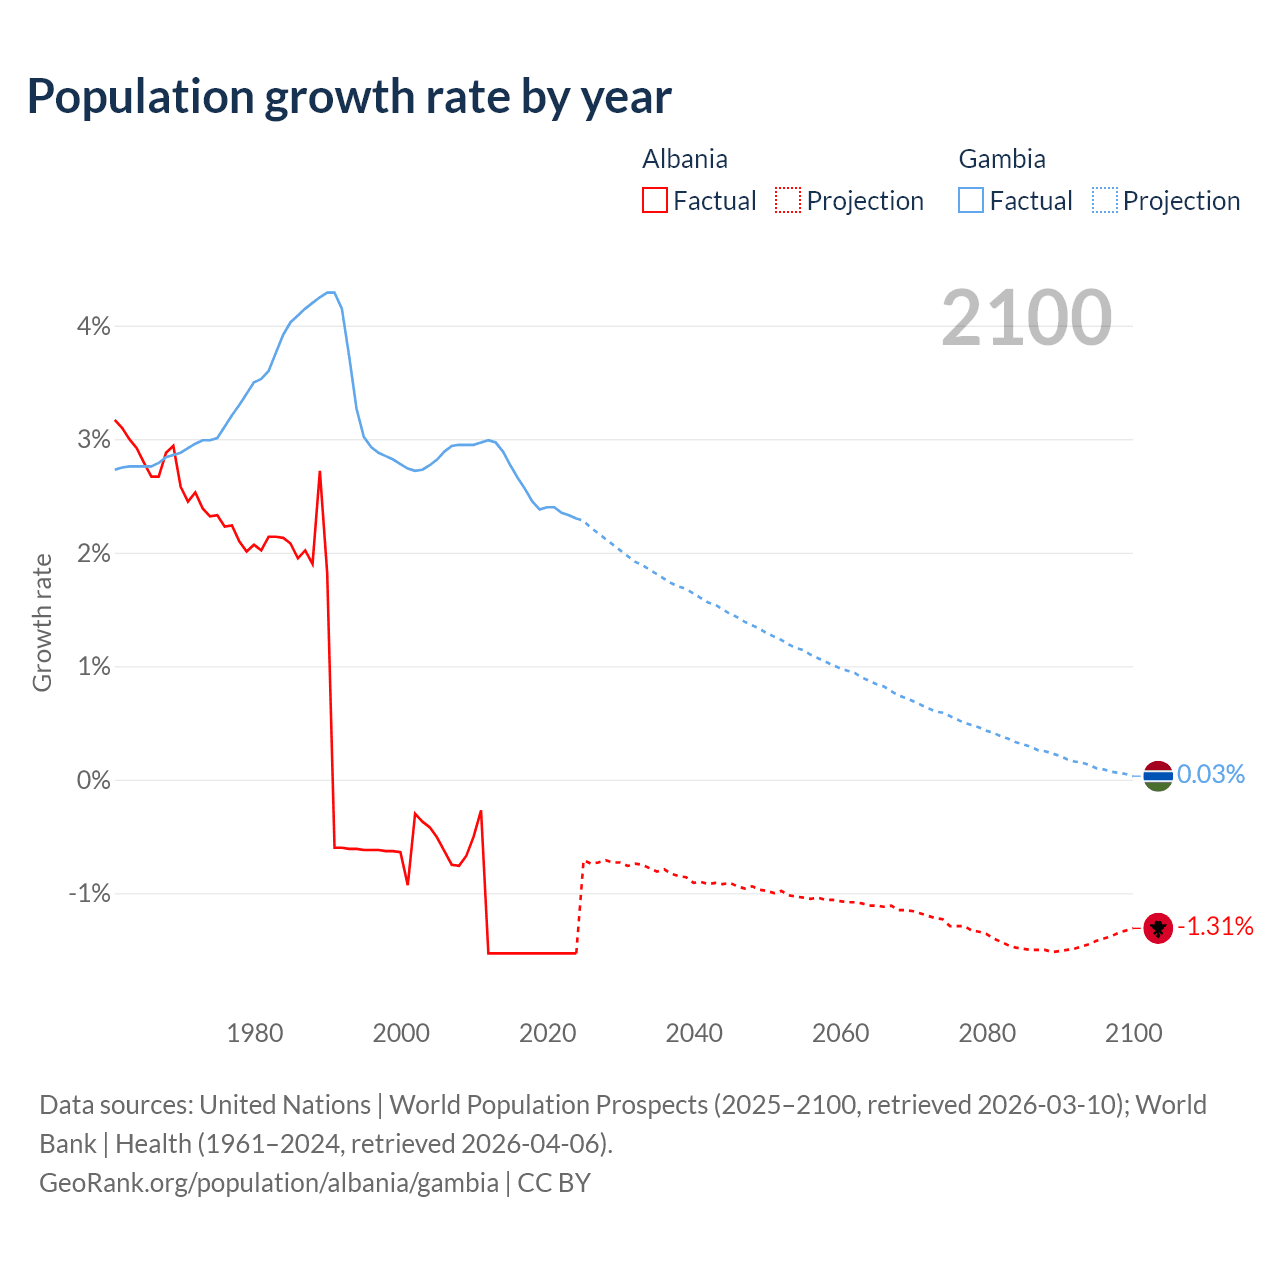
Population growth rate by year
| Year | Growth rate | |
|---|---|---|
|
Albania
|
Gambia
|
|
| 2100 | -1.31% | 0.03% |
| 2099 | -1.33% | 0.05% |
| 2098 | -1.35% | 0.06% |
| 2097 | -1.38% | 0.07% |
| 2096 | -1.4% | 0.09% |
| 2095 | -1.42% | 0.1% |
| 2094 | -1.45% | 0.13% |
| 2093 | -1.47% | 0.15% |
| 2092 | -1.49% | 0.16% |
| 2091 | -1.5% | 0.18% |
| 2090 | -1.51% | 0.21% |
| 2089 | -1.52% | 0.23% |
| 2088 | -1.5% | 0.25% |
| 2087 | -1.5% | 0.26% |
| 2086 | -1.5% | 0.29% |
| 2085 | -1.49% | 0.31% |
| 2084 | -1.48% | 0.33% |
| 2083 | -1.46% | 0.36% |
| 2082 | -1.43% | 0.38% |
| 2081 | -1.4% | 0.41% |
| 2080 | -1.36% | 0.43% |
| 2079 | -1.34% | 0.46% |
| 2078 | -1.33% | 0.48% |
| 2077 | -1.29% | 0.5% |
| 2076 | -1.29% | 0.53% |
| 2075 | -1.29% | 0.56% |
| 2074 | -1.23% | 0.59% |
| 2073 | -1.22% | 0.6% |
| 2072 | -1.2% | 0.63% |
| 2071 | -1.18% | 0.66% |
| 2070 | -1.16% | 0.69% |
| 2069 | -1.15% | 0.72% |
| 2068 | -1.15% | 0.74% |
| 2067 | -1.11% | 0.78% |
| 2066 | -1.12% | 0.82% |
| 2065 | -1.11% | 0.84% |
| 2064 | -1.11% | 0.87% |
| 2063 | -1.09% | 0.9% |
| 2062 | -1.08% | 0.94% |
| 2061 | -1.08% | 0.96% |
| 2060 | -1.07% | 0.98% |
| 2059 | -1.06% | 1.01% |
| 2058 | -1.06% | 1.04% |
| 2057 | -1.04% | 1.07% |
| 2056 | -1.05% | 1.1% |
| 2055 | -1.04% | 1.14% |
| 2054 | -1.03% | 1.16% |
| 2053 | -1.02% | 1.19% |
| 2052 | -0.98% | 1.23% |
| 2051 | -1% | 1.26% |
| 2050 | -0.98% | 1.29% |
| 2049 | -0.97% | 1.33% |
| 2048 | -0.94% | 1.36% |
| 2047 | -0.96% | 1.39% |
| 2046 | -0.94% | 1.43% |
| 2045 | -0.91% | 1.46% |
| 2044 | -0.92% | 1.5% |
| 2043 | -0.91% | 1.54% |
| 2042 | -0.92% | 1.56% |
| 2041 | -0.9% | 1.6% |
| 2040 | -0.91% | 1.64% |
| 2039 | -0.86% | 1.68% |
| 2038 | -0.85% | 1.7% |
| 2037 | -0.83% | 1.73% |
| 2036 | -0.79% | 1.77% |
| 2035 | -0.81% | 1.81% |
| 2034 | -0.78% | 1.85% |
| 2033 | -0.75% | 1.89% |
| 2032 | -0.74% | 1.92% |
| 2031 | -0.76% | 1.97% |
| 2030 | -0.73% | 2.02% |
| 2029 | -0.73% | 2.07% |
| 2028 | -0.71% | 2.12% |
| 2027 | -0.73% | 2.17% |
| 2026 | -0.74% | 2.22% |
| 2025 | -1.16% | 2.25% |
| 2024 | -1.43% | 2.3% |
| 2023 | -1.63% | 2.33% |
| 2022 | -1.53% | 2.35% |
| 2021 | -1.53% | 2.4% |
| 2020 | -1.53% | 2.4% |
| 2019 | -1.53% | 2.38% |
| 2018 | -1.53% | 2.45% |
| 2017 | -1.53% | 2.56% |
| 2016 | -1.53% | 2.66% |
| 2015 | -1.53% | 2.77% |
| 2014 | -1.53% | 2.89% |
| 2013 | -1.53% | 2.97% |
| 2012 | -1.53% | 2.99% |
| 2011 | -0.27% | 2.97% |
| 2010 | -0.5% | 2.95% |
| 2009 | -0.67% | 2.95% |
| 2008 | -0.76% | 2.95% |
| 2007 | -0.75% | 2.94% |
| 2006 | -0.63% | 2.89% |
| 2005 | -0.51% | 2.82% |
| 2004 | -0.42% | 2.77% |
| 2003 | -0.37% | 2.73% |
| 2002 | -0.3% | 2.72% |
| 2001 | -0.93% | 2.74% |
| 2000 | -0.64% | 2.78% |
| 1999 | -0.63% | 2.82% |
| 1998 | -0.63% | 2.85% |
| 1997 | -0.62% | 2.88% |
| 1996 | -0.62% | 2.93% |
| 1995 | -0.62% | 3.02% |
| 1994 | -0.61% | 3.27% |
| 1993 | -0.61% | 3.73% |
| 1992 | -0.6% | 4.15% |
| 1991 | -0.6% | 4.29% |
| 1990 | 1.82% | 4.29% |
| 1989 | 2.72% | 4.25% |
| 1988 | 1.9% | 4.2% |
| 1987 | 2.02% | 4.15% |
| 1986 | 1.95% | 4.09% |
| 1985 | 2.08% | 4.03% |
| 1984 | 2.13% | 3.92% |
| 1983 | 2.14% | 3.76% |
| 1982 | 2.14% | 3.6% |
| 1981 | 2.02% | 3.53% |
| 1980 | 2.07% | 3.5% |
| 1979 | 2.01% | 3.4% |
| 1978 | 2.1% | 3.3% |
| 1977 | 2.24% | 3.21% |
| 1976 | 2.23% | 3.11% |
| 1975 | 2.33% | 3.01% |
| 1974 | 2.32% | 2.99% |
| 1973 | 2.39% | 2.99% |
| 1972 | 2.53% | 2.96% |
| 1971 | 2.45% | 2.92% |
| 1970 | 2.58% | 2.88% |
| 1969 | 2.94% | 2.86% |
| 1968 | 2.88% | 2.84% |
| 1967 | 2.67% | 2.79% |
| 1966 | 2.67% | 2.76% |
| 1965 | 2.79% | 2.76% |
| 1964 | 2.92% | 2.76% |
| 1963 | 3% | 2.76% |
| 1962 | 3.1% | 2.75% |
| 1961 | 3.17% | 2.73% |
Data sources: United Nations | World Population Prospects (2026–2100, retrieved 2026-07-08); World Bank | Health (1961–2025, retrieved 2026-07-08).
GeoRank.org/population/albania/gambia | CC BY
In 2025, the population of Albania declined by 1.16%, while the Gambia's population grew by 2.25%.
Live population counters
|
Albania
|
Gambia
|
|
|---|---|---|
| Current population |
2332078
|
2916990
|
| Population rank | 144/197 | 138/197 |
| Percent of world population | 0.03% | 0.04% |
| One net population change |
19.1 minutes
|
8.49 minutes
|
| One birth every |
21.8 minutes
|
6.38 minutes
|
| One death every |
26.1 minutes
|
30.5 minutes
|
| Daily growth/decline | -75 | +170 |
| Annual growth/decline | -27,548 | +62,105 |
| Annual growth/decline rate | -1.16% | +2.25% |
| Population growth rate rank | 194/197 | 37/197 |
| One migration net change every |
21.8 minutes
|
2.94 hours
|
| Annual migration change | -24,230 | -2,984 |
| Net migration rank | 156/196 | 107/196 |
| Foreign-born residents | 46,377 | 236,137 |
| Foreign-born residents rank | 153/195 | 107/195 |
| Foreign-born share of population | 1.7% | 8.6% |
| Foreign-born share rank | 138/195 | 72/195 |
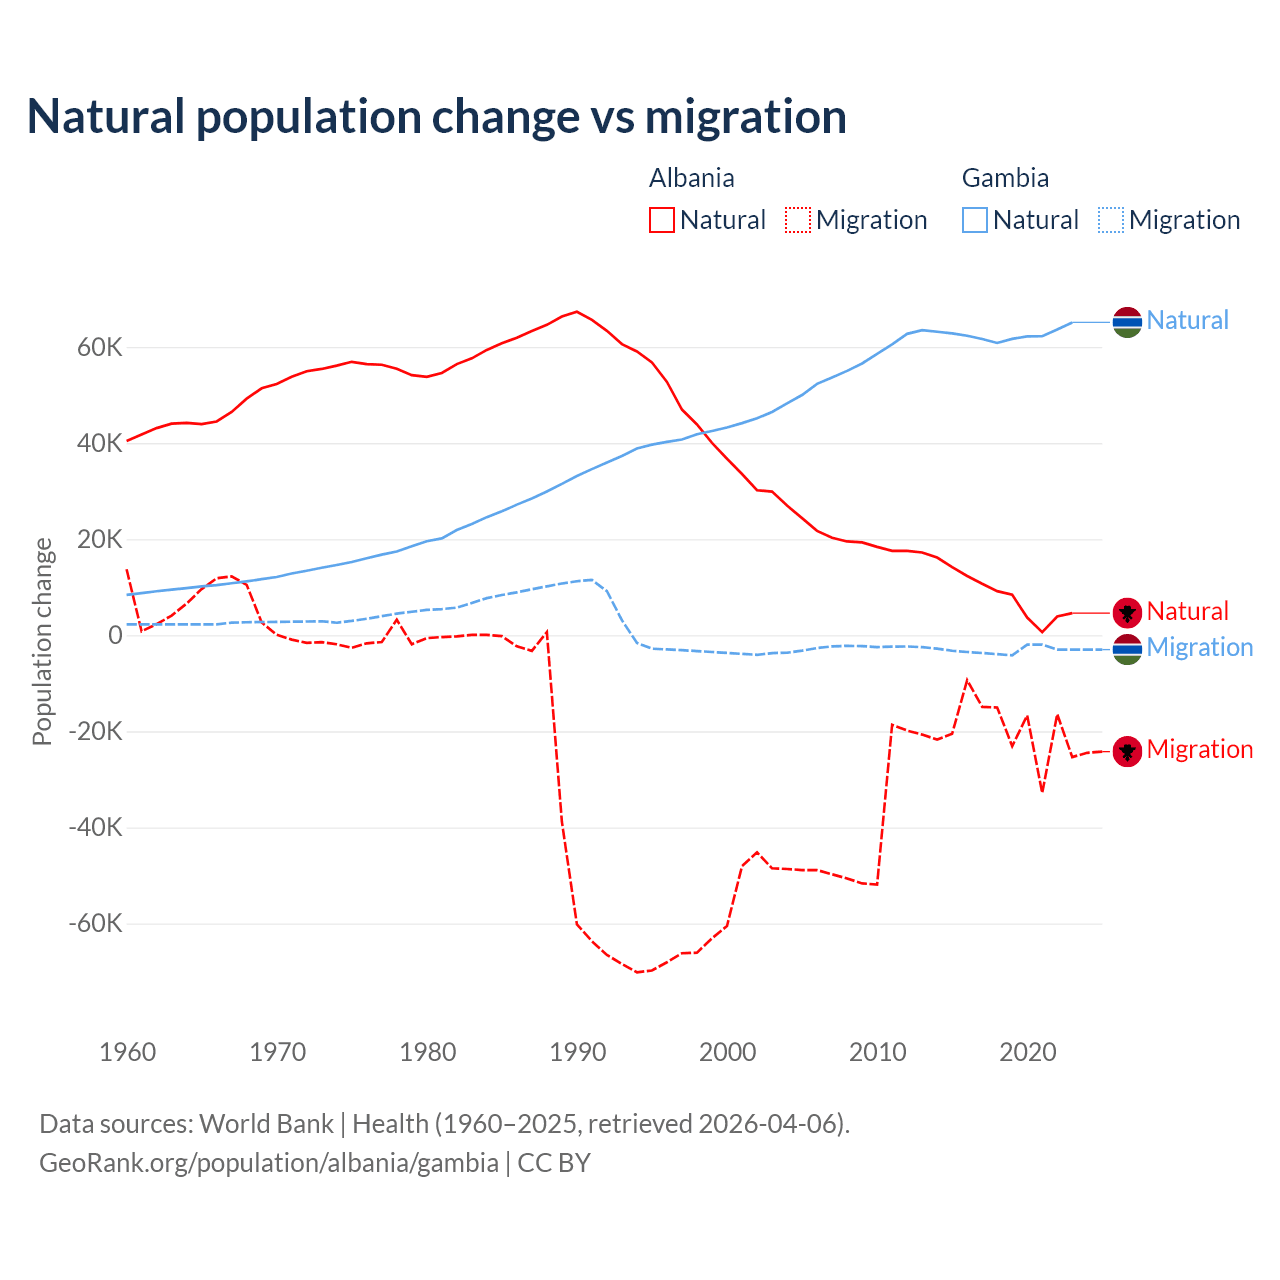
Natural population change vs migration
| Year | Population change | |||
|---|---|---|---|---|
|
Albania
|
Gambia
|
|||
| Natural | Migration | Natural | Migration | |
| 2025 | - | -24,230 | - | -2,984 |
| 2024 | 3,979 | -24,472 | 65,157 | -2,989 |
| 2023 | 4,612 | -25,357 | 65,118 | -3,000 |
| 2022 | 3,913 | -16,426 | 63,634 | -3,000 |
| 2021 | 623 | -32,848 | 62,239 | -1,949 |
| 2020 | 3,682 | -16,680 | 62,209 | -1,949 |
| 2019 | 8,432 | -23,094 | 61,701 | -4,186 |
| 2018 | 9,187 | -15,032 | 60,854 | -3,944 |
| 2017 | 10,707 | -14,901 | 61,665 | -3,696 |
| 2016 | 12,332 | -9,347 | 62,358 | -3,486 |
| 2015 | 14,164 | -20,500 | 62,832 | -3,224 |
| 2014 | 16,185 | -21,706 | 63,185 | -2,793 |
| 2013 | 17,234 | -20,681 | 63,510 | -2,476 |
| 2012 | 17,565 | -19,845 | 62,745 | -2,332 |
| 2011 | 17,564 | -18,630 | 60,571 | -2,360 |
| 2010 | 18,404 | -51,907 | 58,554 | -2,456 |
| 2009 | 19,336 | -51,657 | 56,575 | -2,259 |
| 2008 | 19,526 | -50,619 | 55,032 | -2,204 |
| 2007 | 20,286 | -49,770 | 53,653 | -2,320 |
| 2006 | 21,732 | -48,882 | 52,335 | -2,666 |
| 2005 | 24,390 | -48,893 | 50,010 | -3,209 |
| 2004 | 26,989 | -48,654 | 48,276 | -3,636 |
| 2003 | 29,907 | -48,517 | 46,473 | -3,713 |
| 2002 | 30,189 | -45,178 | 45,156 | -4,067 |
| 2001 | 33,573 | -48,070 | 44,154 | -3,882 |
| 2000 | 36,741 | -60,531 | 43,249 | -3,670 |
| 1999 | 40,047 | -63,093 | 42,533 | -3,493 |
| 1998 | 43,884 | -66,087 | 41,842 | -3,291 |
| 1997 | 46,979 | -66,188 | 40,742 | -3,098 |
| 1996 | 52,745 | -68,076 | 40,253 | -2,948 |
| 1995 | 56,784 | -69,785 | 39,681 | -2,797 |
| 1994 | 59,086 | -70,165 | 38,880 | -1,586 |
| 1993 | 60,602 | -68,445 | 37,302 | 3,131 |
| 1992 | 63,376 | -66,538 | 35,951 | 9,182 |
| 1991 | 65,639 | -63,689 | 34,584 | 11,530 |
| 1990 | 67,355 | -60,173 | 33,163 | 11,242 |
| 1989 | 66,351 | -38,835 | 31,504 | 10,765 |
| 1988 | 64,616 | 658 | 29,938 | 10,187 |
| 1987 | 63,334 | -3,250 | 28,452 | 9,563 |
| 1986 | 61,925 | -2,309 | 27,195 | 8,934 |
| 1985 | 60,798 | -183 | 25,795 | 8,373 |
| 1984 | 59,396 | 64 | 24,586 | 7,733 |
| 1983 | 57,647 | 66 | 23,175 | 6,713 |
| 1982 | 56,443 | -225 | 21,894 | 5,757 |
| 1981 | 54,595 | -374 | 20,156 | 5,438 |
| 1980 | 53,803 | -601 | 19,566 | 5,268 |
| 1979 | 54,139 | -1,871 | 18,543 | 4,898 |
| 1978 | 55,463 | 3,230 | 17,424 | 4,493 |
| 1977 | 56,319 | -1,417 | 16,773 | 3,969 |
| 1976 | 56,428 | -1,684 | 16,032 | 3,436 |
| 1975 | 56,920 | -2,610 | 15,256 | 2,979 |
| 1974 | 56,133 | -1,880 | 14,628 | 2,610 |
| 1973 | 55,439 | -1,419 | 14,046 | 2,907 |
| 1972 | 54,966 | -1,588 | 13,432 | 2,861 |
| 1971 | 53,797 | -911 | 12,842 | 2,817 |
| 1970 | 52,293 | 92 | 12,128 | 2,777 |
| 1969 | 51,407 | 2,665 | 11,670 | 2,757 |
| 1968 | 49,258 | 10,490 | 11,215 | 2,705 |
| 1967 | 46,494 | 12,252 | 10,823 | 2,617 |
| 1966 | 44,507 | 11,858 | 10,422 | 2,272 |
| 1965 | 43,953 | 9,617 | 10,162 | 2,272 |
| 1964 | 44,205 | 6,604 | 9,825 | 2,272 |
| 1963 | 44,040 | 4,091 | 9,493 | 2,272 |
| 1962 | 43,124 | 2,325 | 9,150 | 2,272 |
| 1961 | 41,802 | 829 | 8,778 | 2,272 |
| 1960 | 40,436 | 13,734 | 8,420 | 2,272 |
Data sources: World Bank | Health (1960–2025, retrieved 2026-07-08).
GeoRank.org/population/albania/gambia | CC BY
Over the last 10 years, 26.5% of the population change in Albania is from natural causes (a gain of 71,631 people) and 73.5% is from migration (a loss of 198,657 people). In the Gambia 95.2% is from natural causes (a gain of 627,767 people) and 4.77% is from migration (a loss of 31,423 people).
As of 2024, 46,377 residents or 1.7% of the population were not native-born in Albania, compared to 236,137 people or 8.6% in the Gambia.
Biggest cities by population
Compare countries by 7 more topics
Population differences between Albania and the Gambia
|
Albania
|
Gambia
|
|
|---|---|---|
| Life expectancy | 80.1 years | 66.5 years |
| Average age | 40.3 years | 23.9 years |
| Median age | 38.4 years | 19.6 years |
| Male:Female ratio | 49.4:50.6 | 49.8:50.2 |
| Fertility rate | 1.34 births per woman | 3.91 births per woman |
| Population density | 220.4 ppl/mi² | 738 ppl/mi² |
Population map with other countries
Data sources: World Bank | Health (1960–2025, retrieved 2026-07-08); United Nations | World Population Prospects (1960–2026, retrieved 2026-07-08); U.S. Census Bureau (1960–2025, retrieved 2026-07-08); Central Intelligence Agency (CIA) (2000–2019, retrieved 2026-07-08).
GeoRank.org/population/albania/gambia | CC BY
Help us show the world through your eyes
Share a photo of your city and help others discover what it looks like to live there. Your contribution makes our data come alive.
Data sources:
- World Bank | Health (1960–2025, retrieved 2026-07-08)
- United Nations | World Population Prospects (1960–2100, retrieved 2026-07-08)
- U.S. Census Bureau (1960–2025, retrieved 2026-07-08)
- Central Intelligence Agency (CIA) (2000–2019, retrieved 2026-07-08)
- Wikidata (2026, retrieved 2026-07-08)
Creative Commons Attribution (CC BY) — you’re free to copy, share, remix, adapt, and use even commercially as long as you give appropriate credit and clearly indicate if you made changes. Other sources may be subject to different license terms.