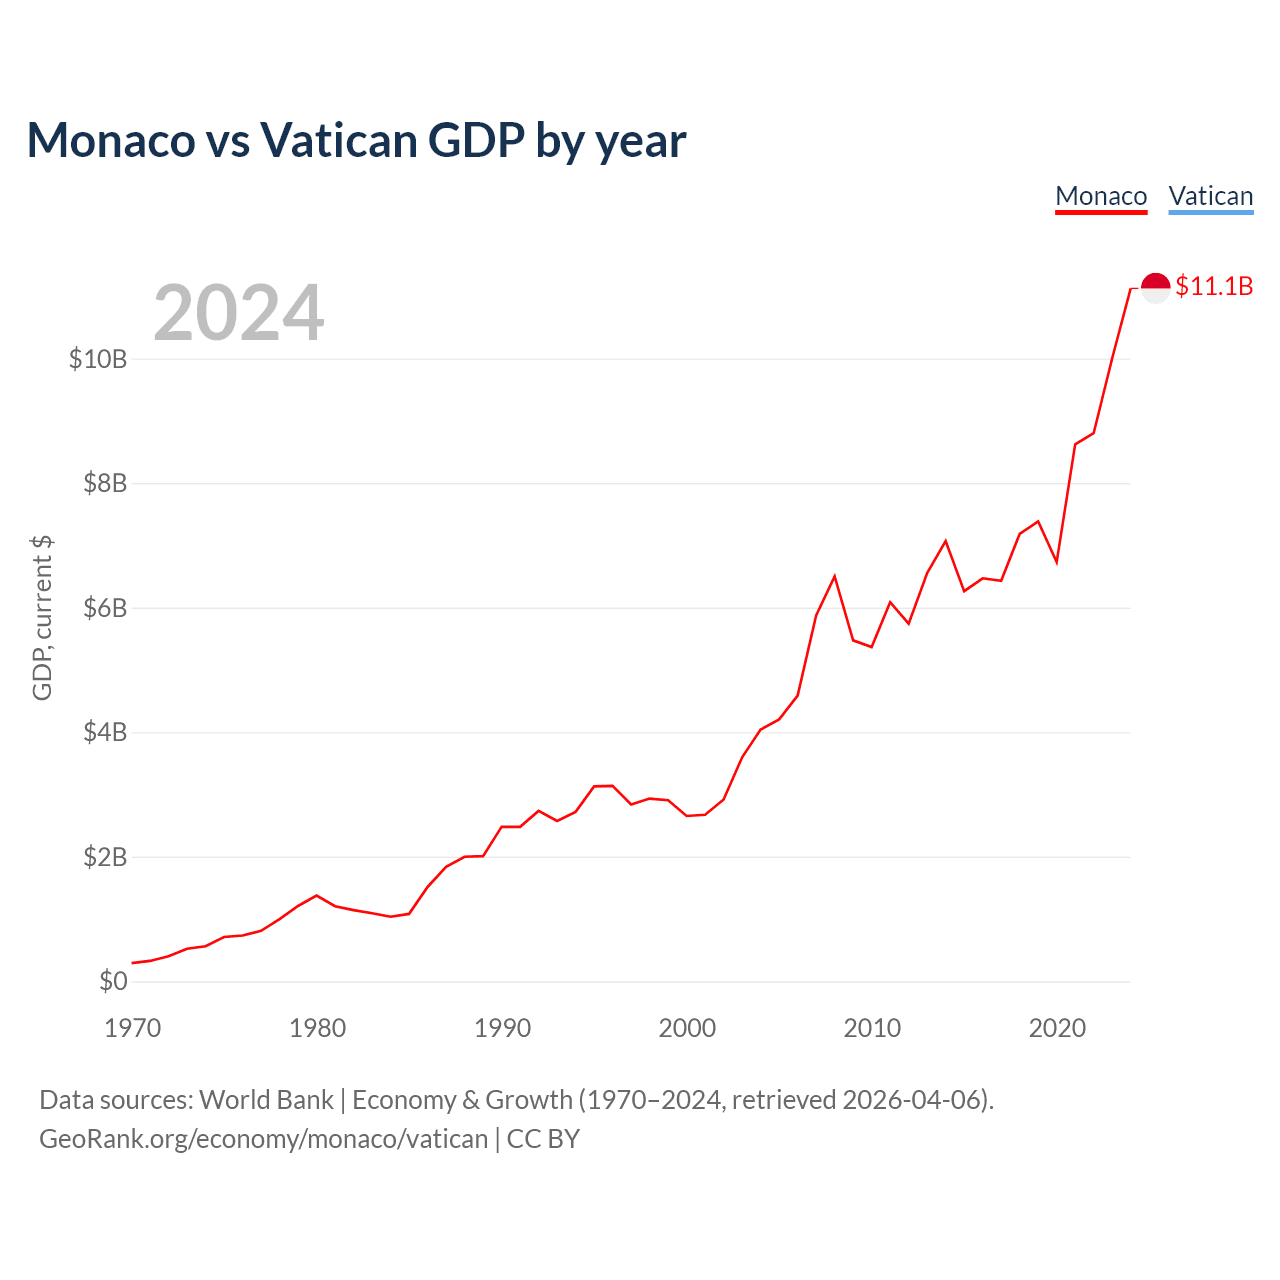
Monaco has a GDP of $11.1B compared to $19.8M for the Vatican, ranking 154/197 and 197/197 by economy size, respectively.
Monaco vs Vatican GDP by year
| Year | GDP, current $ | |
|---|---|---|
 Monaco
|
 Vatican
|
|
| 2024 | $11,125,788,838 | - |
| 2023 | $10,003,897,341 | - |
| 2022 | $8,800,432,774 | - |
| 2021 | $8,623,241,327 | - |
| 2020 | $6,730,733,231 | - |
| 2019 | $7,383,494,129 | - |
| 2018 | $7,184,336,760 | - |
| 2017 | $6,430,258,225 | - |
| 2016 | $6,471,287,669 | - |
| 2015 | $6,264,753,586 | - |
| 2014 | $7,070,015,474 | - |
| 2013 | $6,555,590,642 | - |
| 2012 | $5,742,748,406 | - |
| 2011 | $6,088,690,667 | - |
| 2010 | $5,367,561,640 | - |
| 2009 | $5,474,381,528 | - |
| 2008 | $6,502,945,305 | - |
| 2007 | $5,875,787,545 | - |
| 2006 | $4,586,828,062 | - |
| 2005 | $4,204,651,894 | - |
| 2004 | $4,043,553,261 | - |
| 2003 | $3,597,090,047 | - |
| 2002 | $2,919,647,992 | - |
| 2001 | $2,673,722,829 | - |
| 2000 | $2,654,462,466 | - |
| 1999 | $2,907,118,417 | - |
| 1998 | $2,934,593,468 | - |
| 1997 | $2,840,195,190 | - |
| 1996 | $3,137,886,995 | - |
| 1995 | $3,130,309,995 | - |
| 1994 | $2,720,332,135 | - |
| 1993 | $2,574,494,356 | - |
| 1992 | $2,737,049,231 | - |
| 1991 | $2,480,540,845 | - |
| 1990 | $2,481,307,077 | - |
| 1989 | $2,010,083,833 | - |
| 1988 | $2,000,704,745 | - |
| 1987 | $1,839,081,463 | - |
| 1986 | $1,515,234,743 | - |
| 1985 | $1,082,867,507 | - |
| 1984 | $1,037,329,604 | - |
| 1983 | $1,092,560,365 | - |
| 1982 | $1,143,216,457 | - |
| 1981 | $1,205,188,648 | - |
| 1980 | $1,378,175,524 | - |
| 1979 | $1,209,870,147 | - |
| 1978 | $1,000,555,218 | - |
| 1977 | $811,191,392 | - |
| 1976 | $735,324,245 | - |
| 1975 | $711,978,962 | - |
| 1974 | $563,949,254 | - |
| 1973 | $523,554,039 | - |
| 1972 | $402,451,901 | - |
| 1971 | $327,706,210 | - |
| 1970 | $293,127,333 | - |
Data sources: World Bank | Economy & Growth (1970–2024, retrieved 2026-07-08).
GeoRank.org/economy/monaco/vatican | CC BY 
Economic indicators
|
Monaco
|
Vatican
|
|
|---|---|---|
| Gross domestic product |
$11.1B
2024 |
$19.8M
2026 |
| GDP rank |
154/197
2024 |
197/197
2026 |
| GDP growth |
8.51%
2023-2024 |
n/a |
| GDP per capita |
$288,002
2024 |
$19,800
2026 |
| GDP per capita rank |
1/197
2024 |
61/197
2026 |
| GDP per capita, PPP |
$115,700
2015 |
$39,191
2026 |
| GDP per capita PPP rank |
6/197
2015 |
59/197
2026 |
| Average annual personal income after taxes |
$109,346
2026 |
$18,688
2026 |
| Number of billionaires |
2
2026 |
n/a |
| Government expenditure, % of GDP |
20%
2026 |
n/a |
| Consumer prices inflation |
1.5%
2019-2020 |
n/a |
| Unemployment rate |
6.33%
2016 |
n/a |
| Population |
38054
|
939
|
Economic freedom indices
The indices of economic freedom below are issued by the Heritage Foundation. Higher scores indicate stronger economic health.
Other economic metrics
GDP per capita map
Data sources: World Bank | Economy & Growth (1985–2025, retrieved 2026-07-08); U.S. Census Bureau (1985–2025, retrieved 2026-07-08).
GeoRank.org/economy/monaco/vatican | CC BY
Compare countries by 7 more topics
Help us show the world through your eyes
Share a photo of your city and help others discover what it looks like to live there. Your contribution makes our data come alive.
Data sources:
- World Bank | Economy & Growth (1970–2026, retrieved 2026-07-08)
- U.S. Census Bureau (1985–2025, retrieved 2026-07-08)
- Central Intelligence Agency (CIA) (2015–2026, retrieved 2026-07-08)
- United Nations | World Population Prospects (2026, retrieved 2026-07-08)
- LivingCost (2026, retrieved 2026-07-08)
Creative Commons Attribution (CC BY) — you’re free to copy, share, remix, adapt, and use even commercially as long as you give appropriate credit and clearly indicate if you made changes. Other sources may be subject to different license terms.