Monaco is 4.24 times bigger by total area compared to the Vatican: 0.8 sq mi vs 0.19 sq mi. Without inland water, the land area of Monaco is 0.8 sq mi vs 0.17 sq mi for the Vatican — a 4.74 times difference in territory size.
- Monaco ranks 196/197 by total surface area vs 197/197 for the Vatican.
- Monaco occupies 0.000001% of the land mass of all countries, compared with 0.0000003% for the Vatican.
Total size and land area comparison
 Monaco
|
 Vatican
|
|
|---|---|---|
| Total area |
0.8 sq mi |
0.19 sq mi |
| Size difference ratio | 4.24 | 1 |
| Total area rank | 196/197 | 197/197 |
| Share of all countries' surface area | 0.0000004% | 0.0000001% |
| Land area |
0.8 sq mi |
0.17 sq mi |
| Land area difference ratio | 4.74 | 1 |
| Land area rank | 196/197 | 197/197 |
| Share of all countries' land area | 0.000001% | 0.0000003% |
| Population | 38,341 | 1,000 |
| Population density | 47,293 ppl/mi² | 5,493 ppl/mi² |
Surface area by type
|
Monaco
|
Vatican
|
|
|---|---|---|
| Forest area |
0 sq mi |
n/a |
| Forest area as share of land | 0% | n/a |
| Forest area rank | 194/196 | n/a |
| World's forests share | 0% | n/a |
Water area

|
0 sq mi |
0.02 sq mi |
| Water as share of total area | 0% | 10.2% |
| Water area rank | 183/197 | 167/197 |
| Roads length |
47.8 mi |
5.59 mi |
| Land borders length |
3.73 mi |
2.11 mi |
| Coastline length |
2.55 mi |
0 mi |
| Share of marine protected waters | 100% | n/a |
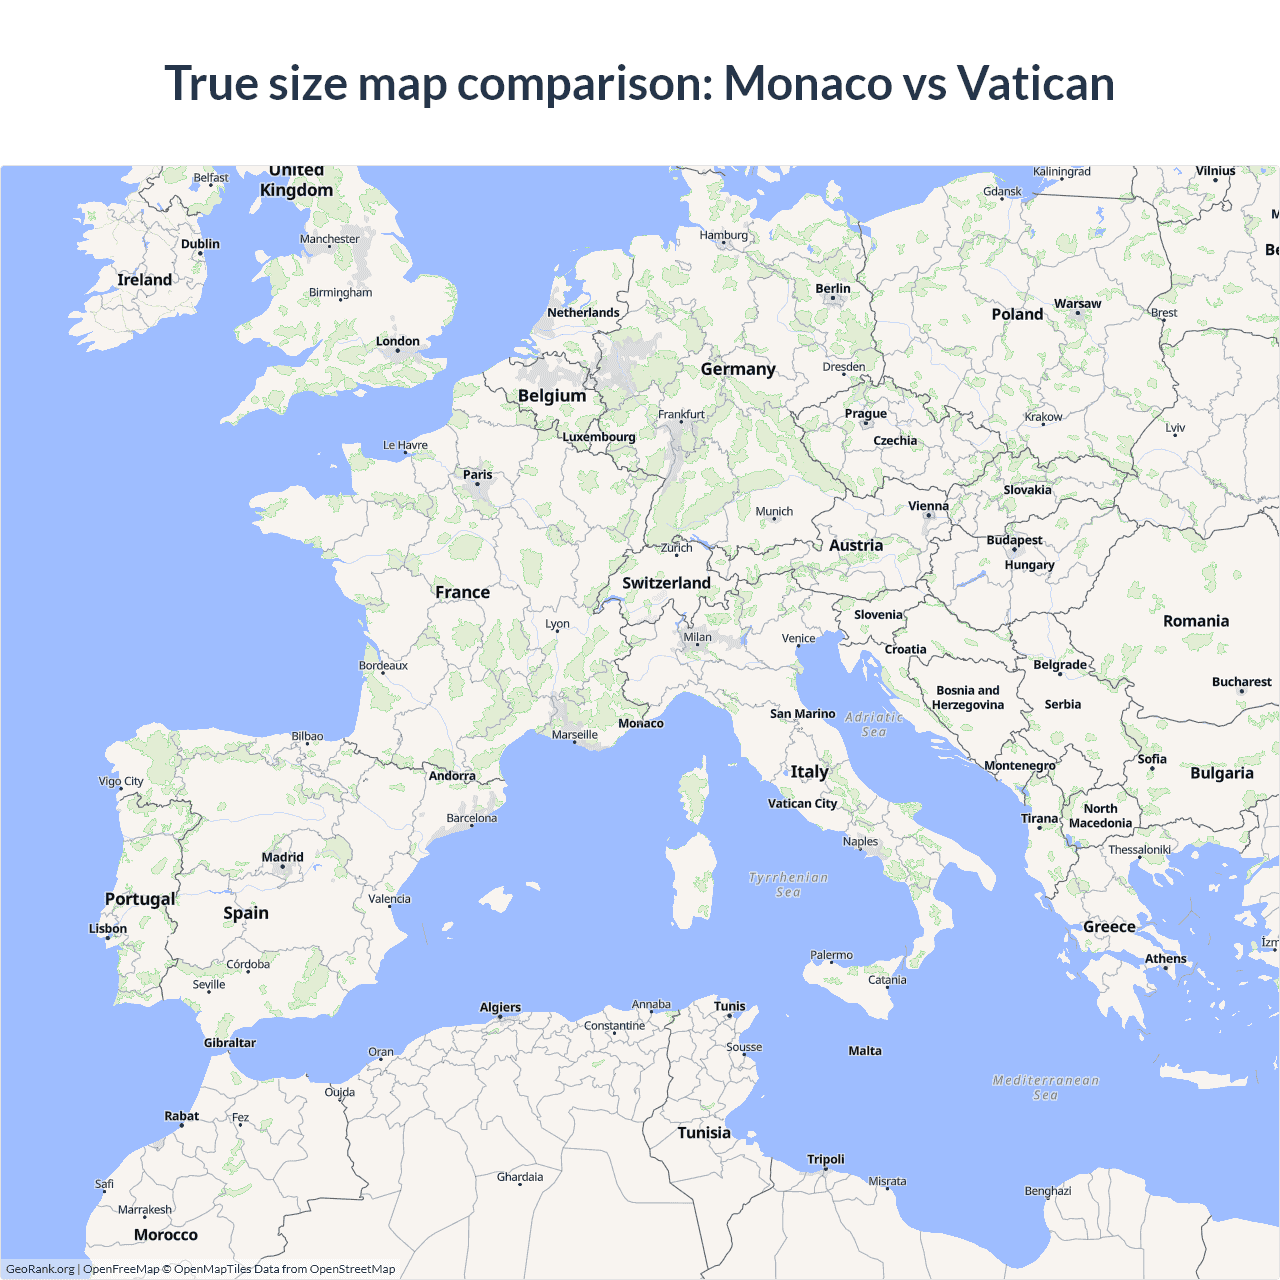
Monaco vs Vatican size on the map
Data sources: World Bank | Agriculture & Rural Development (2026, retrieved 2026-07-08).
GeoRank.org/size/monaco/vatican | CC BY
The map above outlines the borders of Monaco and the Vatican but is not accurate for size comparison because it's a 2d map with Mercator projection that distorts territories near the poles. The farther a country is from the equator, the more magnified it appears. More about country size projections.
Compare countries by 7 more topics
Help us show the world through your eyes
Share a photo of your city and help others discover what it looks like to live there. Your contribution makes our data come alive.
Data sources:
- World Bank | Agriculture & Rural Development (2026, retrieved 2026-07-08)
- Wikidata (2026, retrieved 2026-07-08)
- Central Intelligence Agency (CIA) (2019–2025, retrieved 2026-07-08)
- United Nations | World Population Prospects (2026, retrieved 2026-07-08)
Inland areas under water, such as large rivers, lakes, and some coastal waterways.
Creative Commons Attribution (CC BY) — you’re free to copy, share, remix, adapt, and use even commercially as long as you give appropriate credit and clearly indicate if you made changes. Other sources may be subject to different license terms.