The latest officially reported population of Nicaragua was 7,007,502 in 2025 vs 34,576,665 people in Peru in 2025. In 2026, based on the adjusted UN estimation, the current Nicaragua's population is 7,144,725 people compared to 35,105,331 in Peru.
Population statistics:
- Peru's population is 4.91 times bigger than Nicaragua's.
- Nicaragua is ranked the 107th most populous country in the world, while Peru is the 48th.
- The countries together account for 0.51% of the world: 0.09% for Nicaragua vs 0.42% for Peru.
- For the last 10 years, Nicaragua has had an average growth rate of +1.32% per year vs +1.26% in Peru.
- Since 2006, the population of Nicaragua has increased from 5.42M people to 7.14M (31.8% growth), while Peru has grown from 28.3M to 35.1M (23.9% growth).
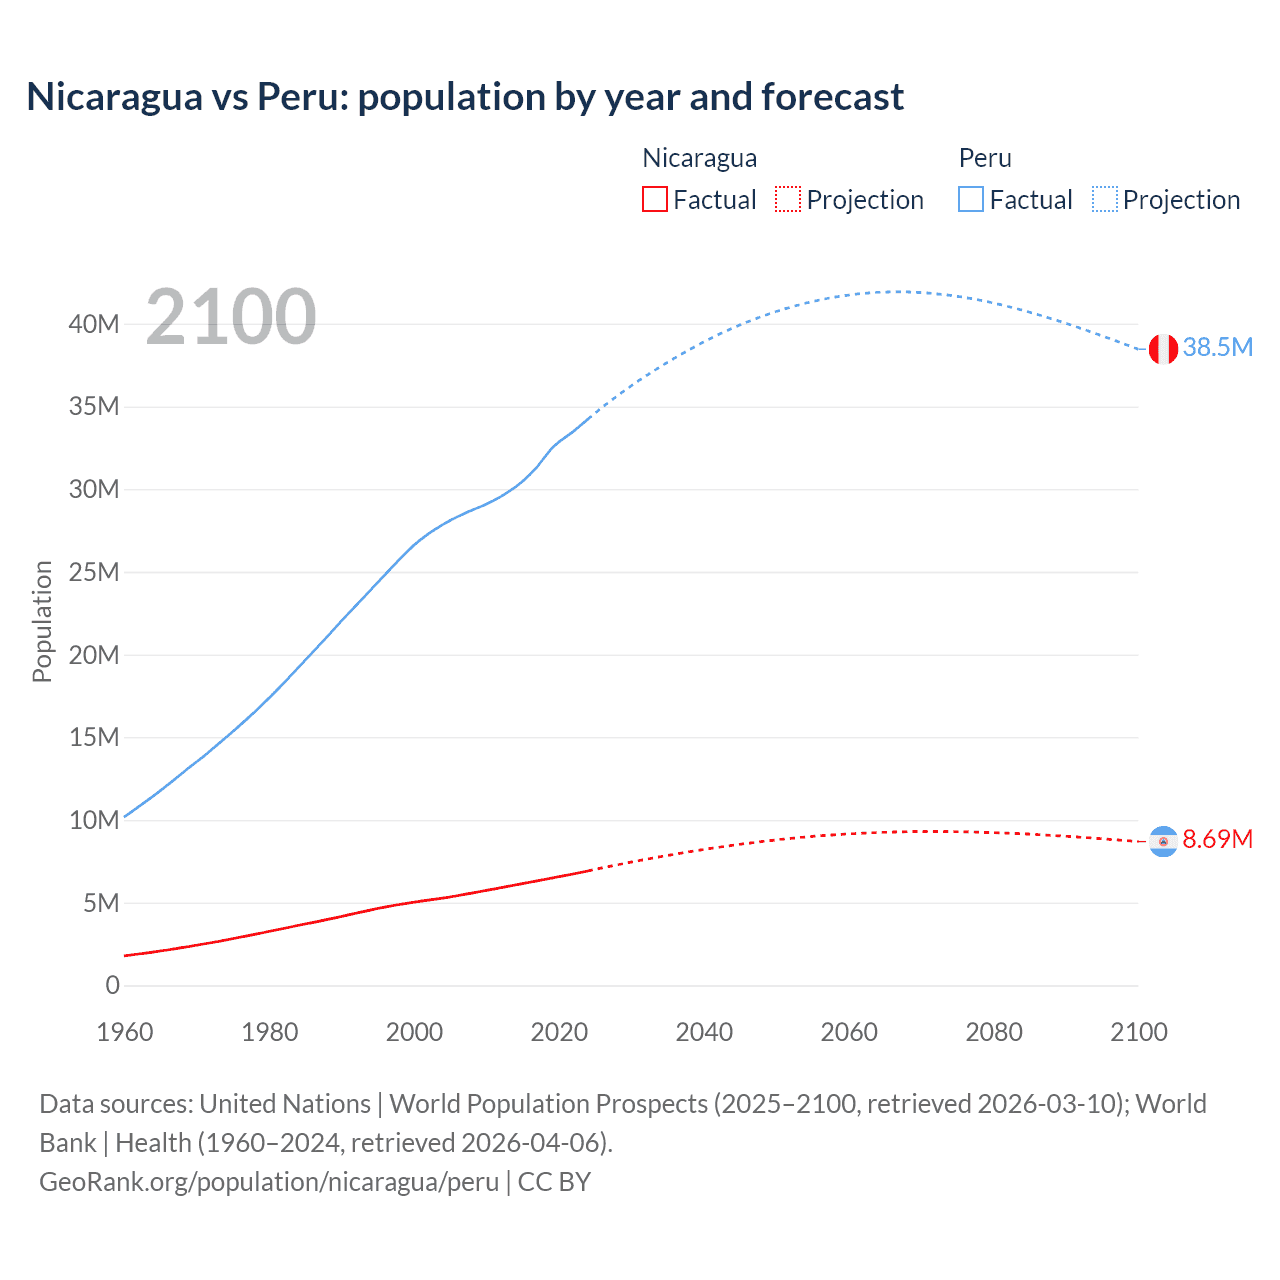
Nicaragua vs Peru: population by year and forecast
| Year | Population | |
|---|---|---|
 Nicaragua
|
 Peru
Peru
|
|
| 2100 | 8,686,387 | 38,442,430 |
| 2099 | 8,722,801 | 38,609,486 |
| 2098 | 8,758,489 | 38,774,265 |
| 2097 | 8,793,005 | 38,937,509 |
| 2096 | 8,826,676 | 39,098,598 |
| 2095 | 8,859,393 | 39,257,494 |
| 2094 | 8,890,985 | 39,413,146 |
| 2093 | 8,922,511 | 39,567,920 |
| 2092 | 8,952,706 | 39,718,895 |
| 2091 | 8,982,238 | 39,867,036 |
| 2090 | 9,010,281 | 40,012,169 |
| 2089 | 9,037,910 | 40,153,701 |
| 2088 | 9,064,058 | 40,292,740 |
| 2087 | 9,089,133 | 40,428,045 |
| 2086 | 9,113,522 | 40,558,786 |
| 2085 | 9,136,545 | 40,685,268 |
| 2084 | 9,158,382 | 40,807,007 |
| 2083 | 9,178,656 | 40,923,102 |
| 2082 | 9,197,809 | 41,034,801 |
| 2081 | 9,215,739 | 41,140,743 |
| 2080 | 9,231,840 | 41,241,207 |
| 2079 | 9,246,154 | 41,334,845 |
| 2078 | 9,258,426 | 41,422,439 |
| 2077 | 9,269,451 | 41,503,511 |
| 2076 | 9,278,508 | 41,578,164 |
| 2075 | 9,285,415 | 41,645,808 |
| 2074 | 9,291,490 | 41,706,491 |
| 2073 | 9,295,367 | 41,759,277 |
| 2072 | 9,297,079 | 41,804,713 |
| 2071 | 9,296,698 | 41,842,534 |
| 2070 | 9,294,691 | 41,873,019 |
| 2069 | 9,290,396 | 41,895,381 |
| 2068 | 9,283,672 | 41,909,248 |
| 2067 | 9,275,227 | 41,914,729 |
| 2066 | 9,264,219 | 41,912,112 |
| 2065 | 9,251,518 | 41,901,353 |
| 2064 | 9,236,612 | 41,882,691 |
| 2063 | 9,219,426 | 41,855,037 |
| 2062 | 9,199,856 | 41,819,132 |
| 2061 | 9,178,404 | 41,774,412 |
| 2060 | 9,154,342 | 41,721,225 |
| 2059 | 9,127,668 | 41,659,921 |
| 2058 | 9,098,625 | 41,590,180 |
| 2057 | 9,067,965 | 41,511,131 |
| 2056 | 9,035,277 | 41,423,914 |
| 2055 | 9,000,212 | 41,327,613 |
| 2054 | 8,962,862 | 41,223,066 |
| 2053 | 8,923,471 | 41,109,699 |
| 2052 | 8,881,555 | 40,988,952 |
| 2051 | 8,836,892 | 40,860,060 |
| 2050 | 8,789,897 | 40,722,627 |
| 2049 | 8,741,263 | 40,577,434 |
| 2048 | 8,689,971 | 40,424,258 |
| 2047 | 8,636,574 | 40,261,875 |
| 2046 | 8,581,536 | 40,090,240 |
| 2045 | 8,524,256 | 39,910,095 |
| 2044 | 8,464,984 | 39,720,613 |
| 2043 | 8,404,060 | 39,523,731 |
| 2042 | 8,341,211 | 39,318,023 |
| 2041 | 8,276,512 | 39,103,923 |
| 2040 | 8,209,876 | 38,882,017 |
| 2039 | 8,141,726 | 38,652,110 |
| 2038 | 8,071,337 | 38,414,521 |
| 2037 | 7,999,109 | 38,168,782 |
| 2036 | 7,925,391 | 37,914,498 |
| 2035 | 7,849,978 | 37,652,693 |
| 2034 | 7,772,780 | 37,382,554 |
| 2033 | 7,693,975 | 37,105,048 |
| 2032 | 7,613,757 | 36,820,835 |
| 2031 | 7,531,669 | 36,529,111 |
| 2030 | 7,448,359 | 36,228,701 |
| 2029 | 7,363,385 | 35,919,668 |
| 2028 | 7,276,613 | 35,600,666 |
| 2027 | 7,188,324 | 35,271,163 |
| 2026 | 7,098,677 | 34,930,183 |
| 2025 | 7,007,502 | 34,576,665 |
| 2024 | 6,916,140 | 34,217,848 |
| 2023 | 6,823,613 | 33,845,617 |
| 2022 | 6,730,654 | 33,475,438 |
| 2021 | 6,644,741 | 33,155,882 |
| 2020 | 6,565,267 | 32,838,579 |
| 2019 | 6,483,657 | 32,449,303 |
| 2018 | 6,400,080 | 31,897,584 |
| 2017 | 6,316,231 | 31,324,637 |
| 2016 | 6,232,666 | 30,866,494 |
| 2015 | 6,149,417 | 30,457,600 |
| 2014 | 6,066,492 | 30,115,826 |
| 2013 | 5,983,845 | 29,817,919 |
| 2012 | 5,901,287 | 29,550,366 |
| 2011 | 5,819,051 | 29,304,086 |
| 2010 | 5,737,450 | 29,086,019 |
| 2009 | 5,656,601 | 28,896,811 |
| 2008 | 5,576,593 | 28,719,041 |
| 2007 | 5,497,243 | 28,530,699 |
| 2006 | 5,418,855 | 28,324,491 |
| 2005 | 5,342,105 | 28,101,180 |
| 2004 | 5,272,912 | 27,852,190 |
| 2003 | 5,210,963 | 27,580,490 |
| 2002 | 5,149,909 | 27,288,217 |
| 2001 | 5,087,825 | 26,964,601 |
| 2000 | 5,022,633 | 26,598,331 |
| 1999 | 4,954,018 | 26,186,504 |
| 1998 | 4,883,655 | 25,738,095 |
| 1997 | 4,809,573 | 25,274,147 |
| 1996 | 4,729,974 | 24,811,171 |
| 1995 | 4,642,931 | 24,348,919 |
| 1994 | 4,549,316 | 23,881,493 |
| 1993 | 4,453,732 | 23,413,783 |
| 1992 | 4,357,026 | 22,946,340 |
| 1991 | 4,259,637 | 22,483,775 |
| 1990 | 4,162,559 | 22,014,771 |
| 1989 | 4,066,476 | 21,532,589 |
| 1988 | 3,972,320 | 21,054,702 |
| 1987 | 3,882,164 | 20,582,320 |
| 1986 | 3,794,157 | 20,117,122 |
| 1985 | 3,706,479 | 19,648,204 |
| 1984 | 3,619,104 | 19,174,716 |
| 1983 | 3,530,282 | 18,705,957 |
| 1982 | 3,438,745 | 18,246,503 |
| 1981 | 3,345,674 | 17,798,805 |
| 1980 | 3,252,403 | 17,360,949 |
| 1979 | 3,164,525 | 16,933,139 |
| 1978 | 3,080,314 | 16,516,059 |
| 1977 | 2,992,534 | 16,109,806 |
| 1976 | 2,903,851 | 15,716,809 |
| 1975 | 2,816,943 | 15,333,957 |
| 1974 | 2,732,075 | 14,956,552 |
| 1973 | 2,649,278 | 14,582,867 |
| 1972 | 2,573,578 | 14,210,147 |
| 1971 | 2,499,825 | 13,838,067 |
| 1970 | 2,423,065 | 13,501,237 |
| 1969 | 2,348,398 | 13,166,767 |
| 1968 | 2,275,836 | 12,803,993 |
| 1967 | 2,205,567 | 12,448,814 |
| 1966 | 2,137,820 | 12,101,297 |
| 1965 | 2,072,681 | 11,761,085 |
| 1964 | 2,010,176 | 11,427,978 |
| 1963 | 1,950,159 | 11,102,099 |
| 1962 | 1,892,320 | 10,784,612 |
| 1961 | 1,836,451 | 10,475,123 |
| 1960 | 1,782,370 | 10,174,127 |
Data sources: United Nations | World Population Prospects (2026–2100, retrieved 2026-07-08); World Bank | Health (1960–2025, retrieved 2026-07-08).
GeoRank.org/population/nicaragua/peru | CC BY 
From 2006 to 2016, the population of Nicaragua increased by 813,811 people (a 15% growth), while Peru gained 2,542,003 people (a 8.97% growth).
For the next 10 years, from 2016 to 2026, Nicaragua gained 912,059 people (a 14.6% growth), while Peru's population increased by 4,238,837 people (a 13.7% growth).
Nicaragua was ranked 109th most populous country in 2006 and is 107th in 2026. Peru was ranked 40th in 2006 and ranked 48th now.
The UN's World Population Prospects forecasts that in 24 years (in 2050) Nicaragua's population will grow by 23% to 8,789,897 people with a rank change from 107th to 109th. The population of Peru will increase by 16% to 40,722,627 people and rank change from 48th to 51st.
Nicaragua is projected to reach its peak in 2072 at 9.3M people compared to the peak of 41.9M people in 2067 for Peru.
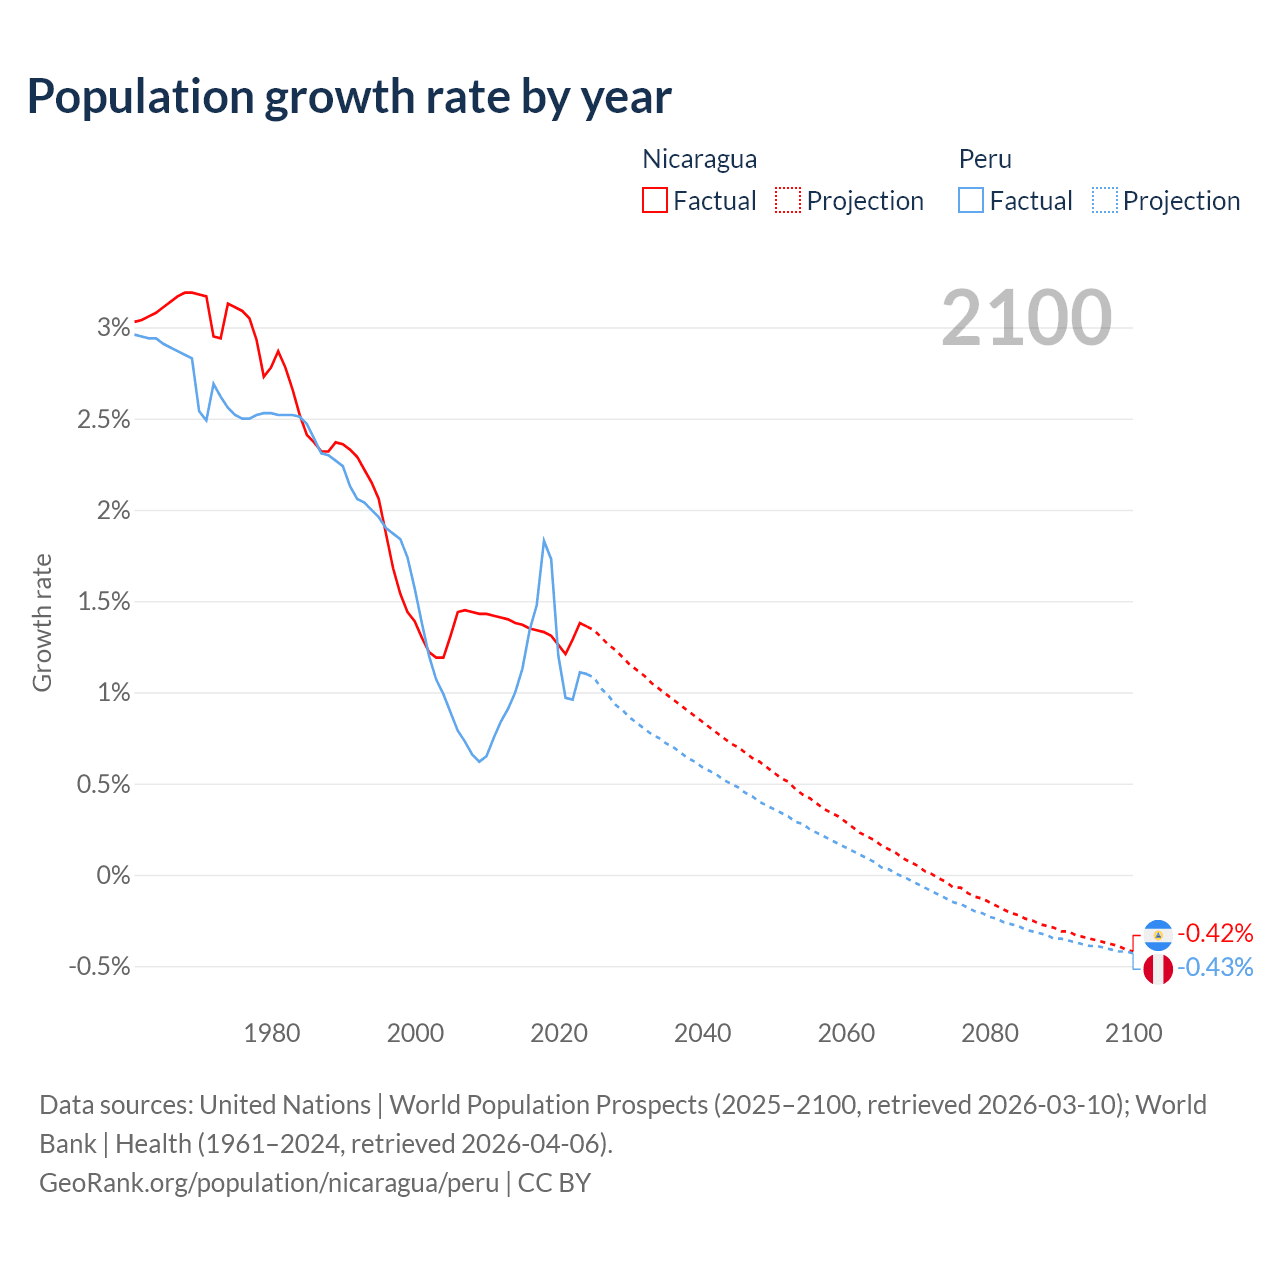
Population growth rate by year
| Year | Growth rate | |
|---|---|---|
|
Nicaragua
|
Peru
|
|
| 2100 | -0.42% | -0.43% |
| 2099 | -0.41% | -0.42% |
| 2098 | -0.39% | -0.42% |
| 2097 | -0.38% | -0.41% |
| 2096 | -0.37% | -0.4% |
| 2095 | -0.36% | -0.39% |
| 2094 | -0.35% | -0.39% |
| 2093 | -0.34% | -0.38% |
| 2092 | -0.33% | -0.37% |
| 2091 | -0.31% | -0.36% |
| 2090 | -0.31% | -0.35% |
| 2089 | -0.29% | -0.35% |
| 2088 | -0.28% | -0.33% |
| 2087 | -0.27% | -0.32% |
| 2086 | -0.25% | -0.31% |
| 2085 | -0.24% | -0.3% |
| 2084 | -0.22% | -0.28% |
| 2083 | -0.21% | -0.27% |
| 2082 | -0.19% | -0.26% |
| 2081 | -0.17% | -0.24% |
| 2080 | -0.15% | -0.23% |
| 2079 | -0.13% | -0.21% |
| 2078 | -0.12% | -0.2% |
| 2077 | -0.1% | -0.18% |
| 2076 | -0.07% | -0.16% |
| 2075 | -0.07% | -0.15% |
| 2074 | -0.04% | -0.13% |
| 2073 | -0.02% | -0.11% |
| 2072 | 0.004% | -0.09% |
| 2071 | 0.02% | -0.07% |
| 2070 | 0.05% | -0.05% |
| 2069 | 0.07% | -0.03% |
| 2068 | 0.09% | -0.01% |
| 2067 | 0.12% | 0.006% |
| 2066 | 0.14% | 0.03% |
| 2065 | 0.16% | 0.04% |
| 2064 | 0.19% | 0.07% |
| 2063 | 0.21% | 0.09% |
| 2062 | 0.23% | 0.11% |
| 2061 | 0.26% | 0.13% |
| 2060 | 0.29% | 0.15% |
| 2059 | 0.32% | 0.17% |
| 2058 | 0.34% | 0.19% |
| 2057 | 0.36% | 0.21% |
| 2056 | 0.39% | 0.23% |
| 2055 | 0.42% | 0.25% |
| 2054 | 0.44% | 0.28% |
| 2053 | 0.47% | 0.29% |
| 2052 | 0.51% | 0.32% |
| 2051 | 0.53% | 0.34% |
| 2050 | 0.56% | 0.36% |
| 2049 | 0.59% | 0.38% |
| 2048 | 0.62% | 0.4% |
| 2047 | 0.64% | 0.43% |
| 2046 | 0.67% | 0.45% |
| 2045 | 0.7% | 0.48% |
| 2044 | 0.72% | 0.5% |
| 2043 | 0.75% | 0.52% |
| 2042 | 0.78% | 0.55% |
| 2041 | 0.81% | 0.57% |
| 2040 | 0.84% | 0.59% |
| 2039 | 0.87% | 0.62% |
| 2038 | 0.9% | 0.64% |
| 2037 | 0.93% | 0.67% |
| 2036 | 0.96% | 0.7% |
| 2035 | 0.99% | 0.72% |
| 2034 | 1.02% | 0.75% |
| 2033 | 1.05% | 0.77% |
| 2032 | 1.09% | 0.8% |
| 2031 | 1.12% | 0.83% |
| 2030 | 1.15% | 0.86% |
| 2029 | 1.19% | 0.9% |
| 2028 | 1.23% | 0.93% |
| 2027 | 1.26% | 0.98% |
| 2026 | 1.3% | 1.02% |
| 2025 | 1.32% | 1.05% |
| 2024 | 1.36% | 1.1% |
| 2023 | 1.38% | 1.11% |
| 2022 | 1.29% | 0.96% |
| 2021 | 1.21% | 0.97% |
| 2020 | 1.26% | 1.2% |
| 2019 | 1.31% | 1.73% |
| 2018 | 1.33% | 1.83% |
| 2017 | 1.34% | 1.48% |
| 2016 | 1.35% | 1.34% |
| 2015 | 1.37% | 1.13% |
| 2014 | 1.38% | 1% |
| 2013 | 1.4% | 0.91% |
| 2012 | 1.41% | 0.84% |
| 2011 | 1.42% | 0.75% |
| 2010 | 1.43% | 0.65% |
| 2009 | 1.43% | 0.62% |
| 2008 | 1.44% | 0.66% |
| 2007 | 1.45% | 0.73% |
| 2006 | 1.44% | 0.79% |
| 2005 | 1.31% | 0.89% |
| 2004 | 1.19% | 0.99% |
| 2003 | 1.19% | 1.07% |
| 2002 | 1.22% | 1.2% |
| 2001 | 1.3% | 1.38% |
| 2000 | 1.39% | 1.57% |
| 1999 | 1.44% | 1.74% |
| 1998 | 1.54% | 1.84% |
| 1997 | 1.68% | 1.87% |
| 1996 | 1.87% | 1.9% |
| 1995 | 2.06% | 1.96% |
| 1994 | 2.15% | 2% |
| 1993 | 2.22% | 2.04% |
| 1992 | 2.29% | 2.06% |
| 1991 | 2.33% | 2.13% |
| 1990 | 2.36% | 2.24% |
| 1989 | 2.37% | 2.27% |
| 1988 | 2.32% | 2.3% |
| 1987 | 2.32% | 2.31% |
| 1986 | 2.37% | 2.39% |
| 1985 | 2.41% | 2.47% |
| 1984 | 2.52% | 2.51% |
| 1983 | 2.66% | 2.52% |
| 1982 | 2.78% | 2.52% |
| 1981 | 2.87% | 2.52% |
| 1980 | 2.78% | 2.53% |
| 1979 | 2.73% | 2.53% |
| 1978 | 2.93% | 2.52% |
| 1977 | 3.05% | 2.5% |
| 1976 | 3.09% | 2.5% |
| 1975 | 3.11% | 2.52% |
| 1974 | 3.13% | 2.56% |
| 1973 | 2.94% | 2.62% |
| 1972 | 2.95% | 2.69% |
| 1971 | 3.17% | 2.49% |
| 1970 | 3.18% | 2.54% |
| 1969 | 3.19% | 2.83% |
| 1968 | 3.19% | 2.85% |
| 1967 | 3.17% | 2.87% |
| 1966 | 3.14% | 2.89% |
| 1965 | 3.11% | 2.91% |
| 1964 | 3.08% | 2.94% |
| 1963 | 3.06% | 2.94% |
| 1962 | 3.04% | 2.95% |
| 1961 | 3.03% | 2.96% |
Data sources: United Nations | World Population Prospects (2026–2100, retrieved 2026-07-08); World Bank | Health (1961–2025, retrieved 2026-07-08).
GeoRank.org/population/nicaragua/peru | CC BY
In 2025, the population of Nicaragua grew by 1.32%, while Peru's population grew by 1.05%.
Live population counters
|
Nicaragua
|
Peru
|
|
|---|---|---|
| Current population |
7144725
|
35105331
|
| Population rank | 107/197 | 48/197 |
| Percent of world population | 0.09% | 0.42% |
| One net population change |
5.77 minutes
|
1.47 minutes
|
| One birth every |
3.97 minutes
|
58.5 seconds
|
| One death every |
16.4 minutes
|
2.75 minutes
|
| Daily growth/decline | +250 | +983 |
| Annual growth/decline | +91,362 | +358,817 |
| Annual growth/decline rate | +1.32% | +1.05% |
| Population growth rate rank | 78/197 | 97/197 |
| One migration net change every |
1.05 hours
|
44.2 minutes
|
| Annual migration change | -8,371 | +11,931 |
| Net migration rank | 129/196 | 41/196 |
| Foreign-born residents | 43,757 | 1,837,219 |
| Foreign-born residents rank | 154/195 | 39/195 |
| Foreign-born share of population | 0.6% | 5.4% |
| Foreign-born share rank | 172/195 | 90/195 |
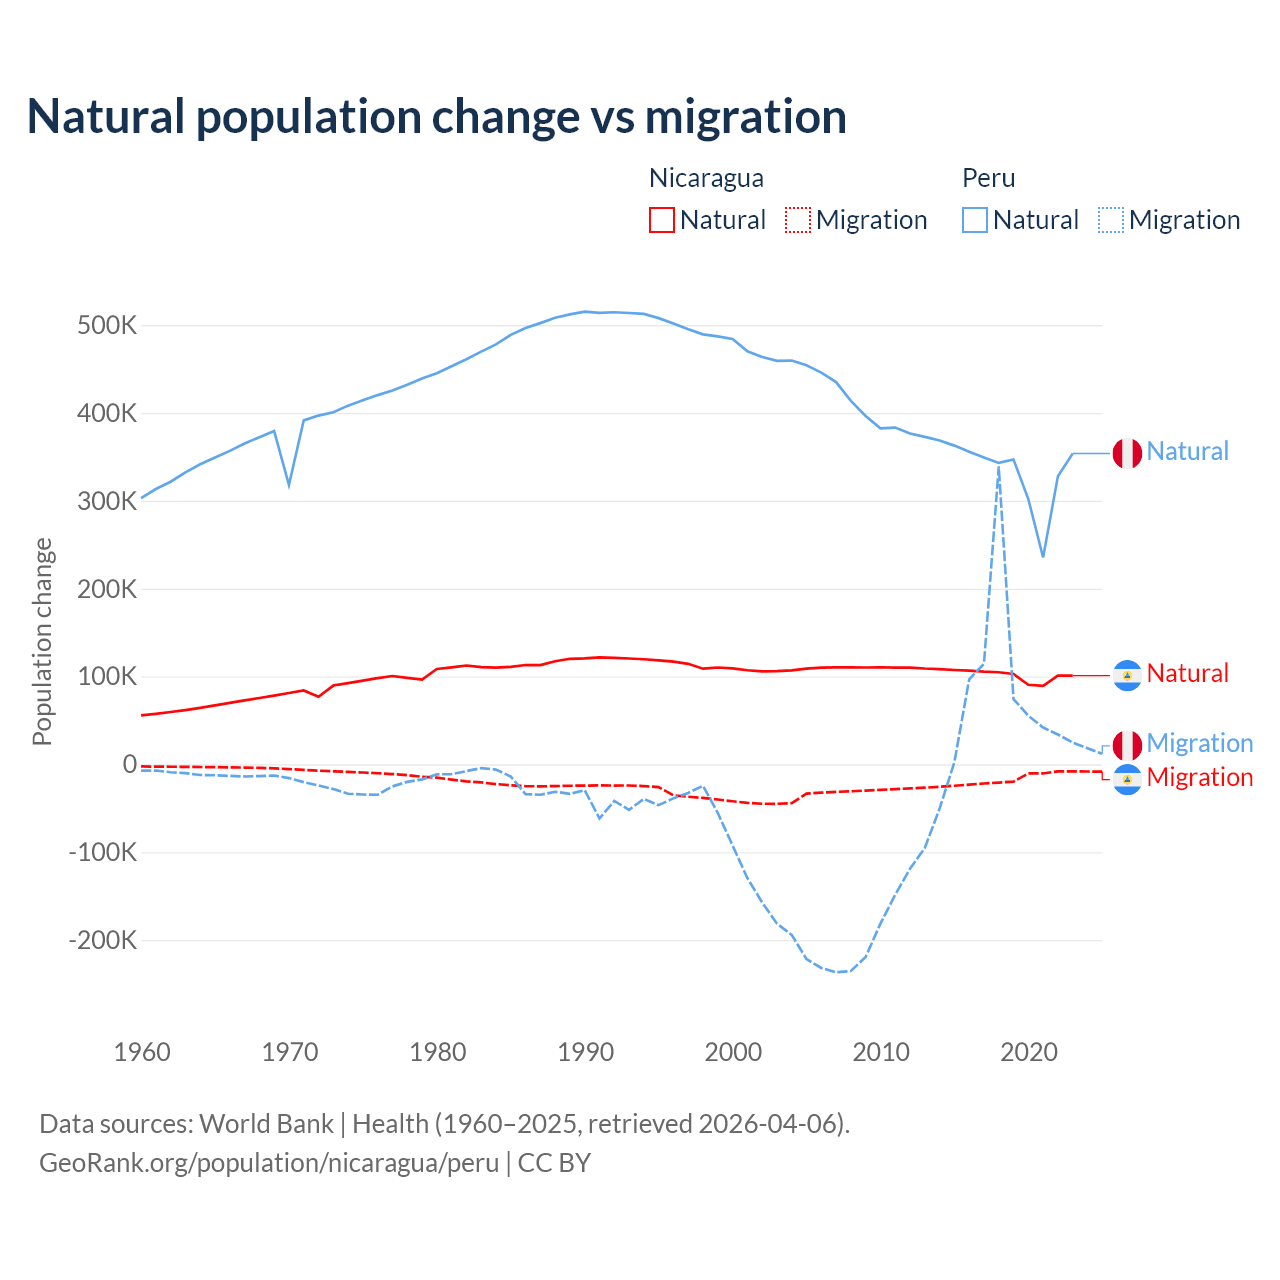
Natural population change vs migration
| Year | Population change | |||
|---|---|---|---|---|
|
Nicaragua
|
Peru
|
|||
| Natural | Migration | Natural | Migration | |
| 2025 | - | -8,371 | - | 11,931 |
| 2024 | 100,318 | -8,189 | 347,517 | 18,406 |
| 2023 | 100,921 | -7,996 | 353,788 | 24,783 |
| 2022 | 100,987 | -7,996 | 327,859 | 33,982 |
| 2021 | 89,213 | -10,383 | 235,440 | 41,868 |
| 2020 | 90,515 | -10,383 | 301,950 | 55,375 |
| 2019 | 102,817 | -19,730 | 346,981 | 74,270 |
| 2018 | 104,814 | -20,742 | 343,123 | 339,067 |
| 2017 | 105,468 | -21,849 | 349,333 | 114,382 |
| 2016 | 106,585 | -23,076 | 355,859 | 96,740 |
| 2015 | 107,344 | -24,353 | 362,781 | 2,421 |
| 2014 | 108,420 | -25,570 | 368,708 | -50,383 |
| 2013 | 109,032 | -26,587 | 372,694 | -95,214 |
| 2012 | 110,065 | -27,389 | 376,501 | -118,863 |
| 2011 | 110,026 | -28,221 | 383,268 | -148,339 |
| 2010 | 110,475 | -29,081 | 382,510 | -181,302 |
| 2009 | 110,213 | -29,913 | 396,522 | -219,314 |
| 2008 | 110,395 | -30,675 | 413,640 | -235,307 |
| 2007 | 110,341 | -31,357 | 435,122 | -236,745 |
| 2006 | 110,073 | -32,274 | 445,884 | -231,851 |
| 2005 | 108,984 | -33,280 | 454,199 | -221,652 |
| 2004 | 106,904 | -44,222 | 459,617 | -194,171 |
| 2003 | 106,142 | -44,931 | 459,243 | -181,276 |
| 2002 | 105,805 | -44,906 | 463,709 | -157,158 |
| 2001 | 107,109 | -43,837 | 470,154 | -129,481 |
| 2000 | 109,192 | -42,087 | 484,222 | -92,353 |
| 1999 | 110,217 | -40,095 | 487,095 | -55,325 |
| 1998 | 108,862 | -38,260 | 489,436 | -24,388 |
| 1997 | 114,415 | -36,851 | 495,348 | -32,515 |
| 1996 | 116,849 | -35,208 | 501,855 | -38,749 |
| 1995 | 118,325 | -25,889 | 507,894 | -46,499 |
| 1994 | 119,565 | -24,773 | 512,735 | -39,299 |
| 1993 | 120,469 | -24,091 | 513,769 | -51,775 |
| 1992 | 121,204 | -24,171 | 514,618 | -41,702 |
| 1991 | 121,787 | -24,028 | 513,867 | -61,645 |
| 1990 | 120,677 | -24,280 | 515,233 | -29,437 |
| 1989 | 120,128 | -24,364 | 512,152 | -33,569 |
| 1988 | 117,299 | -24,753 | 508,429 | -31,238 |
| 1987 | 112,885 | -25,127 | 502,229 | -34,651 |
| 1986 | 113,054 | -24,805 | 496,712 | -33,891 |
| 1985 | 110,949 | -23,840 | 488,887 | -13,887 |
| 1984 | 110,133 | -22,493 | 477,968 | -6,007 |
| 1983 | 110,618 | -20,620 | 469,781 | -4,243 |
| 1982 | 112,468 | -19,395 | 461,107 | -7,748 |
| 1981 | 110,421 | -17,353 | 453,158 | -11,123 |
| 1980 | 108,604 | -15,130 | 445,100 | -11,446 |
| 1979 | 96,429 | -14,152 | 439,110 | -17,148 |
| 1978 | 98,419 | -12,273 | 432,127 | -19,939 |
| 1977 | 100,498 | -11,082 | 425,428 | -25,117 |
| 1976 | 98,100 | -10,155 | 420,284 | -34,602 |
| 1975 | 95,230 | -9,349 | 414,400 | -34,382 |
| 1974 | 92,505 | -8,639 | 408,299 | -33,493 |
| 1973 | 89,662 | -7,947 | 400,752 | -28,191 |
| 1972 | 76,906 | -7,219 | 396,960 | -24,100 |
| 1971 | 84,139 | -6,328 | 391,506 | -20,209 |
| 1970 | 81,127 | -5,423 | 318,022 | -15,653 |
| 1969 | 78,237 | -4,592 | 379,347 | -12,776 |
| 1968 | 75,458 | -3,979 | 372,379 | -13,389 |
| 1967 | 72,722 | -3,666 | 365,224 | -13,837 |
| 1966 | 69,883 | -3,443 | 356,819 | -13,166 |
| 1965 | 67,056 | -3,231 | 349,245 | -12,470 |
| 1964 | 64,227 | -3,043 | 341,570 | -12,129 |
| 1963 | 61,738 | -2,881 | 332,352 | -10,040 |
| 1962 | 59,547 | -2,727 | 321,716 | -9,051 |
| 1961 | 57,499 | -2,579 | 313,385 | -7,063 |
| 1960 | 55,664 | -2,418 | 302,924 | -7,236 |
Data sources: World Bank | Health (1960–2025, retrieved 2026-07-08).
GeoRank.org/population/nicaragua/peru | CC BY
Over the last 10 years, 86.7% of the population change in Nicaragua is from natural causes (a gain of 1,008,982 people) and 13.3% is from migration (a loss of 154,697 people). In Peru 80.6% is from natural causes (a gain of 3,324,631 people) and 19.4% is from migration (a gain of 801,294 people).
As of 2024, 43,757 residents or 0.6% of the population were not native-born in Nicaragua, compared to 1,837,219 people or 5.4% in Peru.
Biggest cities by population
|
Nicaragua
|
|
|---|---|
| City | Population |
| Managua | 937K |
| Leon | 174K |
| Masaya | 140K |
| Matagalpa | 133K |
| Chinandega | 122K |
| Esteli | 112K |
| Granada | 105K |
| Jinotega | 99.4K |
| Juigalpa | 51.8K |
| San Juan del Sur | 14.7K |
|
Peru
|
|
|---|---|
| City | Population |
| Lima | 9.94M |
| Arequipa | 1.01M |
| Trujillo | 920K |
| Chiclayo | 553K |
| Callao | 537K |
| Piura | 473K |
| Cusco | 428K |
| Chimbote | 395K |
| Huancayo | 378K |
| Iquitos | 378K |
Compare countries by 7 more topics
Population differences between Nicaragua and Peru
|
Nicaragua
|
Peru
|
|
|---|---|---|
| Life expectancy | 75.4 years | 78.3 years |
| Average age | 29.6 years | 33.5 years |
| Median age | 27 years | 31.2 years |
| Male:Female ratio | 49.2:50.8 | 49.7:50.3 |
| Fertility rate | 2.21 births per woman | 1.97 births per woman |
| Population density | 152.8 ppl/mi² | 70.7 ppl/mi² |
Population map with other countries
Data sources: World Bank | Health (1960–2025, retrieved 2026-07-08); United Nations | World Population Prospects (1960–2026, retrieved 2026-07-08); U.S. Census Bureau (1960–2025, retrieved 2026-07-08); Central Intelligence Agency (CIA) (2000–2019, retrieved 2026-07-08).
GeoRank.org/population/nicaragua/peru | CC BY
Help us show the world through your eyes
Share a photo of your city and help others discover what it looks like to live there. Your contribution makes our data come alive.
Data sources:
- World Bank | Health (1960–2025, retrieved 2026-07-08)
- United Nations | World Population Prospects (1960–2100, retrieved 2026-07-08)
- U.S. Census Bureau (1960–2025, retrieved 2026-07-08)
- Wikidata (2026, retrieved 2026-07-08)
- Central Intelligence Agency (CIA) (2000–2019, retrieved 2026-07-08)
Creative Commons Attribution (CC BY) — you’re free to copy, share, remix, adapt, and use even commercially as long as you give appropriate credit and clearly indicate if you made changes. Other sources may be subject to different license terms.