The latest officially reported population of Colombia was 53,425,635 in 2025 vs 49,355,143 people in Spain in 2025. In 2026, based on the adjusted UN estimation, the current Colombia's population is 54,209,462 people compared to 49,323,658 in Spain.
Population statistics:
- Colombia's population is 1.1 times bigger than Spain's.
- Colombia is ranked the 28th most populous country in the world, while Spain is the 32nd.
- The countries together account for 1.25% of the world: 0.65% for Colombia vs 0.59% for Spain.
- For the last 10 years, Colombia has had an average growth rate of +1.26% per year vs +0.55% in Spain.
- Since 2006, the population of Colombia has increased from 42.7M people to 54.2M (27% growth), while Spain has grown from 44.4M to 49.3M (11.1% growth).
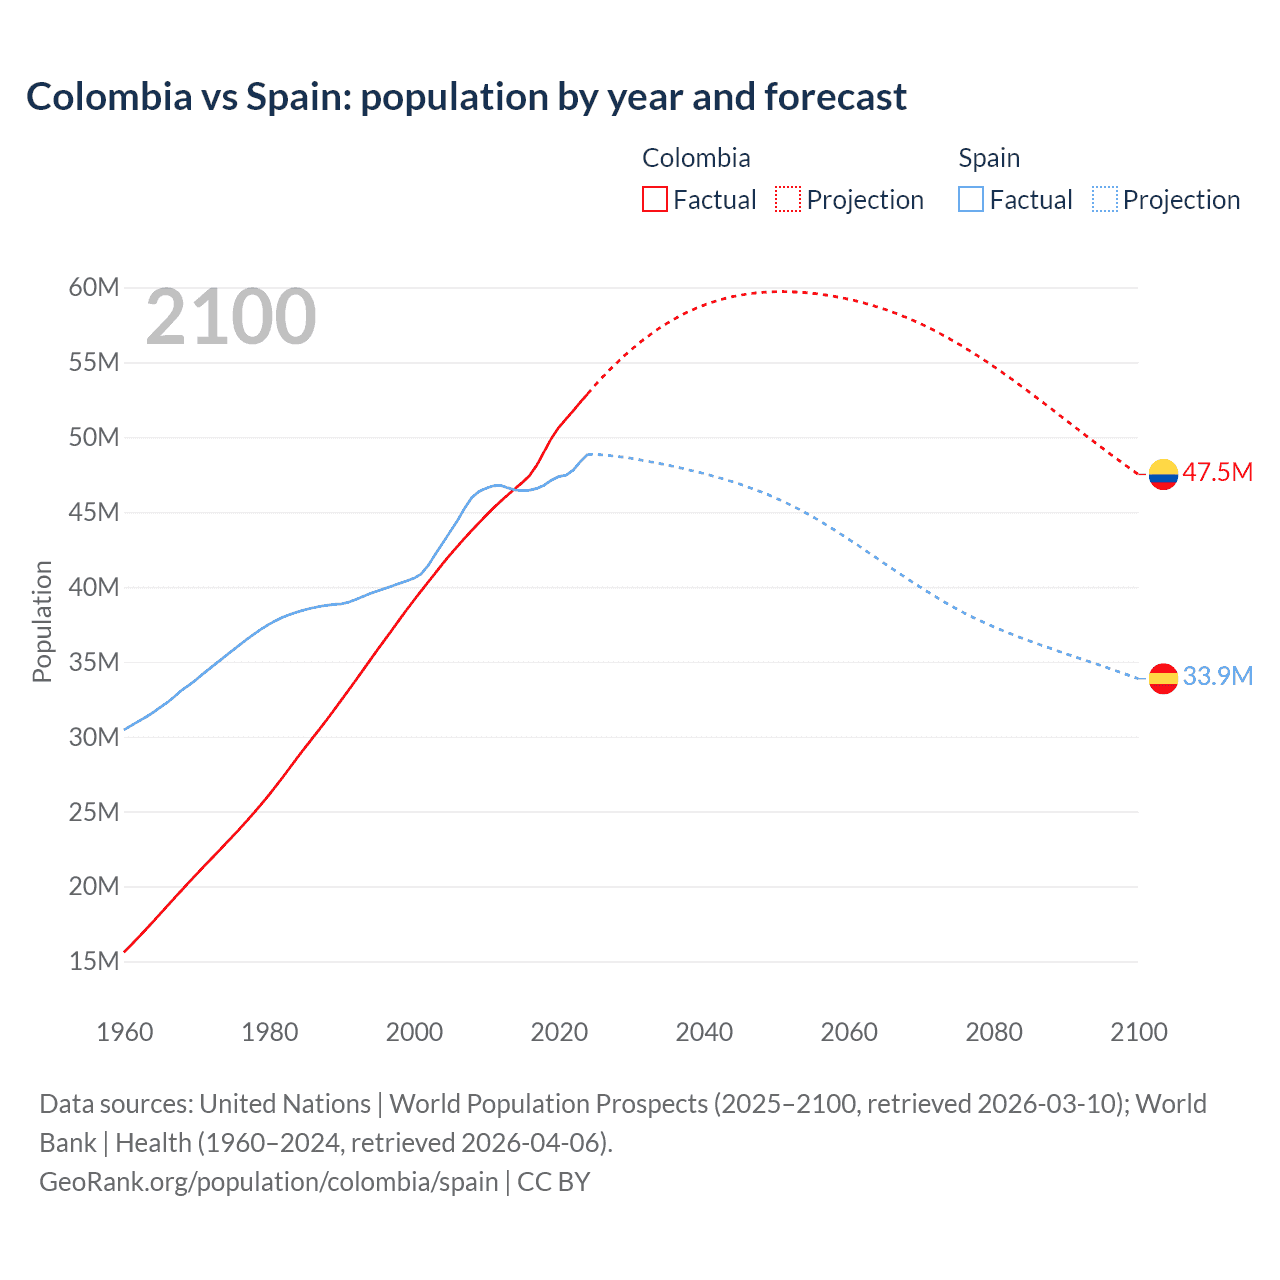
Colombia vs Spain: population by year and forecast
| Year | Population | |
|---|---|---|
 Colombia
|
 Spain
Spain
|
|
| 2100 | 47,484,139 | 34,221,514 |
| 2099 | 47,830,655 | 34,400,373 |
| 2098 | 48,181,819 | 34,577,450 |
| 2097 | 48,536,565 | 34,751,199 |
| 2096 | 48,894,308 | 34,917,831 |
| 2095 | 49,257,082 | 35,087,012 |
| 2094 | 49,624,336 | 35,251,362 |
| 2093 | 49,993,990 | 35,415,082 |
| 2092 | 50,365,329 | 35,577,396 |
| 2091 | 50,738,006 | 35,741,351 |
| 2090 | 51,111,627 | 35,912,083 |
| 2089 | 51,485,668 | 36,086,009 |
| 2088 | 51,859,452 | 36,257,546 |
| 2087 | 52,230,587 | 36,424,826 |
| 2086 | 52,598,291 | 36,594,101 |
| 2085 | 52,962,450 | 36,771,456 |
| 2084 | 53,322,246 | 36,951,760 |
| 2083 | 53,676,937 | 37,138,777 |
| 2082 | 54,026,216 | 37,327,720 |
| 2081 | 54,368,364 | 37,527,142 |
| 2080 | 54,703,696 | 37,732,838 |
| 2079 | 55,030,557 | 37,949,144 |
| 2078 | 55,349,907 | 38,171,047 |
| 2077 | 55,659,611 | 38,405,329 |
| 2076 | 55,959,176 | 38,654,221 |
| 2075 | 56,248,347 | 38,913,733 |
| 2074 | 56,527,033 | 39,188,284 |
| 2073 | 56,794,109 | 39,469,767 |
| 2072 | 57,050,141 | 39,765,059 |
| 2071 | 57,294,481 | 40,062,070 |
| 2070 | 57,526,873 | 40,372,388 |
| 2069 | 57,746,348 | 40,682,818 |
| 2068 | 57,954,274 | 41,005,148 |
| 2067 | 58,149,809 | 41,326,772 |
| 2066 | 58,333,112 | 41,654,672 |
| 2065 | 58,503,296 | 41,983,104 |
| 2064 | 58,662,119 | 42,321,736 |
| 2063 | 58,808,654 | 42,655,212 |
| 2062 | 58,944,276 | 42,993,328 |
| 2061 | 59,067,801 | 43,328,037 |
| 2060 | 59,180,318 | 43,648,753 |
| 2059 | 59,281,322 | 43,967,376 |
| 2058 | 59,371,363 | 44,273,756 |
| 2057 | 59,450,029 | 44,579,723 |
| 2056 | 59,517,427 | 44,885,952 |
| 2055 | 59,573,668 | 45,164,935 |
| 2054 | 59,618,199 | 45,434,986 |
| 2053 | 59,651,062 | 45,702,038 |
| 2052 | 59,672,031 | 45,951,973 |
| 2051 | 59,680,555 | 46,179,119 |
| 2050 | 59,676,848 | 46,397,620 |
| 2049 | 59,659,759 | 46,616,167 |
| 2048 | 59,629,100 | 46,812,693 |
| 2047 | 59,583,143 | 47,002,591 |
| 2046 | 59,521,825 | 47,182,235 |
| 2045 | 59,444,589 | 47,354,908 |
| 2044 | 59,348,507 | 47,514,076 |
| 2043 | 59,235,094 | 47,657,627 |
| 2042 | 59,102,840 | 47,801,904 |
| 2041 | 58,951,213 | 47,936,819 |
| 2040 | 58,780,376 | 48,066,825 |
| 2039 | 58,585,136 | 48,190,225 |
| 2038 | 58,369,901 | 48,304,880 |
| 2037 | 58,133,352 | 48,418,168 |
| 2036 | 57,870,584 | 48,528,778 |
| 2035 | 57,588,449 | 48,633,960 |
| 2034 | 57,279,396 | 48,730,594 |
| 2033 | 56,946,591 | 48,823,356 |
| 2032 | 56,592,496 | 48,914,944 |
| 2031 | 56,213,920 | 49,008,735 |
| 2030 | 55,809,671 | 49,094,273 |
| 2029 | 55,382,133 | 49,163,780 |
| 2028 | 54,930,329 | 49,223,677 |
| 2027 | 54,451,860 | 49,274,441 |
| 2026 | 53,953,448 | 49,323,658 |
| 2025 | 53,425,635 | 49,355,143 |
| 2024 | 52,886,363 | 48,848,840 |
| 2023 | 52,321,152 | 48,352,528 |
| 2022 | 51,737,944 | 47,786,102 |
| 2021 | 51,188,173 | 47,443,821 |
| 2020 | 50,629,997 | 47,359,424 |
| 2019 | 49,907,985 | 47,118,501 |
| 2018 | 49,024,465 | 46,782,011 |
| 2017 | 48,131,078 | 46,571,232 |
| 2016 | 47,437,512 | 46,458,139 |
| 2015 | 46,969,940 | 46,422,303 |
| 2014 | 46,565,429 | 46,460,733 |
| 2013 | 46,151,584 | 46,604,197 |
| 2012 | 45,715,810 | 46,773,055 |
| 2011 | 45,259,614 | 46,742,697 |
| 2010 | 44,777,319 | 46,576,897 |
| 2009 | 44,271,541 | 46,362,946 |
| 2008 | 43,758,808 | 45,954,106 |
| 2007 | 43,235,374 | 45,226,803 |
| 2006 | 42,691,084 | 44,397,319 |
| 2005 | 42,128,977 | 43,653,155 |
| 2004 | 41,543,171 | 42,921,895 |
| 2003 | 40,937,429 | 42,187,645 |
| 2002 | 40,324,680 | 41,431,558 |
| 2001 | 39,709,262 | 40,850,412 |
| 2000 | 39,089,934 | 40,567,864 |
| 1999 | 38,454,863 | 40,386,875 |
| 1998 | 37,792,165 | 40,223,509 |
| 1997 | 37,121,149 | 40,057,389 |
| 1996 | 36,462,745 | 39,889,852 |
| 1995 | 35,804,662 | 39,724,050 |
| 1994 | 35,127,410 | 39,549,108 |
| 1993 | 34,441,473 | 39,361,262 |
| 1992 | 33,760,571 | 39,157,685 |
| 1991 | 33,098,372 | 38,966,376 |
| 1990 | 32,440,069 | 38,867,322 |
| 1989 | 31,776,279 | 38,827,764 |
| 1988 | 31,130,524 | 38,766,939 |
| 1987 | 30,499,467 | 38,684,815 |
| 1986 | 29,879,112 | 38,584,624 |
| 1985 | 29,268,470 | 38,469,512 |
| 1984 | 28,642,690 | 38,330,364 |
| 1983 | 27,988,173 | 38,171,525 |
| 1982 | 27,338,331 | 37,986,012 |
| 1981 | 26,713,267 | 37,758,631 |
| 1980 | 26,104,498 | 37,491,165 |
| 1979 | 25,515,626 | 37,191,330 |
| 1978 | 24,950,337 | 36,864,898 |
| 1977 | 24,393,494 | 36,511,638 |
| 1976 | 23,858,810 | 36,137,812 |
| 1975 | 23,344,644 | 35,757,900 |
| 1974 | 22,833,469 | 35,373,335 |
| 1973 | 22,325,374 | 34,988,947 |
| 1972 | 21,819,563 | 34,604,469 |
| 1971 | 21,319,096 | 34,224,490 |
| 1970 | 20,811,782 | 33,814,531 |
| 1969 | 20,291,942 | 33,441,054 |
| 1968 | 19,766,796 | 33,113,134 |
| 1967 | 19,235,618 | 32,682,947 |
| 1966 | 18,702,688 | 32,283,194 |
| 1965 | 18,169,050 | 31,954,292 |
| 1964 | 17,637,411 | 31,609,195 |
| 1963 | 17,113,823 | 31,296,651 |
| 1962 | 16,599,029 | 31,023,366 |
| 1961 | 16,095,203 | 30,739,250 |
| 1960 | 15,606,209 | 30,455,000 |
Data sources: United Nations | World Population Prospects (2026–2100, retrieved 2026-07-08); World Bank | Health (1960–2025, retrieved 2026-07-08).
GeoRank.org/population/colombia/spain | CC BY 
From 2006 to 2016, the population of Colombia increased by 4,746,428 people (a 11.1% growth), while Spain gained 2,060,820 people (a 4.64% growth).
For the next 10 years, from 2016 to 2026, Colombia gained 6,771,950 people (a 14.3% growth), while Spain's population increased by 2,865,519 people (a 6.17% growth).
Colombia was ranked 29th most populous country in 2006 and is 28th in 2026. Spain was ranked 28th in 2006 and ranked 32nd now.
The UN's World Population Prospects forecasts that in 24 years (in 2050) Colombia's population will grow by 10.1% to 59,676,848 people with a rank change from 28th to 34th. The population of Spain will decrease by 5.93% to 46,397,620 people and rank change from 32nd to 46th.
Colombia is projected to reach its peak in 2051 at 59.7M people, while Spain's population already peaked in 2025 at 49.4M people and is projected to decrease to 34.2M people by 2100.
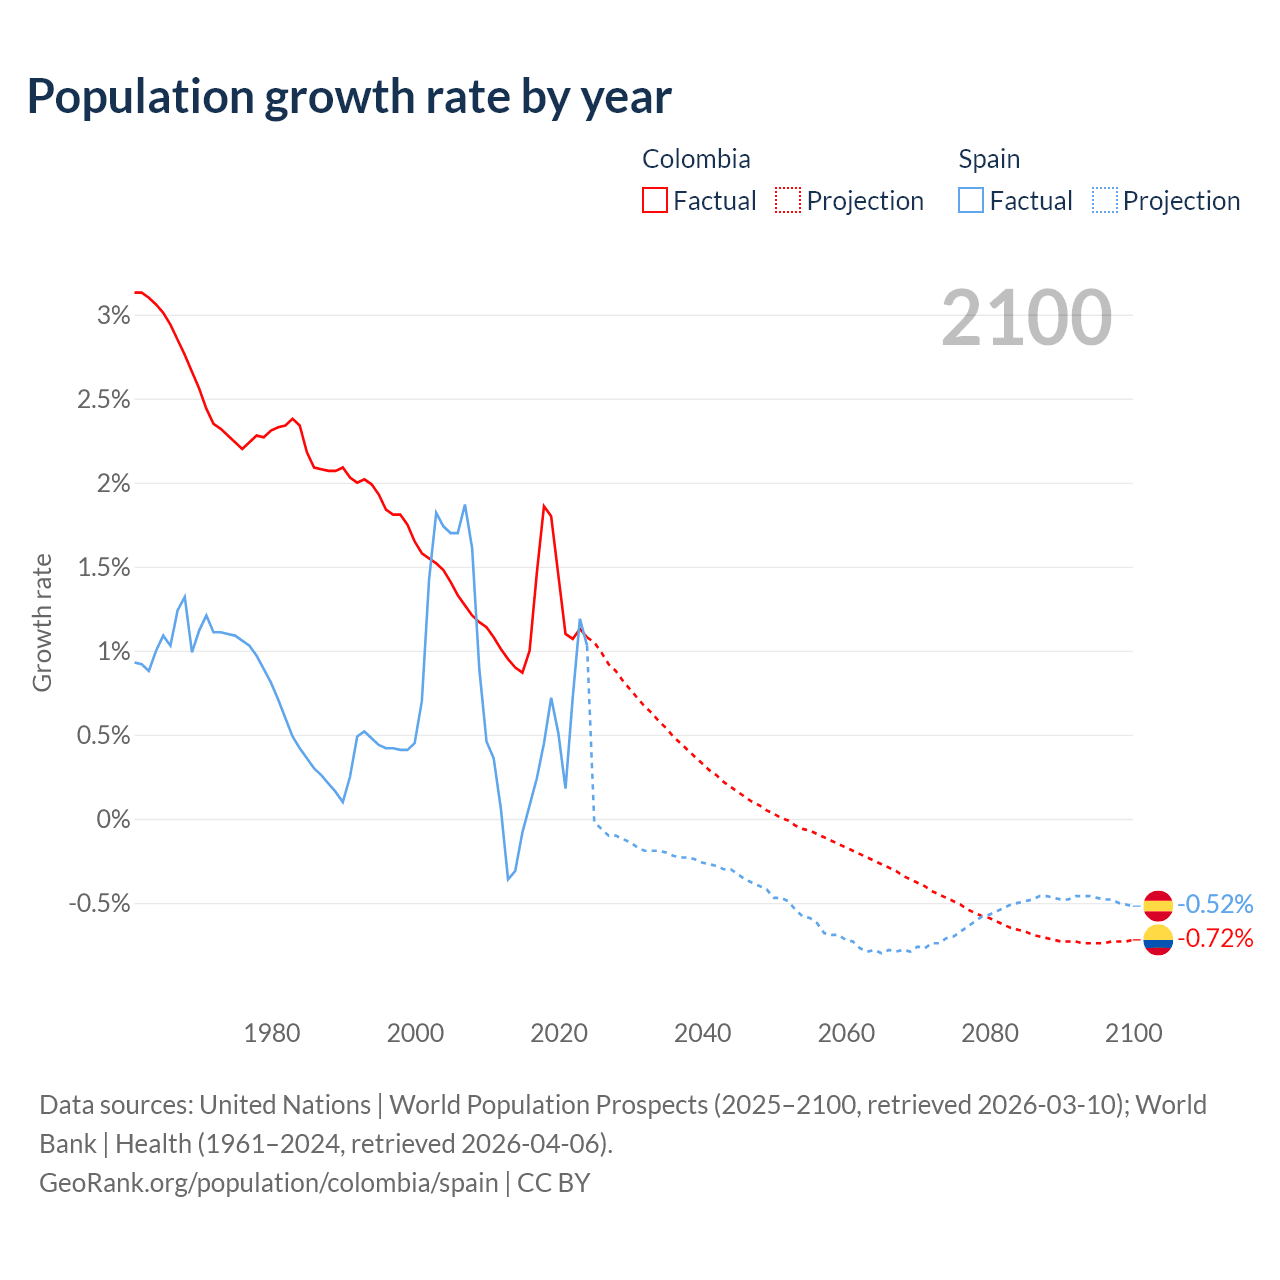
Population growth rate by year
| Year | Growth rate | |
|---|---|---|
|
Colombia
|
Spain
|
|
| 2100 | -0.72% | -0.52% |
| 2099 | -0.73% | -0.51% |
| 2098 | -0.73% | -0.5% |
| 2097 | -0.73% | -0.48% |
| 2096 | -0.74% | -0.48% |
| 2095 | -0.74% | -0.47% |
| 2094 | -0.74% | -0.46% |
| 2093 | -0.74% | -0.46% |
| 2092 | -0.73% | -0.46% |
| 2091 | -0.73% | -0.48% |
| 2090 | -0.73% | -0.48% |
| 2089 | -0.72% | -0.47% |
| 2088 | -0.71% | -0.46% |
| 2087 | -0.7% | -0.46% |
| 2086 | -0.69% | -0.48% |
| 2085 | -0.67% | -0.49% |
| 2084 | -0.66% | -0.5% |
| 2083 | -0.65% | -0.51% |
| 2082 | -0.63% | -0.53% |
| 2081 | -0.61% | -0.55% |
| 2080 | -0.59% | -0.57% |
| 2079 | -0.58% | -0.58% |
| 2078 | -0.56% | -0.61% |
| 2077 | -0.54% | -0.64% |
| 2076 | -0.51% | -0.67% |
| 2075 | -0.49% | -0.7% |
| 2074 | -0.47% | -0.71% |
| 2073 | -0.45% | -0.74% |
| 2072 | -0.43% | -0.74% |
| 2071 | -0.4% | -0.77% |
| 2070 | -0.38% | -0.76% |
| 2069 | -0.36% | -0.79% |
| 2068 | -0.34% | -0.78% |
| 2067 | -0.31% | -0.79% |
| 2066 | -0.29% | -0.78% |
| 2065 | -0.27% | -0.8% |
| 2064 | -0.25% | -0.78% |
| 2063 | -0.23% | -0.79% |
| 2062 | -0.21% | -0.77% |
| 2061 | -0.19% | -0.73% |
| 2060 | -0.17% | -0.72% |
| 2059 | -0.15% | -0.69% |
| 2058 | -0.13% | -0.69% |
| 2057 | -0.11% | -0.68% |
| 2056 | -0.09% | -0.62% |
| 2055 | -0.07% | -0.59% |
| 2054 | -0.06% | -0.58% |
| 2053 | -0.04% | -0.54% |
| 2052 | -0.01% | -0.49% |
| 2051 | 0.006% | -0.47% |
| 2050 | 0.03% | -0.47% |
| 2049 | 0.05% | -0.42% |
| 2048 | 0.08% | -0.4% |
| 2047 | 0.1% | -0.38% |
| 2046 | 0.13% | -0.36% |
| 2045 | 0.16% | -0.33% |
| 2044 | 0.19% | -0.3% |
| 2043 | 0.22% | -0.3% |
| 2042 | 0.26% | -0.28% |
| 2041 | 0.29% | -0.27% |
| 2040 | 0.33% | -0.26% |
| 2039 | 0.37% | -0.24% |
| 2038 | 0.41% | -0.23% |
| 2037 | 0.45% | -0.23% |
| 2036 | 0.49% | -0.22% |
| 2035 | 0.54% | -0.2% |
| 2034 | 0.58% | -0.19% |
| 2033 | 0.63% | -0.19% |
| 2032 | 0.67% | -0.19% |
| 2031 | 0.72% | -0.17% |
| 2030 | 0.77% | -0.14% |
| 2029 | 0.82% | -0.12% |
| 2028 | 0.88% | -0.1% |
| 2027 | 0.92% | -0.1% |
| 2026 | 0.99% | -0.06% |
| 2025 | 1.02% | 1.04% |
| 2024 | 1.08% | 1.03% |
| 2023 | 1.13% | 1.19% |
| 2022 | 1.07% | 0.72% |
| 2021 | 1.1% | 0.18% |
| 2020 | 1.45% | 0.51% |
| 2019 | 1.8% | 0.72% |
| 2018 | 1.86% | 0.45% |
| 2017 | 1.46% | 0.24% |
| 2016 | 1% | 0.08% |
| 2015 | 0.87% | -0.08% |
| 2014 | 0.9% | -0.31% |
| 2013 | 0.95% | -0.36% |
| 2012 | 1.01% | 0.06% |
| 2011 | 1.08% | 0.36% |
| 2010 | 1.14% | 0.46% |
| 2009 | 1.17% | 0.89% |
| 2008 | 1.21% | 1.61% |
| 2007 | 1.27% | 1.87% |
| 2006 | 1.33% | 1.7% |
| 2005 | 1.41% | 1.7% |
| 2004 | 1.48% | 1.74% |
| 2003 | 1.52% | 1.82% |
| 2002 | 1.55% | 1.42% |
| 2001 | 1.58% | 0.7% |
| 2000 | 1.65% | 0.45% |
| 1999 | 1.75% | 0.41% |
| 1998 | 1.81% | 0.41% |
| 1997 | 1.81% | 0.42% |
| 1996 | 1.84% | 0.42% |
| 1995 | 1.93% | 0.44% |
| 1994 | 1.99% | 0.48% |
| 1993 | 2.02% | 0.52% |
| 1992 | 2% | 0.49% |
| 1991 | 2.03% | 0.25% |
| 1990 | 2.09% | 0.1% |
| 1989 | 2.07% | 0.16% |
| 1988 | 2.07% | 0.21% |
| 1987 | 2.08% | 0.26% |
| 1986 | 2.09% | 0.3% |
| 1985 | 2.18% | 0.36% |
| 1984 | 2.34% | 0.42% |
| 1983 | 2.38% | 0.49% |
| 1982 | 2.34% | 0.6% |
| 1981 | 2.33% | 0.71% |
| 1980 | 2.31% | 0.81% |
| 1979 | 2.27% | 0.89% |
| 1978 | 2.28% | 0.97% |
| 1977 | 2.24% | 1.03% |
| 1976 | 2.2% | 1.06% |
| 1975 | 2.24% | 1.09% |
| 1974 | 2.28% | 1.1% |
| 1973 | 2.32% | 1.11% |
| 1972 | 2.35% | 1.11% |
| 1971 | 2.44% | 1.21% |
| 1970 | 2.56% | 1.12% |
| 1969 | 2.66% | 0.99% |
| 1968 | 2.76% | 1.32% |
| 1967 | 2.85% | 1.24% |
| 1966 | 2.94% | 1.03% |
| 1965 | 3.01% | 1.09% |
| 1964 | 3.06% | 1% |
| 1963 | 3.1% | 0.88% |
| 1962 | 3.13% | 0.92% |
| 1961 | 3.13% | 0.93% |
Data sources: United Nations | World Population Prospects (2026–2100, retrieved 2026-07-08); World Bank | Health (1961–2025, retrieved 2026-07-08).
GeoRank.org/population/colombia/spain | CC BY
In 2025, the population of Colombia grew by 1.02%, while Spain's population grew by 1.04%.
Live population counters
|
Colombia
|
Spain
|
|
|---|---|---|
| Current population |
54209462
|
49323658
|
| Population rank | 28/197 | 32/197 |
| Percent of world population | 0.65% | 0.59% |
| One net population change |
58.6 seconds
|
1.04 minutes
|
| One birth every |
45 seconds
|
1.66 minutes
|
| One death every |
1.82 minutes
|
1.21 minutes
|
| Daily growth/decline | +1,477 | +1,387 |
| Annual growth/decline | +539,272 | +506,303 |
| Annual growth/decline rate | +1.02% | +1.04% |
| Population growth rate rank | 100/197 | 98/197 |
| One migration net change every |
4.08 minutes
|
5.45 minutes
|
| Annual migration change | +129,139 | +96,630 |
| Net migration rank | 12/196 | 17/196 |
| Foreign-born residents | 3,063,518 | 8,870,527 |
| Foreign-born residents rank | 22/195 | 6/195 |
| Foreign-born share of population | 5.8% | 18.5% |
| Foreign-born share rank | 89/195 | 32/195 |
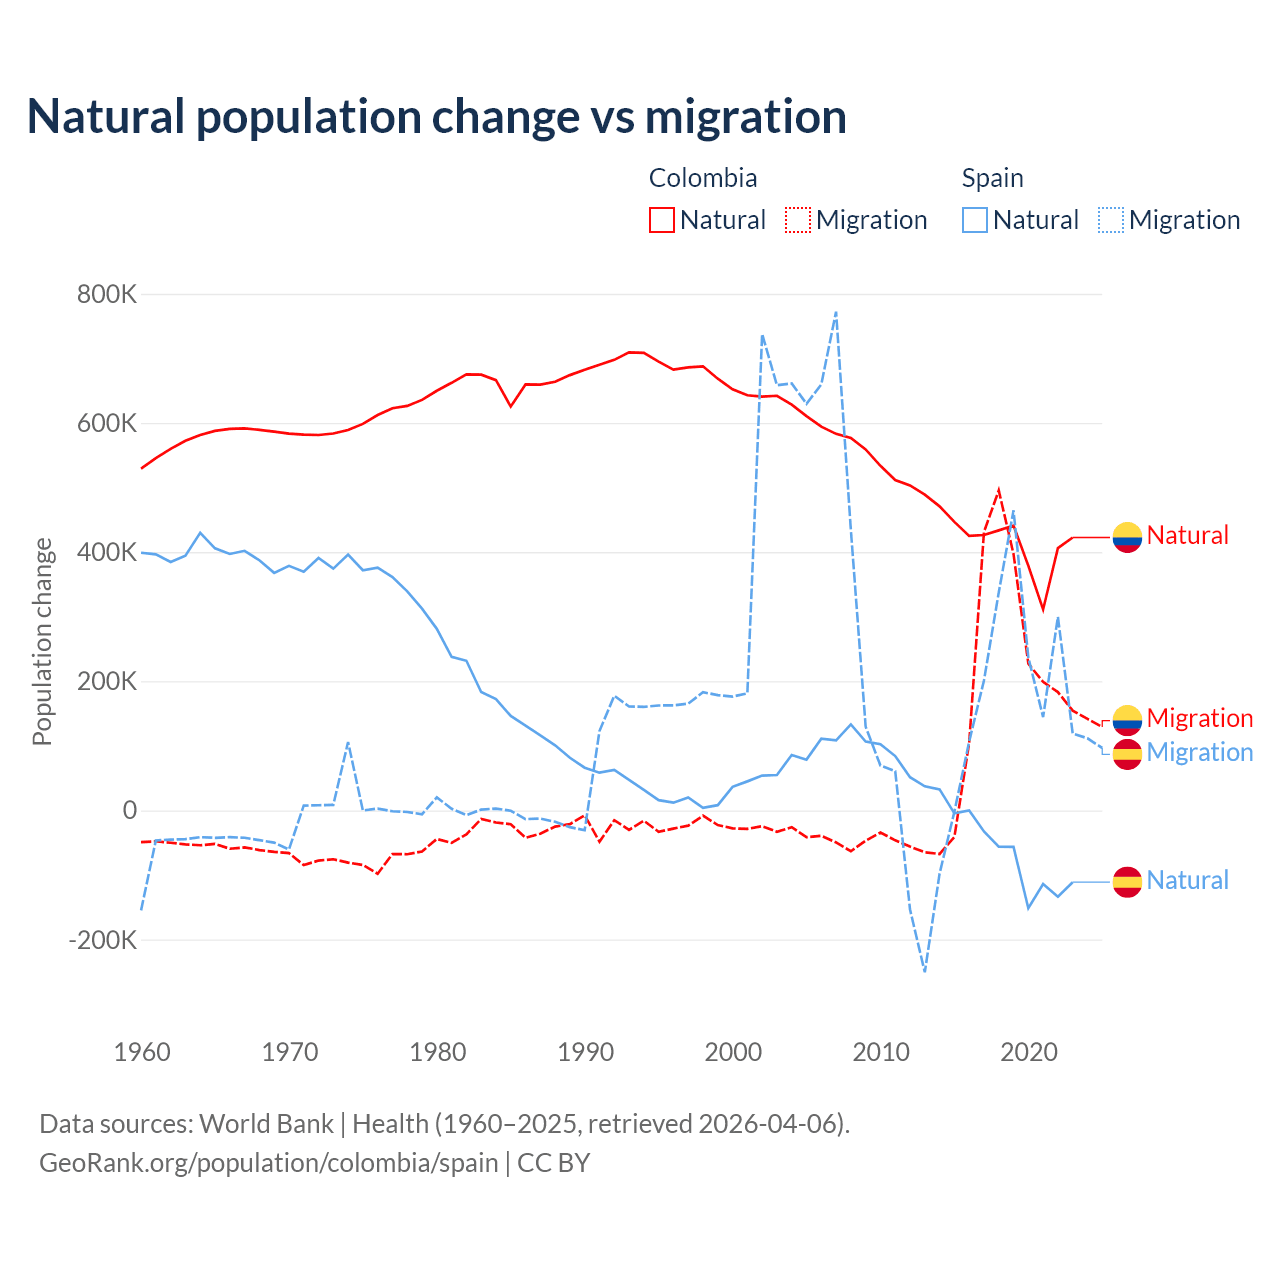
Natural population change vs migration
| Year | Population change | |||
|---|---|---|---|---|
|
Colombia
|
Spain
|
|||
| Natural | Migration | Natural | Migration | |
| 2025 | - | 129,139 | - | 96,630 |
| 2024 | 411,721 | 141,643 | -117,237 | 111,674 |
| 2023 | 422,598 | 154,521 | -116,046 | 119,099 |
| 2022 | 406,143 | 183,180 | -133,801 | 299,779 |
| 2021 | 311,122 | 199,070 | -113,865 | 144,385 |
| 2020 | 378,965 | 227,130 | -151,551 | 236,854 |
| 2019 | 441,087 | 396,826 | -56,542 | 464,783 |
| 2018 | 433,622 | 495,524 | -56,139 | 337,467 |
| 2017 | 426,538 | 431,072 | -32,600 | 201,135 |
| 2016 | 425,087 | 104,373 | 0 | 106,474 |
| 2015 | 446,778 | -41,123 | -4,642 | -1,979 |
| 2014 | 470,916 | -67,522 | 32,522 | -97,870 |
| 2013 | 489,069 | -64,789 | 37,284 | -250,741 |
| 2012 | 503,285 | -56,070 | 51,450 | -153,486 |
| 2011 | 511,524 | -46,385 | 84,137 | 60,761 |
| 2010 | 533,657 | -34,220 | 102,469 | 69,406 |
| 2009 | 559,017 | -46,901 | 106,635 | 129,557 |
| 2008 | 576,654 | -63,313 | 133,267 | 434,135 |
| 2007 | 583,115 | -49,634 | 108,545 | 772,317 |
| 2006 | 594,388 | -39,303 | 110,994 | 659,720 |
| 2005 | 610,618 | -41,465 | 78,576 | 629,803 |
| 2004 | 628,424 | -25,949 | 85,844 | 661,158 |
| 2003 | 642,144 | -33,114 | 54,844 | 658,428 |
| 2002 | 640,840 | -24,387 | 53,861 | 737,880 |
| 2001 | 642,933 | -28,582 | 44,936 | 181,307 |
| 2000 | 652,176 | -27,878 | 36,512 | 176,269 |
| 1999 | 668,576 | -22,698 | 8,077 | 178,559 |
| 1998 | 687,704 | -8,186 | 4,022 | 182,926 |
| 1997 | 686,073 | -23,600 | 20,028 | 165,345 |
| 1996 | 682,547 | -28,251 | 11,967 | 162,704 |
| 1995 | 694,968 | -33,097 | 15,889 | 162,434 |
| 1994 | 708,660 | -16,023 | 31,639 | 160,407 |
| 1993 | 709,287 | -30,103 | 47,234 | 160,907 |
| 1992 | 697,763 | -15,147 | 62,652 | 177,544 |
| 1991 | 690,266 | -48,458 | 58,450 | 122,841 |
| 1990 | 682,409 | -7,590 | 66,075 | -30,684 |
| 1989 | 674,102 | -21,329 | 81,538 | -25,892 |
| 1988 | 663,796 | -25,064 | 100,794 | -17,663 |
| 1987 | 659,429 | -36,040 | 116,054 | -12,681 |
| 1986 | 659,701 | -42,368 | 131,188 | -13,540 |
| 1985 | 625,379 | -21,408 | 146,184 | -589 |
| 1984 | 666,315 | -18,692 | 172,487 | 2,754 |
| 1983 | 674,767 | -13,329 | 183,223 | 1,241 |
| 1982 | 675,339 | -37,090 | 231,714 | -7,384 |
| 1981 | 662,195 | -50,351 | 237,879 | 2,563 |
| 1980 | 649,872 | -44,203 | 281,184 | 20,166 |
| 1979 | 635,747 | -63,657 | 312,407 | -5,929 |
| 1978 | 626,378 | -67,870 | 339,157 | -2,504 |
| 1977 | 622,814 | -67,638 | 361,465 | -1,332 |
| 1976 | 612,265 | -98,057 | 375,834 | 2,804 |
| 1975 | 598,580 | -84,462 | 371,882 | -218 |
| 1974 | 589,035 | -80,816 | 396,182 | 105,838 |
| 1973 | 583,608 | -75,630 | 374,381 | 8,624 |
| 1972 | 581,361 | -77,708 | 391,030 | 7,935 |
| 1971 | 582,011 | -84,712 | 369,625 | 7,363 |
| 1970 | 583,396 | -66,065 | 378,723 | -60,580 |
| 1969 | 586,559 | -64,238 | 367,851 | -49,956 |
| 1968 | 589,407 | -61,442 | 387,423 | -46,088 |
| 1967 | 591,649 | -57,256 | 402,001 | -42,344 |
| 1966 | 590,855 | -59,395 | 397,084 | -41,467 |
| 1965 | 587,677 | -51,855 | 405,819 | -42,476 |
| 1964 | 581,435 | -53,972 | 429,885 | -41,461 |
| 1963 | 572,355 | -52,631 | 394,338 | -44,446 |
| 1962 | 559,985 | -50,108 | 384,690 | -45,211 |
| 1961 | 545,627 | -47,849 | 396,537 | -46,517 |
| 1960 | 529,316 | -49,115 | 398,960 | -154,869 |
Data sources: World Bank | Health (1960–2025, retrieved 2026-07-08).
GeoRank.org/population/colombia/spain | CC BY
Over the last 10 years, 64.2% of the population change in Colombia is from natural causes (a gain of 4,103,661 people) and 35.8% is from migration (a gain of 2,292,216 people). In Spain 27.9% is from natural causes (a loss of 782,423 people) and 72.1% is from migration (a gain of 2,019,671 people).
As of 2024, 3,063,518 residents or 5.8% of the population were not native-born in Colombia, compared to 8,870,527 people or 18.5% in Spain.
Biggest cities by population
|
Colombia
|
|
|---|---|
| City | Population |
| Bogota | 8.03M |
| Medellin | 2.53M |
| Cali | 2.47M |
| Barranquilla | 1.33M |
| Cartagena | 915K |
| Cucuta | 806K |
| Soacha | 783K |
| Soledad | 676K |
| Villavicencio | 664K |
| Bucaramanga | 615K |
|
Spain
|
|
|---|---|
| City | Population |
| Madrid | 3.51M |
| Barcelona | 1.73M |
| Tenerife | 955K |
| Valencia | 841K |
| Zaragoza | 693K |
| Seville | 689K |
| Malaga | 599K |
| Palma de Mallorca | 435K |
| Las Palmas | 382K |
| Alicante | 366K |
Compare countries by 7 more topics
Population differences between Colombia and Spain
|
Colombia
|
Spain
|
|
|---|---|---|
| Life expectancy | 78.3 years | 84.1 years |
| Average age | 35.4 years | 45 years |
| Median age | 33.5 years | 46.8 years |
| Male:Female ratio | 49.3:50.7 | 49.1:50.9 |
| Fertility rate | 1.63 births per woman | 1.1 births per woman |
| Population density | 125.9 ppl/mi² | 255.7 ppl/mi² |
Population map with other countries
Data sources: World Bank | Health (1960–2025, retrieved 2026-07-08); United Nations | World Population Prospects (1960–2026, retrieved 2026-07-08); U.S. Census Bureau (1960–2025, retrieved 2026-07-08); Central Intelligence Agency (CIA) (2000–2019, retrieved 2026-07-08).
GeoRank.org/population/colombia/spain | CC BY
Help us show the world through your eyes
Share a photo of your city and help others discover what it looks like to live there. Your contribution makes our data come alive.
Data sources:
- World Bank | Health (1960–2025, retrieved 2026-07-08)
- United Nations | World Population Prospects (1960–2100, retrieved 2026-07-08)
- U.S. Census Bureau (1960–2025, retrieved 2026-07-08)
- Wikidata (2026, retrieved 2026-07-08)
- Central Intelligence Agency (CIA) (2000–2019, retrieved 2026-07-08)
Creative Commons Attribution (CC BY) — you’re free to copy, share, remix, adapt, and use even commercially as long as you give appropriate credit and clearly indicate if you made changes. Other sources may be subject to different license terms.