The latest officially reported population of Bulgaria was 6,433,302 in 2025 vs 49,355,143 people in Spain in 2025. In 2026, based on the adjusted UN estimation, the current Bulgaria's population is 6,390,149 people compared to 49,323,658 in Spain.
Population statistics:
- Spain's population is 7.72 times bigger than Bulgaria's.
- Bulgaria is ranked the 112th most populous country in the world, while Spain is the 32nd.
- The countries together account for 0.67% of the world: 0.08% for Bulgaria vs 0.59% for Spain.
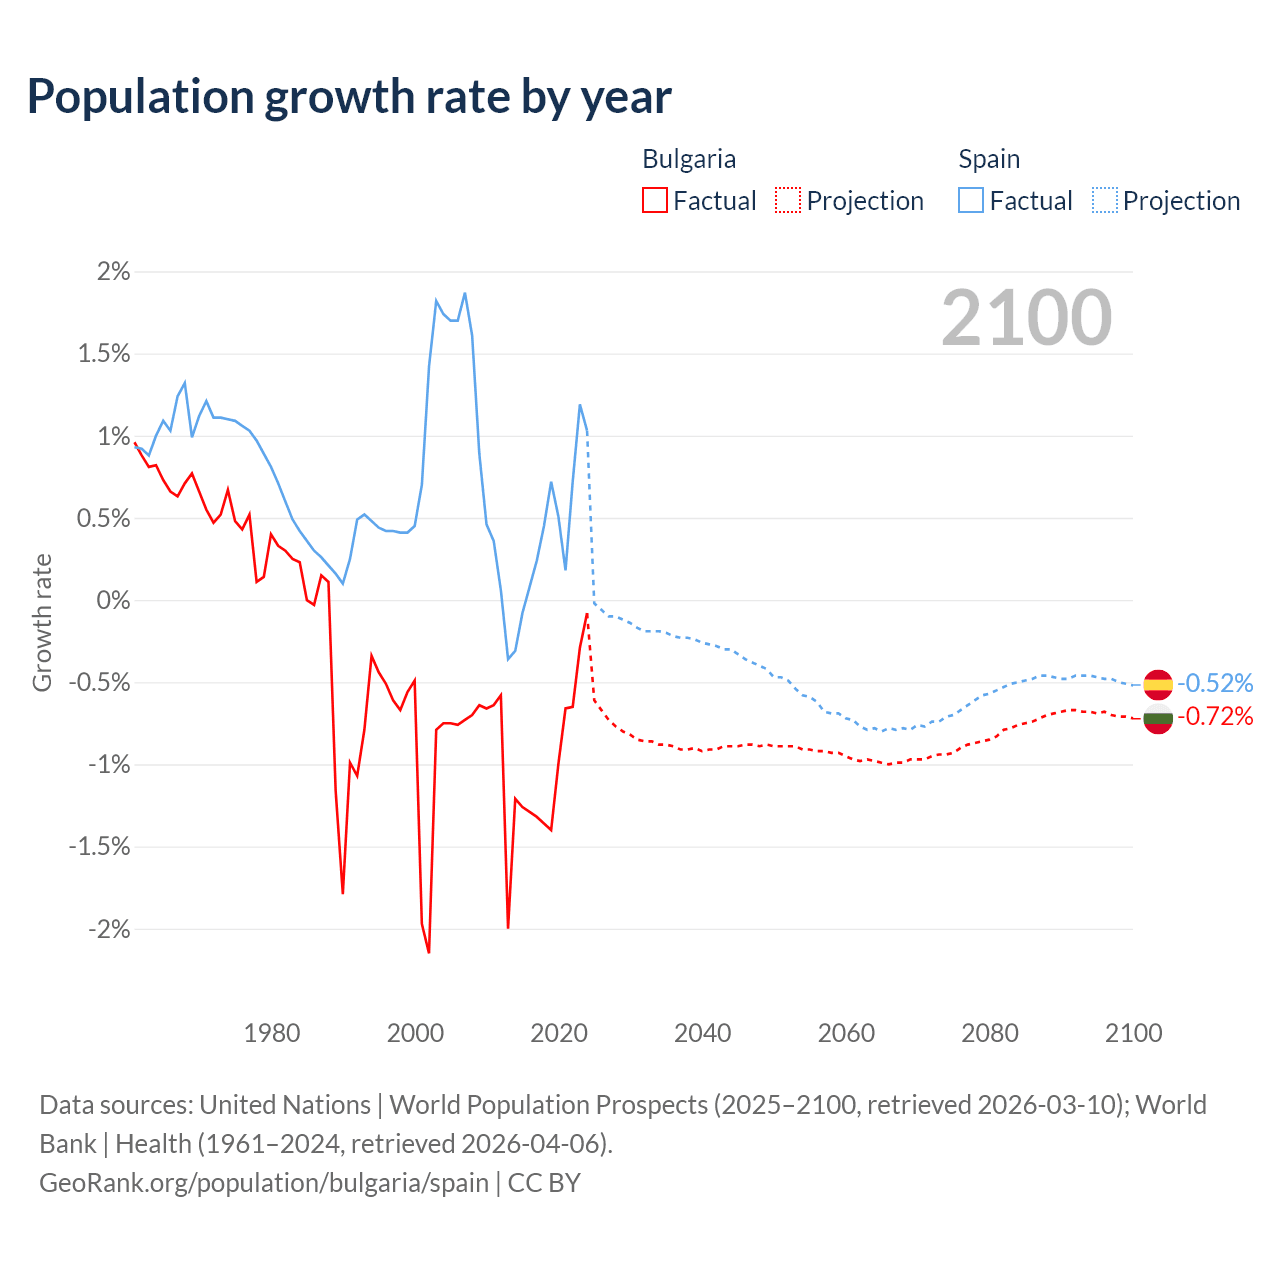
- For the last 10 years, Bulgaria has had an average growth rate of -0.86% per year vs +0.55% in Spain.
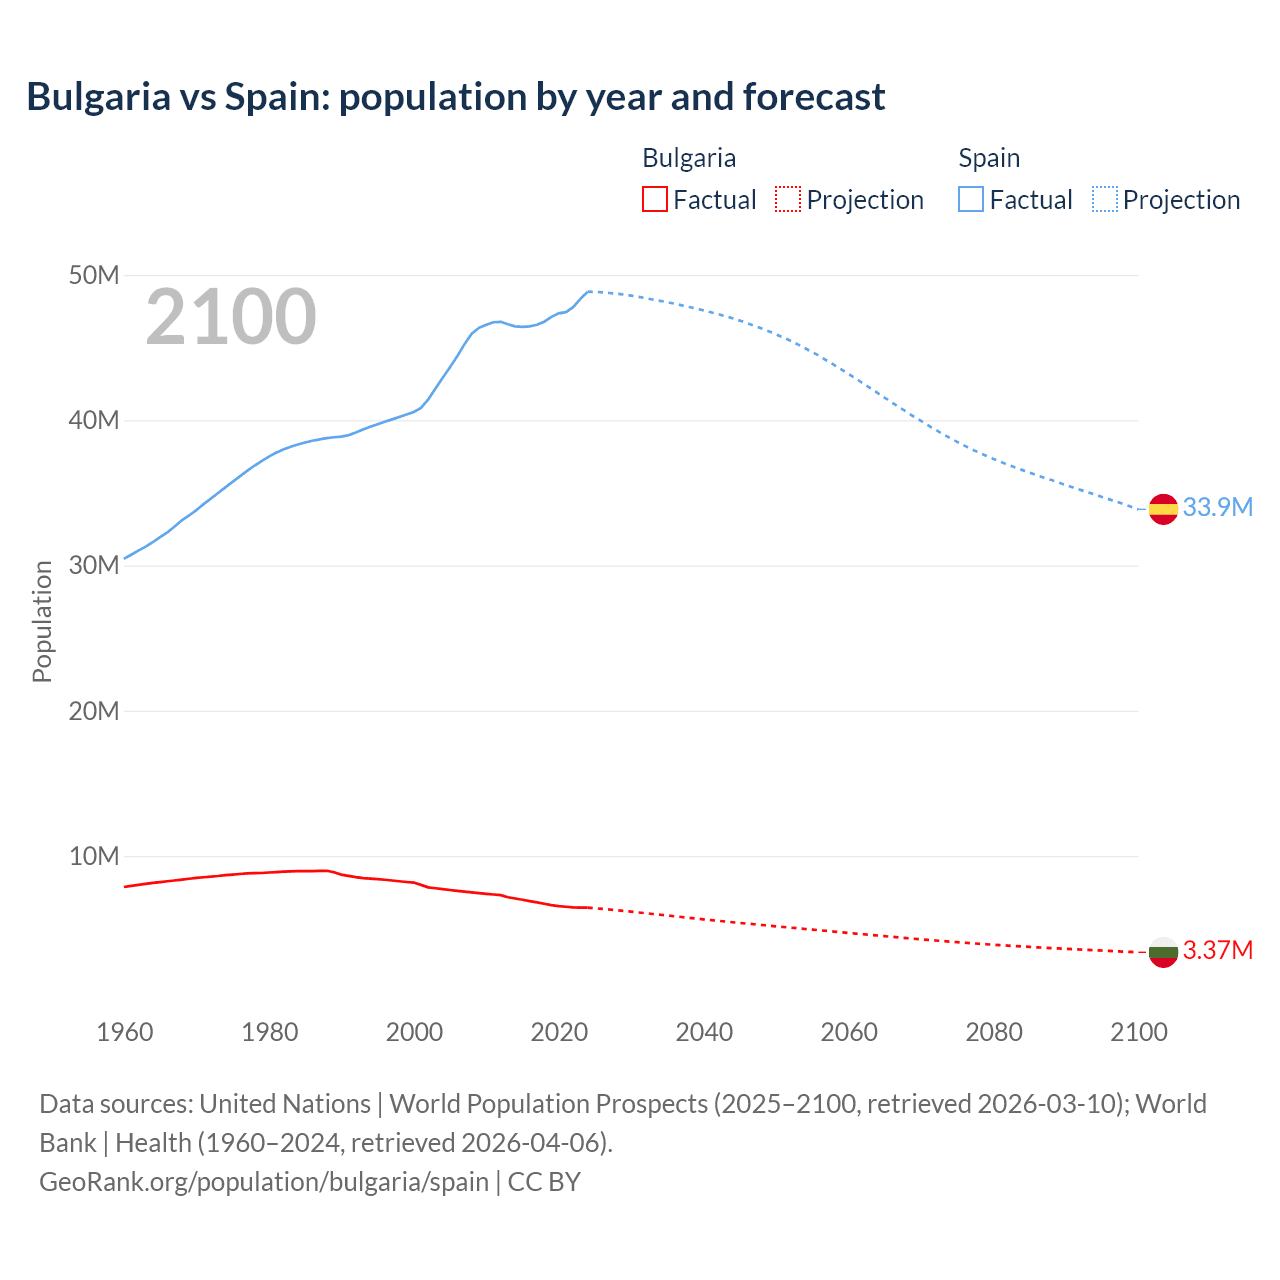
- Since 2006, the population of Bulgaria has decreased from 7.6M people to 6.39M (15.9% decline), while Spain has grown from 44.4M to 49.3M (11.1% growth).
Bulgaria vs Spain: population by year and forecast
| Year | Population | |
|---|---|---|
 Bulgaria
|
 Spain
Spain
|
|
| 2100 | 3,384,288 | 34,221,514 |
| 2099 | 3,408,821 | 34,400,373 |
| 2098 | 3,433,149 | 34,577,450 |
| 2097 | 3,457,549 | 34,751,199 |
| 2096 | 3,482,057 | 34,917,831 |
| 2095 | 3,506,060 | 35,087,012 |
| 2094 | 3,530,278 | 35,251,362 |
| 2093 | 3,554,432 | 35,415,082 |
| 2092 | 3,578,667 | 35,577,396 |
| 2091 | 3,602,907 | 35,741,351 |
| 2090 | 3,627,300 | 35,912,083 |
| 2089 | 3,652,188 | 36,086,009 |
| 2088 | 3,677,416 | 36,257,546 |
| 2087 | 3,703,460 | 36,424,826 |
| 2086 | 3,730,284 | 36,594,101 |
| 2085 | 3,757,953 | 36,771,456 |
| 2084 | 3,786,496 | 36,951,760 |
| 2083 | 3,815,548 | 37,138,777 |
| 2082 | 3,845,662 | 37,327,720 |
| 2081 | 3,876,344 | 37,527,142 |
| 2080 | 3,908,874 | 37,732,838 |
| 2079 | 3,942,344 | 37,949,144 |
| 2078 | 3,976,345 | 38,171,047 |
| 2077 | 4,011,440 | 38,405,329 |
| 2076 | 4,047,182 | 38,654,221 |
| 2075 | 4,083,977 | 38,913,733 |
| 2074 | 4,122,447 | 39,188,284 |
| 2073 | 4,161,511 | 39,469,767 |
| 2072 | 4,201,158 | 39,765,059 |
| 2071 | 4,241,639 | 40,062,070 |
| 2070 | 4,283,145 | 40,372,388 |
| 2069 | 4,325,083 | 40,682,818 |
| 2068 | 4,367,606 | 41,005,148 |
| 2067 | 4,411,116 | 41,326,772 |
| 2066 | 4,455,358 | 41,654,672 |
| 2065 | 4,500,141 | 41,983,104 |
| 2064 | 4,545,243 | 42,321,736 |
| 2063 | 4,590,439 | 42,655,212 |
| 2062 | 4,635,634 | 42,993,328 |
| 2061 | 4,681,315 | 43,328,037 |
| 2060 | 4,727,089 | 43,648,753 |
| 2059 | 4,772,667 | 43,967,376 |
| 2058 | 4,817,532 | 44,273,756 |
| 2057 | 4,862,597 | 44,579,723 |
| 2056 | 4,907,646 | 44,885,952 |
| 2055 | 4,953,105 | 45,164,935 |
| 2054 | 4,998,650 | 45,434,986 |
| 2053 | 5,044,397 | 45,702,038 |
| 2052 | 5,089,817 | 45,951,973 |
| 2051 | 5,135,505 | 46,179,119 |
| 2050 | 5,181,635 | 46,397,620 |
| 2049 | 5,228,058 | 46,616,167 |
| 2048 | 5,274,692 | 46,812,693 |
| 2047 | 5,322,212 | 47,002,591 |
| 2046 | 5,369,645 | 47,182,235 |
| 2045 | 5,417,381 | 47,354,908 |
| 2044 | 5,465,818 | 47,514,076 |
| 2043 | 5,514,902 | 47,657,627 |
| 2042 | 5,564,573 | 47,801,904 |
| 2041 | 5,615,489 | 47,936,819 |
| 2040 | 5,667,076 | 48,066,825 |
| 2039 | 5,719,506 | 48,190,225 |
| 2038 | 5,771,452 | 48,304,880 |
| 2037 | 5,824,628 | 48,418,168 |
| 2036 | 5,877,980 | 48,528,778 |
| 2035 | 5,930,517 | 48,633,960 |
| 2034 | 5,983,205 | 48,730,594 |
| 2033 | 6,036,049 | 48,823,356 |
| 2032 | 6,088,107 | 48,914,944 |
| 2031 | 6,140,619 | 49,008,735 |
| 2030 | 6,193,318 | 49,094,273 |
| 2029 | 6,244,785 | 49,163,780 |
| 2028 | 6,294,981 | 49,223,677 |
| 2027 | 6,343,732 | 49,274,441 |
| 2026 | 6,390,149 | 49,323,658 |
| 2025 | 6,433,302 | 49,355,143 |
| 2024 | 6,441,421 | 48,848,840 |
| 2023 | 6,446,596 | 48,352,528 |
| 2022 | 6,465,097 | 47,786,102 |
| 2021 | 6,507,301 | 47,443,821 |
| 2020 | 6,550,696 | 47,359,424 |
| 2019 | 6,616,726 | 47,118,501 |
| 2018 | 6,710,798 | 46,782,011 |
| 2017 | 6,803,468 | 46,571,232 |
| 2016 | 6,894,139 | 46,458,139 |
| 2015 | 6,984,225 | 46,422,303 |
| 2014 | 7,073,572 | 46,460,733 |
| 2013 | 7,160,005 | 46,604,197 |
| 2012 | 7,305,888 | 46,773,055 |
| 2011 | 7,348,328 | 46,742,697 |
| 2010 | 7,395,599 | 46,576,897 |
| 2009 | 7,444,443 | 46,362,946 |
| 2008 | 7,492,561 | 45,954,106 |
| 2007 | 7,545,338 | 45,226,803 |
| 2006 | 7,601,022 | 44,397,319 |
| 2005 | 7,658,972 | 43,653,155 |
| 2004 | 7,716,860 | 42,921,895 |
| 2003 | 7,775,327 | 42,187,645 |
| 2002 | 7,837,161 | 41,431,558 |
| 2001 | 8,009,142 | 40,850,412 |
| 2000 | 8,170,172 | 40,567,864 |
| 1999 | 8,210,624 | 40,386,875 |
| 1998 | 8,256,786 | 40,223,509 |
| 1997 | 8,312,068 | 40,057,389 |
| 1996 | 8,362,826 | 39,889,852 |
| 1995 | 8,406,067 | 39,724,050 |
| 1994 | 8,443,591 | 39,549,108 |
| 1993 | 8,472,313 | 39,361,262 |
| 1992 | 8,540,164 | 39,157,685 |
| 1991 | 8,632,367 | 38,966,376 |
| 1990 | 8,718,289 | 38,867,322 |
| 1989 | 8,876,972 | 38,827,764 |
| 1988 | 8,981,446 | 38,766,939 |
| 1987 | 8,971,359 | 38,684,815 |
| 1986 | 8,958,171 | 38,584,624 |
| 1985 | 8,960,547 | 38,469,512 |
| 1984 | 8,960,679 | 38,330,364 |
| 1983 | 8,939,738 | 38,171,525 |
| 1982 | 8,917,457 | 37,986,012 |
| 1981 | 8,891,117 | 37,758,631 |
| 1980 | 8,861,535 | 37,491,165 |
| 1979 | 8,825,940 | 37,191,330 |
| 1978 | 8,814,032 | 36,864,898 |
| 1977 | 8,804,183 | 36,511,638 |
| 1976 | 8,758,599 | 36,137,812 |
| 1975 | 8,720,742 | 35,757,900 |
| 1974 | 8,678,745 | 35,373,335 |
| 1973 | 8,620,967 | 34,988,947 |
| 1972 | 8,576,200 | 34,604,469 |
| 1971 | 8,536,395 | 34,224,490 |
| 1970 | 8,489,574 | 33,814,531 |
| 1969 | 8,434,172 | 33,441,054 |
| 1968 | 8,369,603 | 33,113,134 |
| 1967 | 8,310,226 | 32,682,947 |
| 1966 | 8,258,057 | 32,283,194 |
| 1965 | 8,204,168 | 31,954,292 |
| 1964 | 8,144,340 | 31,609,195 |
| 1963 | 8,078,145 | 31,296,651 |
| 1962 | 8,012,946 | 31,023,366 |
| 1961 | 7,943,118 | 30,739,250 |
| 1960 | 7,867,374 | 30,455,000 |
Data sources: United Nations | World Population Prospects (2026–2100, retrieved 2026-07-08); World Bank | Health (1960–2025, retrieved 2026-07-08).
GeoRank.org/population/bulgaria/spain | CC BY 
From 2006 to 2016, the population of Bulgaria decreased by 706,883 people (a 9.3% decline), while Spain gained 2,060,820 people (a 4.64% growth).
For the next 10 years, from 2016 to 2026, Bulgaria lost 503,990 people (a 7.31% decline), while Spain's population increased by 2,865,519 people (a 6.17% growth).
Bulgaria was ranked 95th most populous country in 2006 and is 112th in 2026. Spain was ranked 28th in 2006 and ranked 32nd now.
The UN's World Population Prospects forecasts that in 24 years (in 2050) Bulgaria's population will shrink by 18.9% to 5,181,635 people with a rank change from 112th to 128th. The population of Spain will decrease by 5.93% to 46,397,620 people and rank change from 32nd to 46th.
Both countries are in a period of decline and in 50 years are projected to lose 36.7% of the population in Bulgaria and 21.6% in Spain.
Population growth rate by year
| Year | Growth rate | |
|---|---|---|
|
Bulgaria
|
Spain
|
|
| 2100 | -0.72% | -0.52% |
| 2099 | -0.71% | -0.51% |
| 2098 | -0.71% | -0.5% |
| 2097 | -0.7% | -0.48% |
| 2096 | -0.68% | -0.48% |
| 2095 | -0.69% | -0.47% |
| 2094 | -0.68% | -0.46% |
| 2093 | -0.68% | -0.46% |
| 2092 | -0.67% | -0.46% |
| 2091 | -0.67% | -0.48% |
| 2090 | -0.68% | -0.48% |
| 2089 | -0.69% | -0.47% |
| 2088 | -0.7% | -0.46% |
| 2087 | -0.72% | -0.46% |
| 2086 | -0.74% | -0.48% |
| 2085 | -0.75% | -0.49% |
| 2084 | -0.76% | -0.5% |
| 2083 | -0.78% | -0.51% |
| 2082 | -0.79% | -0.53% |
| 2081 | -0.83% | -0.55% |
| 2080 | -0.85% | -0.57% |
| 2079 | -0.86% | -0.58% |
| 2078 | -0.87% | -0.61% |
| 2077 | -0.88% | -0.64% |
| 2076 | -0.9% | -0.67% |
| 2075 | -0.93% | -0.7% |
| 2074 | -0.94% | -0.71% |
| 2073 | -0.94% | -0.74% |
| 2072 | -0.95% | -0.74% |
| 2071 | -0.97% | -0.77% |
| 2070 | -0.97% | -0.76% |
| 2069 | -0.97% | -0.79% |
| 2068 | -0.99% | -0.78% |
| 2067 | -0.99% | -0.79% |
| 2066 | -1% | -0.78% |
| 2065 | -0.99% | -0.8% |
| 2064 | -0.98% | -0.78% |
| 2063 | -0.97% | -0.79% |
| 2062 | -0.98% | -0.77% |
| 2061 | -0.97% | -0.73% |
| 2060 | -0.95% | -0.72% |
| 2059 | -0.93% | -0.69% |
| 2058 | -0.93% | -0.69% |
| 2057 | -0.92% | -0.68% |
| 2056 | -0.92% | -0.62% |
| 2055 | -0.91% | -0.59% |
| 2054 | -0.91% | -0.58% |
| 2053 | -0.89% | -0.54% |
| 2052 | -0.89% | -0.49% |
| 2051 | -0.89% | -0.47% |
| 2050 | -0.89% | -0.47% |
| 2049 | -0.88% | -0.42% |
| 2048 | -0.89% | -0.4% |
| 2047 | -0.88% | -0.38% |
| 2046 | -0.88% | -0.36% |
| 2045 | -0.89% | -0.33% |
| 2044 | -0.89% | -0.3% |
| 2043 | -0.89% | -0.3% |
| 2042 | -0.91% | -0.28% |
| 2041 | -0.91% | -0.27% |
| 2040 | -0.92% | -0.26% |
| 2039 | -0.9% | -0.24% |
| 2038 | -0.91% | -0.23% |
| 2037 | -0.91% | -0.23% |
| 2036 | -0.89% | -0.22% |
| 2035 | -0.88% | -0.2% |
| 2034 | -0.88% | -0.19% |
| 2033 | -0.86% | -0.19% |
| 2032 | -0.86% | -0.19% |
| 2031 | -0.85% | -0.17% |
| 2030 | -0.82% | -0.14% |
| 2029 | -0.8% | -0.12% |
| 2028 | -0.77% | -0.1% |
| 2027 | -0.73% | -0.1% |
| 2026 | -0.67% | -0.06% |
| 2025 | -0.13% | 1.04% |
| 2024 | -0.08% | 1.03% |
| 2023 | -0.29% | 1.19% |
| 2022 | -0.65% | 0.72% |
| 2021 | -0.66% | 0.18% |
| 2020 | -1% | 0.51% |
| 2019 | -1.4% | 0.72% |
| 2018 | -1.36% | 0.45% |
| 2017 | -1.32% | 0.24% |
| 2016 | -1.29% | 0.08% |
| 2015 | -1.26% | -0.08% |
| 2014 | -1.21% | -0.31% |
| 2013 | -2% | -0.36% |
| 2012 | -0.58% | 0.06% |
| 2011 | -0.64% | 0.36% |
| 2010 | -0.66% | 0.46% |
| 2009 | -0.64% | 0.89% |
| 2008 | -0.7% | 1.61% |
| 2007 | -0.73% | 1.87% |
| 2006 | -0.76% | 1.7% |
| 2005 | -0.75% | 1.7% |
| 2004 | -0.75% | 1.74% |
| 2003 | -0.79% | 1.82% |
| 2002 | -2.15% | 1.42% |
| 2001 | -1.97% | 0.7% |
| 2000 | -0.49% | 0.45% |
| 1999 | -0.56% | 0.41% |
| 1998 | -0.67% | 0.41% |
| 1997 | -0.61% | 0.42% |
| 1996 | -0.51% | 0.42% |
| 1995 | -0.44% | 0.44% |
| 1994 | -0.34% | 0.48% |
| 1993 | -0.79% | 0.52% |
| 1992 | -1.07% | 0.49% |
| 1991 | -0.99% | 0.25% |
| 1990 | -1.79% | 0.1% |
| 1989 | -1.16% | 0.16% |
| 1988 | 0.11% | 0.21% |
| 1987 | 0.15% | 0.26% |
| 1986 | -0.03% | 0.3% |
| 1985 | -0.001% | 0.36% |
| 1984 | 0.23% | 0.42% |
| 1983 | 0.25% | 0.49% |
| 1982 | 0.3% | 0.6% |
| 1981 | 0.33% | 0.71% |
| 1980 | 0.4% | 0.81% |
| 1979 | 0.14% | 0.89% |
| 1978 | 0.11% | 0.97% |
| 1977 | 0.52% | 1.03% |
| 1976 | 0.43% | 1.06% |
| 1975 | 0.48% | 1.09% |
| 1974 | 0.67% | 1.1% |
| 1973 | 0.52% | 1.11% |
| 1972 | 0.47% | 1.11% |
| 1971 | 0.55% | 1.21% |
| 1970 | 0.66% | 1.12% |
| 1969 | 0.77% | 0.99% |
| 1968 | 0.71% | 1.32% |
| 1967 | 0.63% | 1.24% |
| 1966 | 0.66% | 1.03% |
| 1965 | 0.73% | 1.09% |
| 1964 | 0.82% | 1% |
| 1963 | 0.81% | 0.88% |
| 1962 | 0.88% | 0.92% |
| 1961 | 0.96% | 0.93% |
Data sources: United Nations | World Population Prospects (2026–2100, retrieved 2026-07-08); World Bank | Health (1961–2025, retrieved 2026-07-08).
GeoRank.org/population/bulgaria/spain | CC BY
In 2025, the population of Bulgaria declined by 0.13%, while Spain's population grew by 1.04%.
Live population counters
|
Bulgaria
|
Spain
|
|
|---|---|---|
| Current population |
6390149
|
49323658
|
| Population rank | 112/197 | 32/197 |
| Percent of world population | 0.08% | 0.59% |
| One net population change |
1.08 hours
|
1.04 minutes
|
| One birth every |
9.83 minutes
|
1.66 minutes
|
| One death every |
5.23 minutes
|
1.21 minutes
|
| Daily growth/decline | -22 | +1,387 |
| Annual growth/decline | -8,119 | +506,303 |
| Annual growth/decline rate | -0.13% | +1.04% |
| Population growth rate rank | 168/197 | 98/197 |
| One migration net change every |
2.97 hours
|
5.45 minutes
|
| Annual migration change | -2,961 | +96,630 |
| Net migration rank | 106/196 | 17/196 |
| Foreign-born residents | 299,100 | 8,870,527 |
| Foreign-born residents rank | 98/195 | 6/195 |
| Foreign-born share of population | 4.4% | 18.5% |
| Foreign-born share rank | 99/195 | 32/195 |
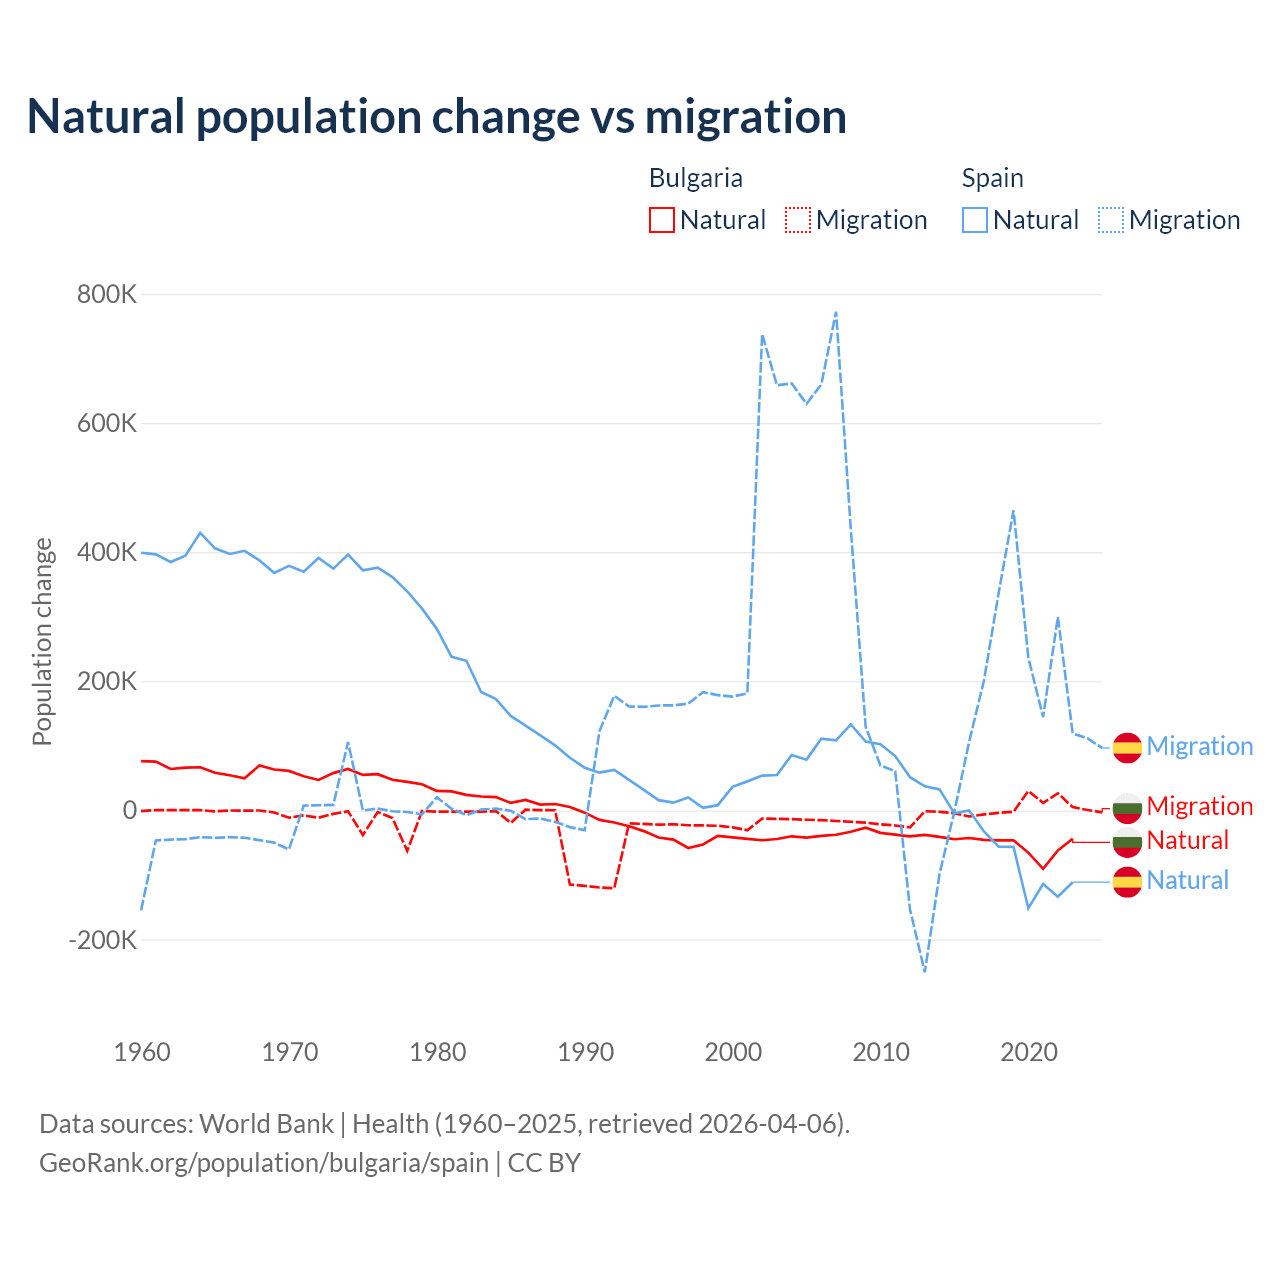
Natural population change vs migration
| Year | Population change | |||
|---|---|---|---|---|
|
Bulgaria
|
Spain
|
|||
| Natural | Migration | Natural | Migration | |
| 2025 | - | -2,961 | - | 96,630 |
| 2024 | -47,023 | 524 | -117,237 | 111,674 |
| 2023 | -43,837 | 5,173 | -116,046 | 119,099 |
| 2022 | -62,065 | 26,498 | -133,801 | 299,779 |
| 2021 | -90,452 | 11,756 | -113,865 | 144,385 |
| 2020 | -65,507 | 30,167 | -151,551 | 236,854 |
| 2019 | -46,317 | -2,156 | -56,542 | 464,783 |
| 2018 | -46,304 | -3,873 | -56,139 | 337,467 |
| 2017 | -45,583 | -6,109 | -32,600 | 201,135 |
| 2016 | -42,744 | -9,482 | 0 | 106,474 |
| 2015 | -44,699 | -4,227 | -4,642 | -1,979 |
| 2014 | -41,027 | -2,180 | 32,522 | -97,870 |
| 2013 | -37,948 | -1,324 | 37,284 | -250,741 |
| 2012 | -40,183 | -26,334 | 51,450 | -153,486 |
| 2011 | -37,477 | -23,360 | 84,137 | 60,761 |
| 2010 | -34,759 | -21,668 | 102,469 | 69,406 |
| 2009 | -26,800 | -19,060 | 106,635 | 129,557 |
| 2008 | -32,967 | -17,595 | 133,267 | 434,135 |
| 2007 | -37,727 | -16,366 | 108,545 | 772,317 |
| 2006 | -39,526 | -15,184 | 110,994 | 659,720 |
| 2005 | -42,124 | -14,435 | 78,576 | 629,803 |
| 2004 | -40,128 | -13,604 | 85,844 | 661,158 |
| 2003 | -44,319 | -13,183 | 54,844 | 658,428 |
| 2002 | -46,240 | -12,735 | 53,861 | 737,880 |
| 2001 | -44,050 | -30,726 | 44,936 | 181,307 |
| 2000 | -41,668 | -26,211 | 36,512 | 176,269 |
| 1999 | -39,411 | -23,846 | 8,077 | 178,559 |
| 1998 | -52,844 | -23,262 | 4,022 | 182,926 |
| 1997 | -58,185 | -22,963 | 20,028 | 165,345 |
| 1996 | -45,159 | -21,520 | 11,967 | 162,704 |
| 1995 | -42,030 | -22,020 | 15,889 | 162,434 |
| 1994 | -32,086 | -20,984 | 31,639 | 160,407 |
| 1993 | -24,569 | -19,973 | 47,234 | 160,907 |
| 1992 | -18,789 | -120,552 | 62,652 | 177,544 |
| 1991 | -14,675 | -119,356 | 58,450 | 122,841 |
| 1990 | -3,487 | -116,817 | 66,075 | -30,684 |
| 1989 | 5,326 | -114,705 | 81,538 | -25,892 |
| 1988 | 9,879 | 215 | 100,794 | -17,663 |
| 1987 | 8,971 | 357 | 116,054 | -12,681 |
| 1986 | 16,125 | 1,104 | 131,188 | -13,540 |
| 1985 | 11,649 | -19,230 | 146,184 | -589 |
| 1984 | 20,610 | -1,032 | 172,487 | 2,754 |
| 1983 | 21,455 | -1,872 | 183,223 | 1,241 |
| 1982 | 24,077 | -1,860 | 231,714 | -7,384 |
| 1981 | 29,341 | -1,830 | 237,879 | 2,563 |
| 1980 | 30,129 | -2,045 | 281,184 | 20,166 |
| 1979 | 40,599 | -872 | 312,407 | -5,929 |
| 1978 | 44,070 | -62,769 | 339,157 | -2,504 |
| 1977 | 47,543 | -11,955 | 361,465 | -1,332 |
| 1976 | 56,055 | -2,522 | 375,834 | 2,804 |
| 1975 | 54,941 | -38,071 | 371,882 | -218 |
| 1974 | 64,223 | -1,402 | 396,182 | 105,838 |
| 1973 | 57,760 | -5,409 | 374,381 | 8,624 |
| 1972 | 47,169 | -11,296 | 391,030 | 7,935 |
| 1971 | 52,925 | -7,654 | 369,625 | 7,363 |
| 1970 | 61,125 | -11,315 | 378,723 | -60,580 |
| 1969 | 63,256 | -3,204 | 367,851 | -49,956 |
| 1968 | 69,468 | -132 | 387,423 | -46,088 |
| 1967 | 49,861 | -420 | 402,001 | -42,344 |
| 1966 | 54,504 | -144 | 397,084 | -41,467 |
| 1965 | 58,249 | -1,406 | 405,819 | -42,476 |
| 1964 | 66,783 | 505 | 429,885 | -41,461 |
| 1963 | 66,241 | 500 | 394,338 | -44,446 |
| 1962 | 64,104 | 499 | 384,690 | -45,211 |
| 1961 | 75,460 | 378 | 396,537 | -46,517 |
| 1960 | 76,314 | -1,112 | 398,960 | -154,869 |
Data sources: World Bank | Health (1960–2025, retrieved 2026-07-08).
GeoRank.org/population/bulgaria/spain | CC BY
Over the last 10 years, 91.7% of the population change in Bulgaria is from natural causes (a loss of 534,531 people) and 8.28% is from migration (a gain of 48,271 people). In Spain 27.9% is from natural causes (a loss of 782,423 people) and 72.1% is from migration (a gain of 2,019,671 people).
As of 2024, 299,100 residents or 4.4% of the population were not native-born in Bulgaria, compared to 8,870,527 people or 18.5% in Spain.
Biggest cities by population
|
Bulgaria
|
|
|---|---|
| City | Population |
| Sofia | 1.21M |
| Plovdiv | 334K |
| Varna | 323K |
| Burgas | 189K |
| Stara Zagora | 121K |
| Ruse | 120K |
| Pleven | 88.1K |
| Sliven | 77.8K |
| Dobrich | 68.6K |
| Shumen | 66.4K |
|
Spain
|
|
|---|---|
| City | Population |
| Madrid | 3.51M |
| Barcelona | 1.73M |
| Tenerife | 955K |
| Valencia | 841K |
| Zaragoza | 693K |
| Seville | 689K |
| Malaga | 599K |
| Palma de Mallorca | 435K |
| Las Palmas | 382K |
| Alicante | 366K |
Compare countries by 7 more topics
Population differences between Bulgaria and Spain
|
Bulgaria
|
Spain
|
|
|---|---|---|
| Life expectancy | 76.1 years | 84.1 years |
| Average age | 44.2 years | 45 years |
| Median age | 45.7 years | 46.8 years |
| Male:Female ratio | 48.4:51.6 | 49.1:50.9 |
| Fertility rate | 1.72 births per woman | 1.1 births per woman |
| Population density | 152.5 ppl/mi² | 255.7 ppl/mi² |
Population map with other countries
Data sources: World Bank | Health (1960–2025, retrieved 2026-07-08); United Nations | World Population Prospects (1960–2026, retrieved 2026-07-08); U.S. Census Bureau (1960–2025, retrieved 2026-07-08); Central Intelligence Agency (CIA) (2000–2019, retrieved 2026-07-08).
GeoRank.org/population/bulgaria/spain | CC BY
Help us show the world through your eyes
Share a photo of your city and help others discover what it looks like to live there. Your contribution makes our data come alive.
Data sources:
- World Bank | Health (1960–2025, retrieved 2026-07-08)
- United Nations | World Population Prospects (1960–2100, retrieved 2026-07-08)
- U.S. Census Bureau (1960–2025, retrieved 2026-07-08)
- Wikidata (2026, retrieved 2026-07-08)
- Central Intelligence Agency (CIA) (2000–2019, retrieved 2026-07-08)
Creative Commons Attribution (CC BY) — you’re free to copy, share, remix, adapt, and use even commercially as long as you give appropriate credit and clearly indicate if you made changes. Other sources may be subject to different license terms.