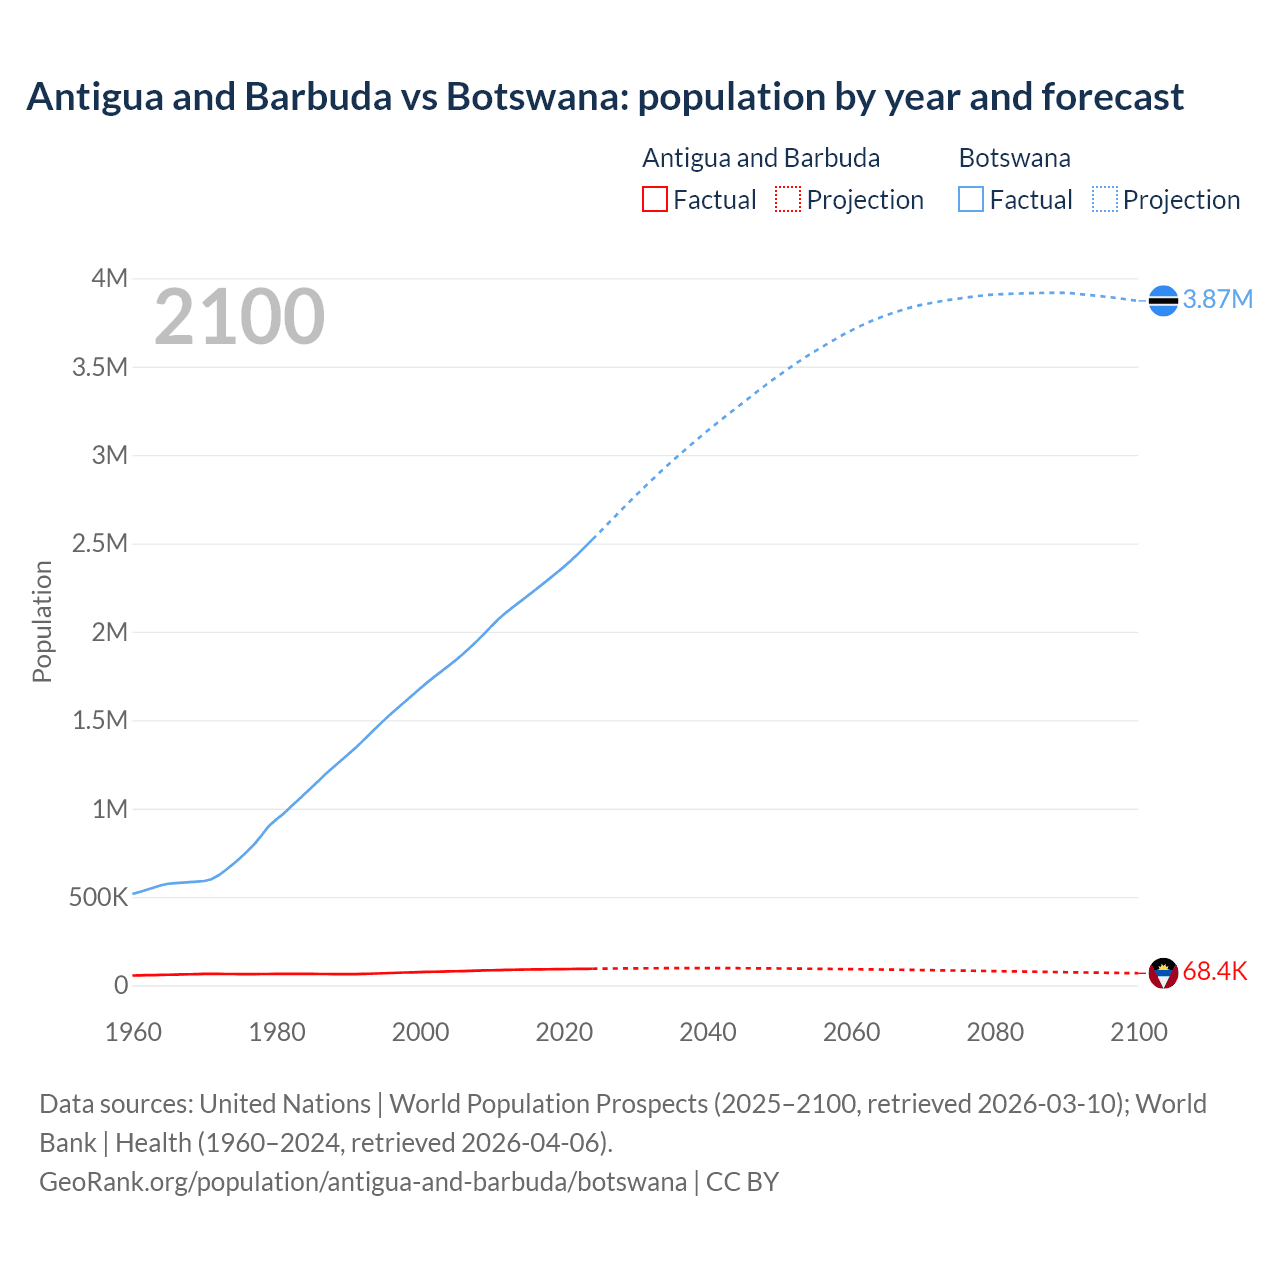
The latest officially reported population of Antigua and Barbuda was 94,209 in 2025 vs 2,562,122 people in Botswana in 2025. In 2026, based on the adjusted UN estimation, the current Antigua and Barbuda's population is 94,846 people compared to 2,624,853 in Botswana.
Population statistics:
- Botswana's population is 27.7 times bigger than Antigua and Barbuda's.
- Antigua and Barbuda is ranked the 185th most populous country in the world, while Botswana is the 142nd.
- The countries together account for 0.03% of the world: 0.001% for Antigua and Barbuda vs 0.03% for Botswana.
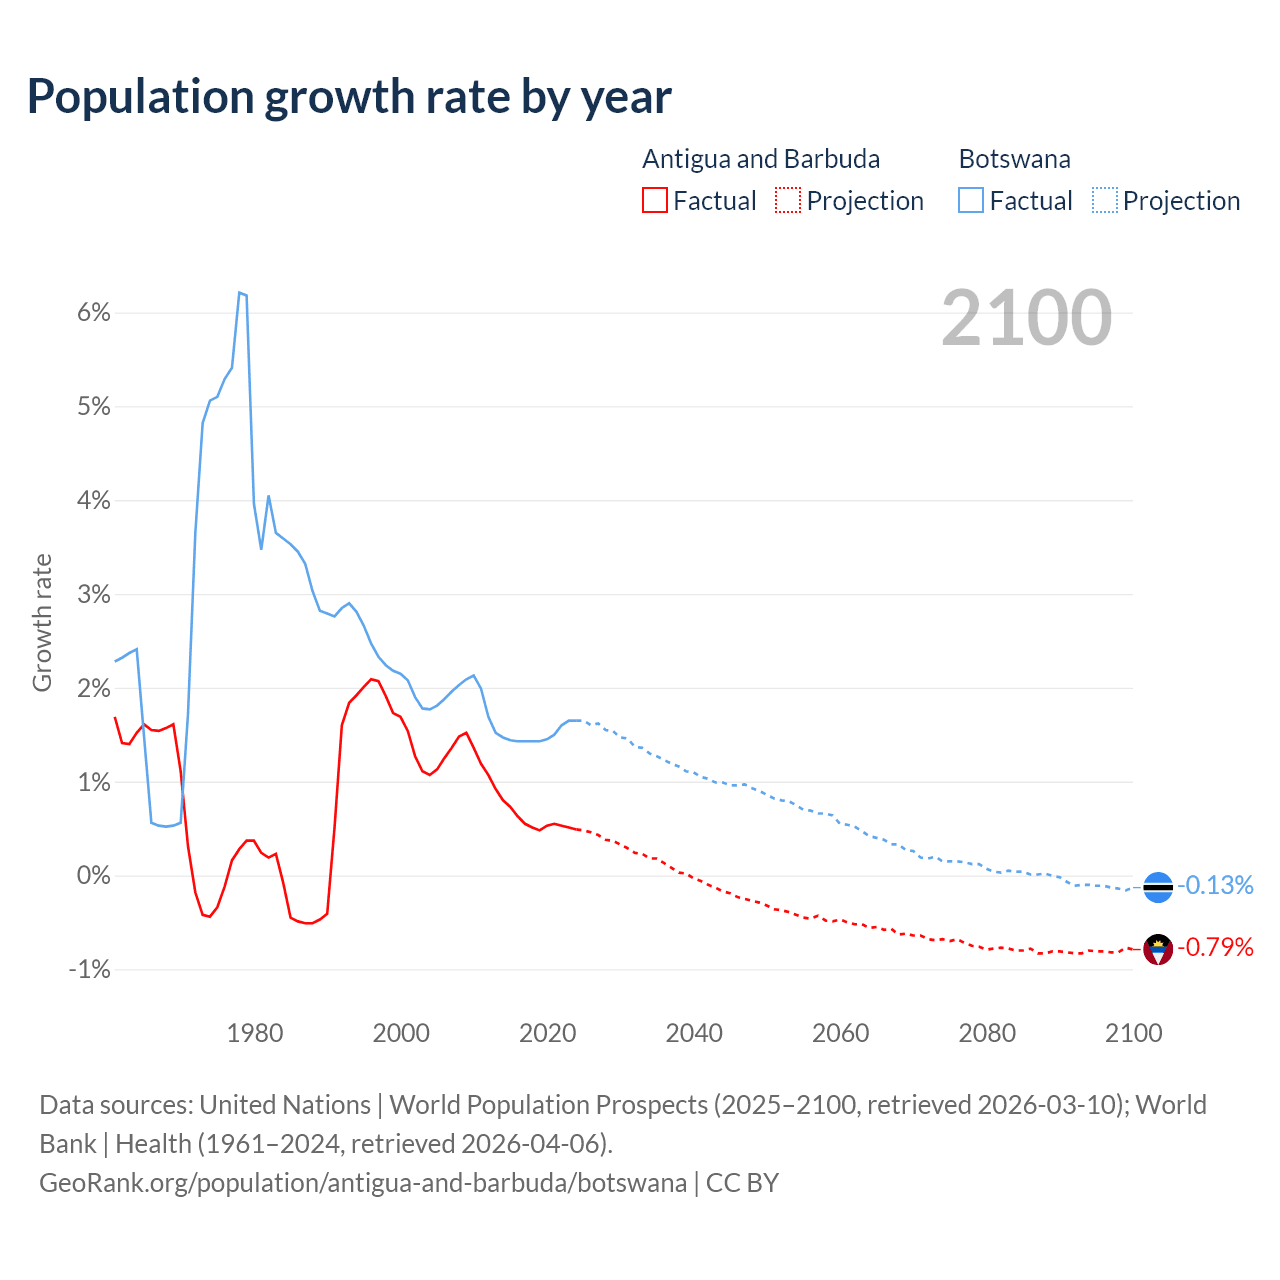
- For the last 10 years, Antigua and Barbuda has had an average growth rate of +0.54% per year vs +1.51% in Botswana.
- Since 2006, the population of Antigua and Barbuda has increased from 80.6K people to 94.8K (17.7% growth), while Botswana has grown from 1.87M to 2.62M (40% growth).
Antigua and Barbuda vs Botswana: population by year and forecast
| Year | Population | |
|---|---|---|
 Antigua
|
 Botswana
|
|
| 2100 | 68,399 | 3,870,704 |
| 2099 | 68,946 | 3,875,823 |
| 2098 | 69,484 | 3,881,867 |
| 2097 | 70,056 | 3,887,181 |
| 2096 | 70,633 | 3,892,081 |
| 2095 | 71,213 | 3,896,405 |
| 2094 | 71,797 | 3,900,671 |
| 2093 | 72,379 | 3,904,733 |
| 2092 | 72,986 | 3,908,682 |
| 2091 | 73,599 | 3,913,090 |
| 2090 | 74,207 | 3,915,896 |
| 2089 | 74,815 | 3,916,540 |
| 2088 | 75,423 | 3,916,700 |
| 2087 | 76,055 | 3,916,016 |
| 2086 | 76,694 | 3,915,493 |
| 2085 | 77,294 | 3,914,975 |
| 2084 | 77,917 | 3,913,555 |
| 2083 | 78,549 | 3,912,119 |
| 2082 | 79,170 | 3,910,185 |
| 2081 | 79,784 | 3,909,204 |
| 2080 | 80,407 | 3,907,447 |
| 2079 | 81,046 | 3,904,550 |
| 2078 | 81,665 | 3,900,021 |
| 2077 | 82,285 | 3,895,321 |
| 2076 | 82,882 | 3,889,723 |
| 2075 | 83,449 | 3,883,893 |
| 2074 | 84,039 | 3,878,255 |
| 2073 | 84,615 | 3,872,458 |
| 2072 | 85,204 | 3,864,865 |
| 2071 | 85,786 | 3,857,922 |
| 2070 | 86,336 | 3,850,437 |
| 2069 | 86,893 | 3,840,521 |
| 2068 | 87,436 | 3,830,034 |
| 2067 | 87,986 | 3,817,551 |
| 2066 | 88,493 | 3,804,918 |
| 2065 | 89,014 | 3,790,427 |
| 2064 | 89,504 | 3,775,157 |
| 2063 | 90,006 | 3,759,402 |
| 2062 | 90,473 | 3,741,936 |
| 2061 | 90,947 | 3,722,576 |
| 2060 | 91,407 | 3,702,465 |
| 2059 | 91,838 | 3,682,055 |
| 2058 | 92,292 | 3,658,810 |
| 2057 | 92,733 | 3,634,762 |
| 2056 | 93,129 | 3,611,096 |
| 2055 | 93,556 | 3,586,314 |
| 2054 | 93,978 | 3,561,446 |
| 2053 | 94,377 | 3,535,001 |
| 2052 | 94,751 | 3,507,213 |
| 2051 | 95,102 | 3,479,219 |
| 2050 | 95,442 | 3,450,807 |
| 2049 | 95,753 | 3,421,435 |
| 2048 | 96,032 | 3,391,019 |
| 2047 | 96,291 | 3,359,719 |
| 2046 | 96,530 | 3,327,520 |
| 2045 | 96,749 | 3,295,807 |
| 2044 | 96,935 | 3,264,444 |
| 2043 | 97,102 | 3,232,407 |
| 2042 | 97,225 | 3,200,743 |
| 2041 | 97,326 | 3,168,217 |
| 2040 | 97,385 | 3,135,241 |
| 2039 | 97,412 | 3,101,153 |
| 2038 | 97,395 | 3,067,014 |
| 2037 | 97,368 | 3,031,993 |
| 2036 | 97,294 | 2,996,265 |
| 2035 | 97,164 | 2,959,978 |
| 2034 | 96,989 | 2,922,807 |
| 2033 | 96,816 | 2,885,394 |
| 2032 | 96,591 | 2,846,703 |
| 2031 | 96,356 | 2,808,291 |
| 2030 | 96,082 | 2,767,933 |
| 2029 | 95,764 | 2,727,903 |
| 2028 | 95,408 | 2,686,412 |
| 2027 | 95,044 | 2,645,316 |
| 2026 | 94,638 | 2,603,241 |
| 2025 | 94,209 | 2,562,122 |
| 2024 | 93,772 | 2,521,139 |
| 2023 | 93,316 | 2,480,244 |
| 2022 | 92,840 | 2,439,892 |
| 2021 | 92,349 | 2,401,441 |
| 2020 | 91,846 | 2,365,894 |
| 2019 | 91,364 | 2,332,083 |
| 2018 | 90,926 | 2,299,141 |
| 2017 | 90,468 | 2,266,747 |
| 2016 | 89,969 | 2,234,776 |
| 2015 | 89,409 | 2,203,273 |
| 2014 | 88,765 | 2,172,044 |
| 2013 | 88,064 | 2,140,682 |
| 2012 | 87,260 | 2,108,617 |
| 2011 | 86,332 | 2,073,535 |
| 2010 | 85,320 | 2,033,111 |
| 2009 | 84,173 | 1,990,673 |
| 2008 | 82,912 | 1,949,970 |
| 2007 | 81,704 | 1,911,201 |
| 2006 | 80,604 | 1,874,516 |
| 2005 | 79,611 | 1,839,877 |
| 2004 | 78,719 | 1,807,146 |
| 2003 | 77,884 | 1,775,736 |
| 2002 | 77,032 | 1,744,763 |
| 2001 | 76,069 | 1,712,254 |
| 2000 | 74,912 | 1,677,382 |
| 1999 | 73,666 | 1,641,997 |
| 1998 | 72,412 | 1,606,899 |
| 1997 | 71,053 | 1,571,691 |
| 1996 | 69,612 | 1,535,914 |
| 1995 | 68,189 | 1,498,836 |
| 1994 | 66,843 | 1,460,023 |
| 1993 | 65,587 | 1,420,115 |
| 1992 | 64,404 | 1,380,033 |
| 1991 | 63,387 | 1,341,756 |
| 1990 | 63,066 | 1,305,696 |
| 1989 | 63,325 | 1,270,274 |
| 1988 | 63,623 | 1,235,476 |
| 1987 | 63,946 | 1,199,167 |
| 1986 | 64,276 | 1,160,650 |
| 1985 | 64,591 | 1,121,945 |
| 1984 | 64,882 | 1,083,660 |
| 1983 | 64,934 | 1,046,137 |
| 1982 | 64,785 | 1,009,269 |
| 1981 | 64,665 | 969,996 |
| 1980 | 64,513 | 937,485 |
| 1979 | 64,274 | 901,742 |
| 1978 | 64,038 | 849,239 |
| 1977 | 63,862 | 799,574 |
| 1976 | 63,762 | 758,508 |
| 1975 | 63,839 | 720,380 |
| 1974 | 64,058 | 685,448 |
| 1973 | 64,342 | 652,408 |
| 1972 | 64,615 | 622,407 |
| 1971 | 64,729 | 600,481 |
| 1970 | 64,528 | 590,334 |
| 1969 | 63,819 | 587,066 |
| 1968 | 62,809 | 583,966 |
| 1967 | 61,837 | 580,933 |
| 1966 | 60,900 | 577,866 |
| 1965 | 59,970 | 574,664 |
| 1964 | 59,020 | 566,266 |
| 1963 | 58,138 | 552,966 |
| 1962 | 57,336 | 540,186 |
| 1961 | 56,540 | 527,942 |
| 1960 | 55,603 | 516,165 |
Data sources: United Nations | World Population Prospects (2026–2100, retrieved 2026-07-08); World Bank | Health (1960–2025, retrieved 2026-07-08).
GeoRank.org/population/antigua-and-barbuda/botswana | CC BY 
From 2006 to 2016, the population of Antigua and Barbuda increased by 9,365 people (a 11.6% growth), while Botswana gained 360,260 people (a 19.2% growth).
For the next 10 years, from 2016 to 2026, Antigua and Barbuda gained 4,877 people (a 5.42% growth), while Botswana's population increased by 390,077 people (a 17.5% growth).
Antigua and Barbuda was ranked 185th most populous country in 2006 and is still 185th in 2026. Botswana was ranked 145th in 2006 and ranked 142nd now.
The UN's World Population Prospects forecasts that in 24 years (in 2050) Antigua and Barbuda's population will grow by 0.63% to 95,442 people and will still be ranked 185th. The population of Botswana will increase by 31.5% to 3,450,807 people and rank change from 142nd to 137th.
Antigua and Barbuda is projected to reach its peak in 2039 at 97.4K people compared to the peak of 3.92M people in 2088 for Botswana.
Population growth rate by year
| Year | Growth rate | |
|---|---|---|
|
Antigua
|
Botswana
|
|
| 2100 | -0.79% | -0.13% |
| 2099 | -0.77% | -0.16% |
| 2098 | -0.82% | -0.14% |
| 2097 | -0.82% | -0.13% |
| 2096 | -0.81% | -0.11% |
| 2095 | -0.81% | -0.11% |
| 2094 | -0.8% | -0.1% |
| 2093 | -0.83% | -0.1% |
| 2092 | -0.83% | -0.11% |
| 2091 | -0.82% | -0.07% |
| 2090 | -0.81% | -0.02% |
| 2089 | -0.81% | -0.004% |
| 2088 | -0.83% | 0.02% |
| 2087 | -0.83% | 0.01% |
| 2086 | -0.78% | 0.01% |
| 2085 | -0.8% | 0.04% |
| 2084 | -0.8% | 0.04% |
| 2083 | -0.78% | 0.05% |
| 2082 | -0.77% | 0.03% |
| 2081 | -0.78% | 0.04% |
| 2080 | -0.79% | 0.07% |
| 2079 | -0.76% | 0.12% |
| 2078 | -0.75% | 0.12% |
| 2077 | -0.72% | 0.14% |
| 2076 | -0.68% | 0.15% |
| 2075 | -0.7% | 0.15% |
| 2074 | -0.68% | 0.15% |
| 2073 | -0.69% | 0.2% |
| 2072 | -0.68% | 0.18% |
| 2071 | -0.64% | 0.19% |
| 2070 | -0.64% | 0.26% |
| 2069 | -0.62% | 0.27% |
| 2068 | -0.63% | 0.33% |
| 2067 | -0.57% | 0.33% |
| 2066 | -0.58% | 0.38% |
| 2065 | -0.55% | 0.4% |
| 2064 | -0.56% | 0.42% |
| 2063 | -0.52% | 0.47% |
| 2062 | -0.52% | 0.52% |
| 2061 | -0.5% | 0.54% |
| 2060 | -0.47% | 0.55% |
| 2059 | -0.49% | 0.64% |
| 2058 | -0.48% | 0.66% |
| 2057 | -0.43% | 0.66% |
| 2056 | -0.46% | 0.69% |
| 2055 | -0.45% | 0.7% |
| 2054 | -0.42% | 0.75% |
| 2053 | -0.39% | 0.79% |
| 2052 | -0.37% | 0.8% |
| 2051 | -0.36% | 0.82% |
| 2050 | -0.32% | 0.86% |
| 2049 | -0.29% | 0.9% |
| 2048 | -0.27% | 0.93% |
| 2047 | -0.25% | 0.97% |
| 2046 | -0.23% | 0.96% |
| 2045 | -0.19% | 0.96% |
| 2044 | -0.17% | 0.99% |
| 2043 | -0.13% | 0.99% |
| 2042 | -0.1% | 1.03% |
| 2041 | -0.06% | 1.05% |
| 2040 | -0.03% | 1.1% |
| 2039 | 0.02% | 1.11% |
| 2038 | 0.03% | 1.16% |
| 2037 | 0.08% | 1.19% |
| 2036 | 0.13% | 1.23% |
| 2035 | 0.18% | 1.27% |
| 2034 | 0.18% | 1.3% |
| 2033 | 0.23% | 1.36% |
| 2032 | 0.24% | 1.37% |
| 2031 | 0.29% | 1.46% |
| 2030 | 0.33% | 1.47% |
| 2029 | 0.37% | 1.54% |
| 2028 | 0.38% | 1.55% |
| 2027 | 0.43% | 1.62% |
| 2026 | 0.46% | 1.6% |
| 2025 | 0.47% | 1.63% |
| 2024 | 0.49% | 1.65% |
| 2023 | 0.51% | 1.65% |
| 2022 | 0.53% | 1.6% |
| 2021 | 0.55% | 1.5% |
| 2020 | 0.53% | 1.45% |
| 2019 | 0.48% | 1.43% |
| 2018 | 0.51% | 1.43% |
| 2017 | 0.55% | 1.43% |
| 2016 | 0.63% | 1.43% |
| 2015 | 0.73% | 1.44% |
| 2014 | 0.8% | 1.47% |
| 2013 | 0.92% | 1.52% |
| 2012 | 1.07% | 1.69% |
| 2011 | 1.19% | 1.99% |
| 2010 | 1.36% | 2.13% |
| 2009 | 1.52% | 2.09% |
| 2008 | 1.48% | 2.03% |
| 2007 | 1.36% | 1.96% |
| 2006 | 1.25% | 1.88% |
| 2005 | 1.13% | 1.81% |
| 2004 | 1.07% | 1.77% |
| 2003 | 1.11% | 1.78% |
| 2002 | 1.27% | 1.9% |
| 2001 | 1.54% | 2.08% |
| 2000 | 1.69% | 2.15% |
| 1999 | 1.73% | 2.18% |
| 1998 | 1.91% | 2.24% |
| 1997 | 2.07% | 2.33% |
| 1996 | 2.09% | 2.47% |
| 1995 | 2.01% | 2.66% |
| 1994 | 1.92% | 2.81% |
| 1993 | 1.84% | 2.9% |
| 1992 | 1.6% | 2.85% |
| 1991 | 0.51% | 2.76% |
| 1990 | -0.41% | 2.79% |
| 1989 | -0.47% | 2.82% |
| 1988 | -0.51% | 3.03% |
| 1987 | -0.51% | 3.32% |
| 1986 | -0.49% | 3.45% |
| 1985 | -0.45% | 3.53% |
| 1984 | -0.08% | 3.59% |
| 1983 | 0.23% | 3.65% |
| 1982 | 0.19% | 4.05% |
| 1981 | 0.24% | 3.47% |
| 1980 | 0.37% | 3.96% |
| 1979 | 0.37% | 6.18% |
| 1978 | 0.28% | 6.21% |
| 1977 | 0.16% | 5.41% |
| 1976 | -0.12% | 5.29% |
| 1975 | -0.34% | 5.1% |
| 1974 | -0.44% | 5.06% |
| 1973 | -0.42% | 4.82% |
| 1972 | -0.18% | 3.65% |
| 1971 | 0.31% | 1.72% |
| 1970 | 1.11% | 0.56% |
| 1969 | 1.61% | 0.53% |
| 1968 | 1.57% | 0.52% |
| 1967 | 1.54% | 0.53% |
| 1966 | 1.55% | 0.56% |
| 1965 | 1.61% | 1.48% |
| 1964 | 1.52% | 2.41% |
| 1963 | 1.4% | 2.37% |
| 1962 | 1.41% | 2.32% |
| 1961 | 1.69% | 2.28% |
Data sources: United Nations | World Population Prospects (2026–2100, retrieved 2026-07-08); World Bank | Health (1961–2025, retrieved 2026-07-08).
GeoRank.org/population/antigua-and-barbuda/botswana | CC BY
In 2025, the population of Antigua and Barbuda grew by 0.47%, while Botswana's population grew by 1.63%.
Live population counters
|
Antigua
|
Botswana
|
|
|---|---|---|
| Current population |
94846
|
2624853
|
| Population rank | 185/197 | 142/197 |
| Percent of world population | 0.001% | 0.03% |
| One net population change |
20.1 hours
|
12.9 minutes
|
| One birth every |
7.96 hours
|
8.56 minutes
|
| One death every |
13.3 hours
|
36.3 minutes
|
| Daily growth/decline | +1 | +112 |
| Annual growth/decline | +437 | +40,983 |
| Annual growth/decline rate | +0.47% | +1.63% |
| Population growth rate rank | 133/197 | 65/197 |
| One migration net change every |
1.09 months
|
1.55 hours
|
| Annual migration change | +12 | -5,665 |
| Net migration rank | 76/196 | 120/196 |
| Foreign-born residents | 30,473 | 116,402 |
| Foreign-born residents rank | 164/195 | 126/195 |
| Foreign-born share of population | 32.5% | 4.6% |
| Foreign-born share rank | 16/195 | 96/195 |
Natural population change vs migration
| Year | Population change | |||
|---|---|---|---|---|
|
Antigua
|
Botswana
|
|||
| Natural | Migration | Natural | Migration | |
| 2025 | - | 12 | - | -5,665 |
| 2024 | 442 | 9 | 46,951 | -5,778 |
| 2023 | 462 | 0 | 47,098 | -6,487 |
| 2022 | 486 | 0 | 47,400 | -7,306 |
| 2021 | 492 | 0 | 40,894 | -4,083 |
| 2020 | 512 | 0 | 45,610 | -11,330 |
| 2019 | 461 | 0 | 45,110 | -11,770 |
| 2018 | 411 | 0 | 44,171 | -11,623 |
| 2017 | 504 | 0 | 43,154 | -10,916 |
| 2016 | 496 | 0 | 41,993 | -10,286 |
| 2015 | 583 | 44 | 40,897 | -9,599 |
| 2014 | 564 | 97 | 40,046 | -8,893 |
| 2013 | 586 | 145 | 39,404 | -7,836 |
| 2012 | 678 | 196 | 39,202 | -6,636 |
| 2011 | 743 | 243 | 38,613 | -1,019 |
| 2010 | 758 | 291 | 38,101 | 5,151 |
| 2009 | 900 | 338 | 36,671 | 4,960 |
| 2008 | 911 | 369 | 35,433 | 4,343 |
| 2007 | 770 | 371 | 33,832 | 3,926 |
| 2006 | 742 | 315 | 31,340 | 4,270 |
| 2005 | 738 | 196 | 29,385 | 4,283 |
| 2004 | 757 | 93 | 27,481 | 4,314 |
| 2003 | 793 | 32 | 26,545 | 4,488 |
| 2002 | 843 | 40 | 26,163 | 4,747 |
| 2001 | 900 | 139 | 26,112 | 7,991 |
| 2000 | 1,009 | 263 | 25,850 | 9,798 |
| 1999 | 828 | 386 | 25,358 | 9,762 |
| 1998 | 845 | 456 | 25,397 | 9,685 |
| 1997 | 932 | 489 | 25,738 | 9,597 |
| 1996 | 947 | 505 | 26,847 | 9,368 |
| 1995 | 844 | 555 | 28,478 | 9,464 |
| 1994 | 757 | 535 | 30,664 | 9,023 |
| 1993 | 706 | 507 | 31,691 | 8,441 |
| 1992 | 728 | 424 | 31,995 | 8,026 |
| 1991 | 673 | 225 | 32,219 | 4,311 |
| 1990 | 833 | -1,085 | 33,015 | 2,580 |
| 1989 | 845 | -1,124 | 33,756 | 1,495 |
| 1988 | 848 | -1,168 | 34,564 | -215 |
| 1987 | 845 | -1,174 | 35,647 | 2,624 |
| 1986 | 855 | -1,175 | 36,203 | 2,558 |
| 1985 | 955 | -1,261 | 35,966 | 2,683 |
| 1984 | 899 | -1,182 | 35,530 | 2,393 |
| 1983 | 941 | -761 | 35,142 | 1,980 |
| 1982 | 913 | -798 | 34,859 | 1,751 |
| 1981 | 940 | -810 | 34,327 | 7,610 |
| 1980 | 1,002 | -824 | 33,934 | -10,849 |
| 1979 | 1,150 | -854 | 32,486 | 15,918 |
| 1978 | 1,064 | -889 | 30,596 | 26,015 |
| 1977 | 1,124 | -942 | 29,009 | 13,708 |
| 1976 | 1,075 | -1,058 | 27,497 | 11,914 |
| 1975 | 1,028 | -1,203 | 25,762 | 11,086 |
| 1974 | 1,074 | -1,335 | 24,160 | 8,854 |
| 1973 | 1,135 | -1,436 | 22,449 | 10,615 |
| 1972 | 1,179 | -1,428 | 21,004 | 5,937 |
| 1971 | 1,219 | -1,203 | 19,926 | -3,016 |
| 1970 | 1,248 | -861 | 19,438 | -16,054 |
| 1969 | 1,308 | -271 | 19,024 | -15,870 |
| 1968 | 1,369 | -382 | 18,725 | -15,681 |
| 1967 | 1,431 | -481 | 18,463 | -15,438 |
| 1966 | 1,489 | -563 | 18,250 | -15,140 |
| 1965 | 1,528 | -601 | 18,045 | -14,753 |
| 1964 | 1,559 | -590 | 17,634 | -4,126 |
| 1963 | 1,543 | -738 | 17,084 | -4,000 |
| 1962 | 1,509 | -712 | 16,507 | -4,028 |
| 1961 | 1,476 | -685 | 16,185 | -4,168 |
| 1960 | 1,434 | -351 | 15,861 | -4,331 |
Data sources: World Bank | Health (1960–2025, retrieved 2026-07-08).
GeoRank.org/population/antigua-and-barbuda/botswana | CC BY
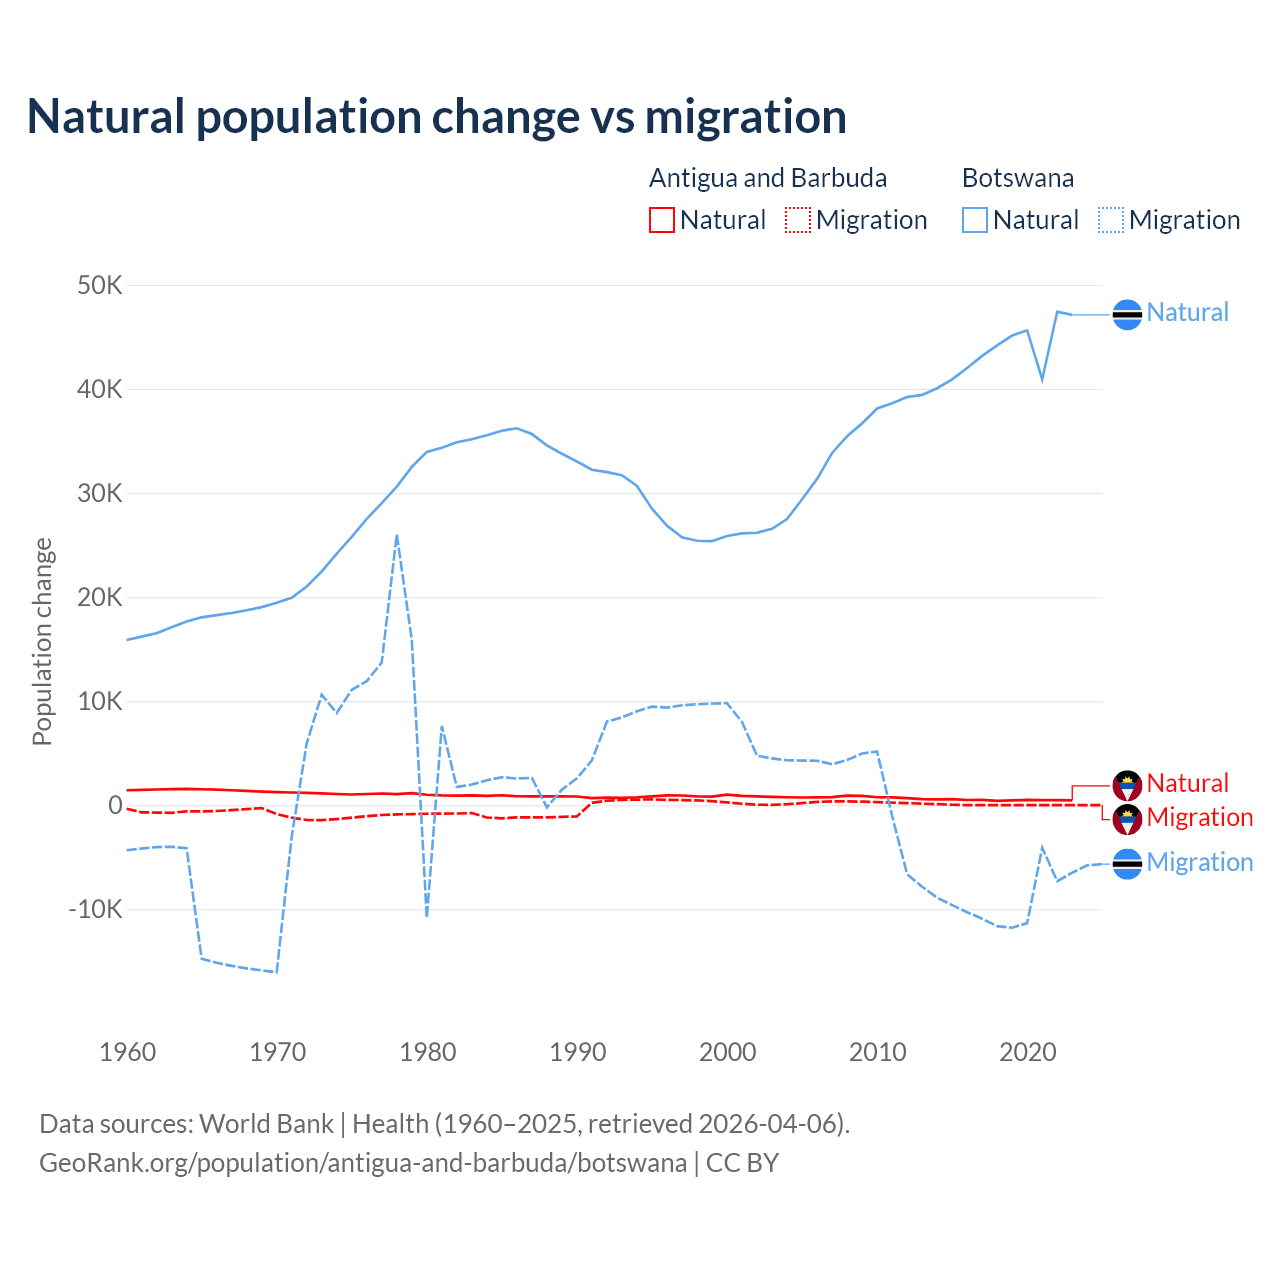
Over the last 10 years, 98.9% of the population change in Antigua and Barbuda is from natural causes (a gain of 4,849 people) and 1.08% is from migration (a gain of 53 people). In Botswana 83.3% is from natural causes (a gain of 443,278 people) and 16.7% is from migration (a loss of 89,178 people).
As of 2024, 30,473 residents or 32.5% of the population were not native-born in Antigua and Barbuda, compared to 116,402 people or 4.6% in Botswana.
Biggest cities by population
Compare countries by 7 more topics
Population differences between Antigua and Barbuda and Botswana
|
Antigua
|
Botswana
|
|
|---|---|---|
| Life expectancy | 78.1 years | 69.6 years |
| Average age | 38.1 years | 26.9 years |
| Median age | 37.3 years | 24.5 years |
| Male:Female ratio | 47.6:52.4 | 49.8:50.2 |
| Fertility rate | 1.58 births per woman | 2.7 births per woman |
| Population density | 557 ppl/mi² | 11.9 ppl/mi² |
Population map with other countries
Data sources: World Bank | Health (1960–2025, retrieved 2026-07-08); United Nations | World Population Prospects (1960–2026, retrieved 2026-07-08); U.S. Census Bureau (1960–2025, retrieved 2026-07-08); Central Intelligence Agency (CIA) (2000–2019, retrieved 2026-07-08).
GeoRank.org/population/antigua-and-barbuda/botswana | CC BY
Help us show the world through your eyes
Share a photo of your city and help others discover what it looks like to live there. Your contribution makes our data come alive.
Data sources:
- World Bank | Health (1960–2025, retrieved 2026-07-08)
- United Nations | World Population Prospects (1960–2100, retrieved 2026-07-08)
- U.S. Census Bureau (1960–2025, retrieved 2026-07-08)
- Central Intelligence Agency (CIA) (2000–2019, retrieved 2026-07-08)
- Wikidata (2026, retrieved 2026-07-08)
Creative Commons Attribution (CC BY) — you’re free to copy, share, remix, adapt, and use even commercially as long as you give appropriate credit and clearly indicate if you made changes. Other sources may be subject to different license terms.