The latest officially reported population of Israel was 10,122,800 in 2025 vs 10,804,871 people in Portugal in 2025. In 2026, based on the adjusted UN estimation, the current Israel's population is 10,334,048 people compared to 10,788,071 in Portugal.
Population statistics:
- Portugal's population is 1.04 times bigger than Israel's.
- Israel is ranked the 95th most populous country in the world, while Portugal is the 91st.
- The countries together account for 0.25% of the world: 0.12% for Israel vs 0.13% for Portugal.
- For the last 10 years, Israel has had an average growth rate of +1.92% per year vs +0.35% in Portugal.
- Since 2006, the population of Israel has increased from 7.05M people to 10.3M (46.5% growth), while Portugal has grown from 10.5M to 10.8M (2.53% growth).
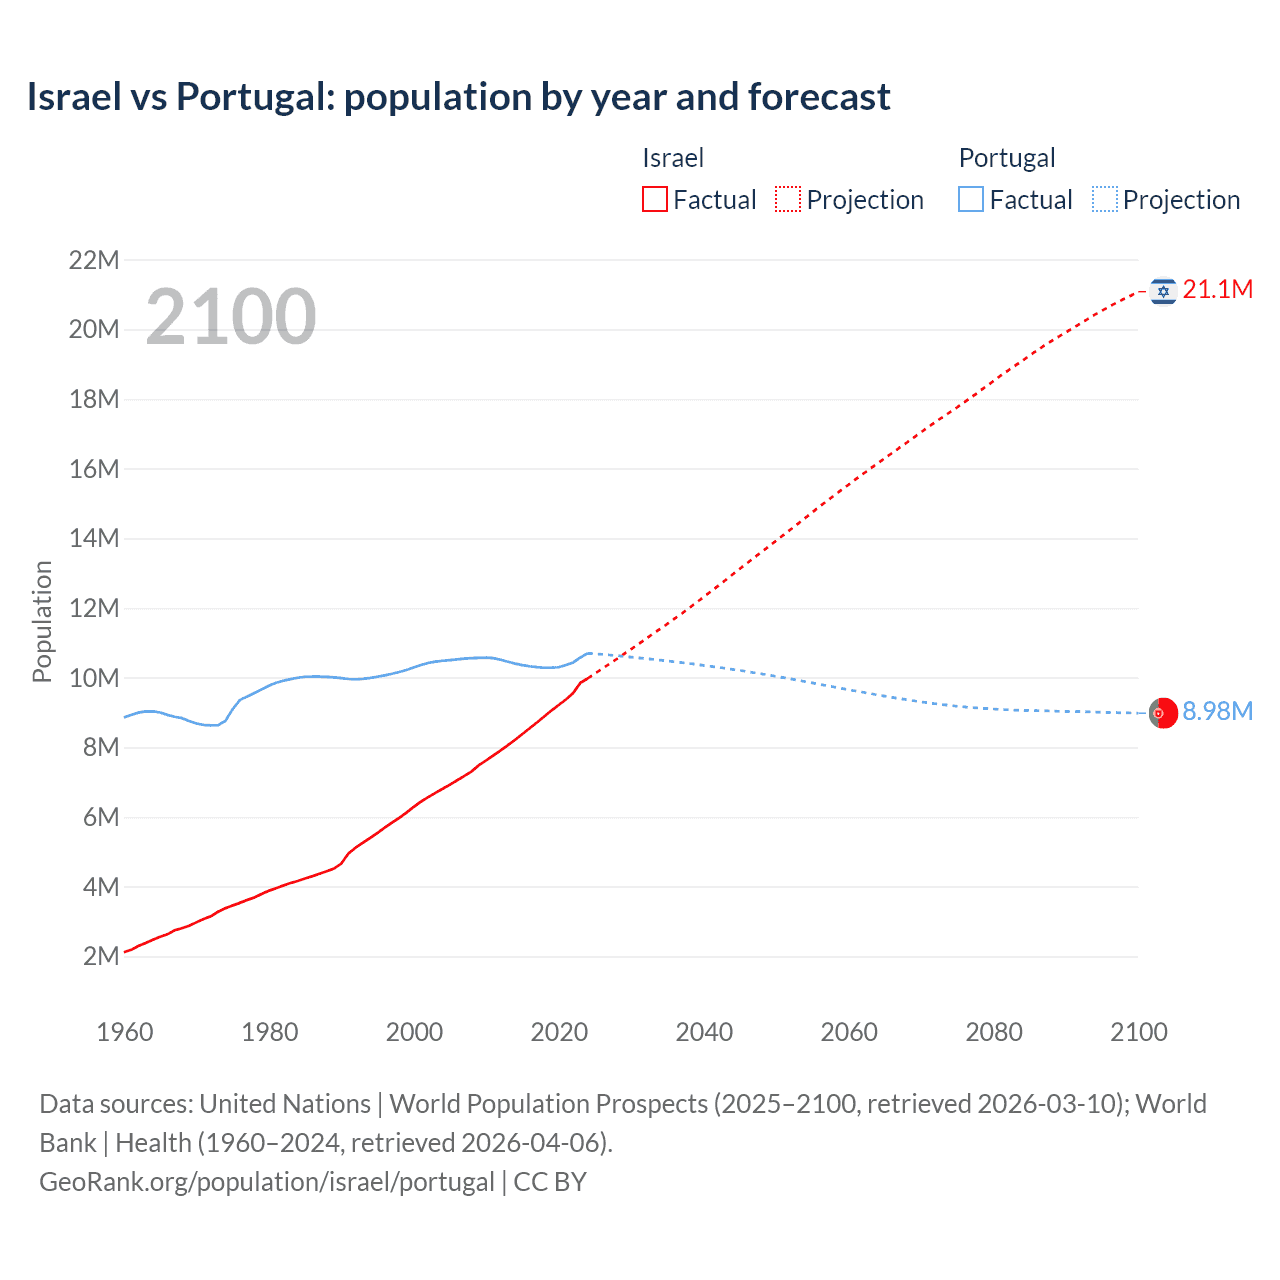
Israel vs Portugal: population by year and forecast
| Year | Population | |
|---|---|---|
 Israel
|
 Portugal
|
|
| 2100 | 21,097,502 | 9,079,610 |
| 2099 | 20,990,284 | 9,084,930 |
| 2098 | 20,887,475 | 9,089,064 |
| 2097 | 20,782,833 | 9,094,546 |
| 2096 | 20,669,152 | 9,100,755 |
| 2095 | 20,555,388 | 9,108,548 |
| 2094 | 20,438,144 | 9,113,366 |
| 2093 | 20,311,860 | 9,118,286 |
| 2092 | 20,184,747 | 9,123,579 |
| 2091 | 20,056,099 | 9,127,714 |
| 2090 | 19,927,570 | 9,132,140 |
| 2089 | 19,805,919 | 9,136,870 |
| 2088 | 19,677,585 | 9,141,647 |
| 2087 | 19,544,709 | 9,147,996 |
| 2086 | 19,405,618 | 9,152,804 |
| 2085 | 19,263,765 | 9,158,263 |
| 2084 | 19,116,247 | 9,165,158 |
| 2083 | 18,972,113 | 9,171,574 |
| 2082 | 18,829,949 | 9,179,958 |
| 2081 | 18,683,725 | 9,190,466 |
| 2080 | 18,528,692 | 9,201,621 |
| 2079 | 18,378,150 | 9,214,398 |
| 2078 | 18,224,680 | 9,228,555 |
| 2077 | 18,069,594 | 9,243,708 |
| 2076 | 17,924,206 | 9,262,542 |
| 2075 | 17,777,444 | 9,282,392 |
| 2074 | 17,633,695 | 9,305,608 |
| 2073 | 17,493,191 | 9,330,117 |
| 2072 | 17,358,424 | 9,353,771 |
| 2071 | 17,210,625 | 9,380,991 |
| 2070 | 17,058,151 | 9,409,668 |
| 2069 | 16,905,322 | 9,440,299 |
| 2068 | 16,757,005 | 9,473,457 |
| 2067 | 16,608,158 | 9,506,001 |
| 2066 | 16,462,419 | 9,539,597 |
| 2065 | 16,311,857 | 9,574,237 |
| 2064 | 16,166,704 | 9,611,738 |
| 2063 | 16,011,267 | 9,649,045 |
| 2062 | 15,861,432 | 9,686,737 |
| 2061 | 15,709,716 | 9,723,601 |
| 2060 | 15,550,635 | 9,762,379 |
| 2059 | 15,396,992 | 9,801,072 |
| 2058 | 15,241,182 | 9,841,936 |
| 2057 | 15,082,914 | 9,880,092 |
| 2056 | 14,923,704 | 9,918,643 |
| 2055 | 14,759,501 | 9,958,971 |
| 2054 | 14,591,126 | 9,997,570 |
| 2053 | 14,427,517 | 10,037,385 |
| 2052 | 14,264,766 | 10,076,095 |
| 2051 | 14,103,277 | 10,112,788 |
| 2050 | 13,939,856 | 10,149,626 |
| 2049 | 13,777,240 | 10,187,172 |
| 2048 | 13,618,660 | 10,221,034 |
| 2047 | 13,460,094 | 10,255,340 |
| 2046 | 13,297,752 | 10,289,266 |
| 2045 | 13,137,551 | 10,321,807 |
| 2044 | 12,971,541 | 10,353,338 |
| 2043 | 12,807,746 | 10,384,554 |
| 2042 | 12,643,252 | 10,412,950 |
| 2041 | 12,482,422 | 10,440,054 |
| 2040 | 12,323,788 | 10,469,380 |
| 2039 | 12,163,569 | 10,497,556 |
| 2038 | 12,006,362 | 10,523,869 |
| 2037 | 11,851,428 | 10,548,445 |
| 2036 | 11,703,716 | 10,573,361 |
| 2035 | 11,553,156 | 10,597,352 |
| 2034 | 11,406,594 | 10,621,955 |
| 2033 | 11,262,204 | 10,645,024 |
| 2032 | 11,118,498 | 10,668,384 |
| 2031 | 10,970,655 | 10,689,372 |
| 2030 | 10,825,091 | 10,708,819 |
| 2029 | 10,684,612 | 10,729,893 |
| 2028 | 10,542,941 | 10,752,023 |
| 2027 | 10,402,334 | 10,770,712 |
| 2026 | 10,261,927 | 10,788,071 |
| 2025 | 10,122,800 | 10,804,871 |
| 2024 | 10,002,200 | 10,694,681 |
| 2023 | 9,849,000 | 10,578,174 |
| 2022 | 9,557,500 | 10,434,332 |
| 2021 | 9,371,400 | 10,361,831 |
| 2020 | 9,215,100 | 10,297,081 |
| 2019 | 9,054,000 | 10,286,263 |
| 2018 | 8,882,800 | 10,283,822 |
| 2017 | 8,713,300 | 10,300,300 |
| 2016 | 8,546,000 | 10,325,452 |
| 2015 | 8,380,100 | 10,358,076 |
| 2014 | 8,215,700 | 10,401,062 |
| 2013 | 8,059,500 | 10,457,295 |
| 2012 | 7,910,500 | 10,514,844 |
| 2011 | 7,765,800 | 10,557,560 |
| 2010 | 7,623,600 | 10,573,100 |
| 2009 | 7,485,600 | 10,568,247 |
| 2008 | 7,308,800 | 10,558,177 |
| 2007 | 7,180,100 | 10,542,964 |
| 2006 | 7,053,700 | 10,522,288 |
| 2005 | 6,930,100 | 10,503,330 |
| 2004 | 6,809,000 | 10,483,861 |
| 2003 | 6,689,700 | 10,458,821 |
| 2002 | 6,570,000 | 10,419,631 |
| 2001 | 6,439,000 | 10,362,722 |
| 2000 | 6,289,000 | 10,289,898 |
| 1999 | 6,125,000 | 10,217,828 |
| 1998 | 5,971,000 | 10,160,196 |
| 1997 | 5,836,000 | 10,108,977 |
| 1996 | 5,692,000 | 10,063,945 |
| 1995 | 5,545,000 | 10,026,176 |
| 1994 | 5,399,000 | 9,991,525 |
| 1993 | 5,261,000 | 9,964,675 |
| 1992 | 5,123,000 | 9,952,494 |
| 1991 | 4,949,000 | 9,960,235 |
| 1990 | 4,660,000 | 9,983,218 |
| 1989 | 4,518,000 | 10,005,000 |
| 1988 | 4,442,000 | 10,019,610 |
| 1987 | 4,369,000 | 10,030,031 |
| 1986 | 4,299,000 | 10,032,734 |
| 1985 | 4,233,000 | 10,023,613 |
| 1984 | 4,159,000 | 9,996,232 |
| 1983 | 4,105,000 | 9,957,865 |
| 1982 | 4,031,000 | 9,911,771 |
| 1981 | 3,956,000 | 9,851,362 |
| 1980 | 3,878,000 | 9,766,312 |
| 1979 | 3,786,000 | 9,661,265 |
| 1978 | 3,690,000 | 9,558,250 |
| 1977 | 3,613,000 | 9,455,675 |
| 1976 | 3,533,000 | 9,355,810 |
| 1975 | 3,455,000 | 9,093,470 |
| 1974 | 3,377,000 | 8,754,365 |
| 1973 | 3,278,000 | 8,633,100 |
| 1972 | 3,148,000 | 8,630,430 |
| 1971 | 3,069,000 | 8,643,756 |
| 1970 | 2,974,000 | 8,680,431 |
| 1969 | 2,877,000 | 8,757,705 |
| 1968 | 2,803,000 | 8,836,650 |
| 1967 | 2,745,000 | 8,874,520 |
| 1966 | 2,629,000 | 8,930,990 |
| 1965 | 2,563,000 | 8,998,595 |
| 1964 | 2,475,000 | 9,035,365 |
| 1963 | 2,379,000 | 9,030,355 |
| 1962 | 2,293,000 | 8,993,985 |
| 1961 | 2,185,000 | 8,929,316 |
| 1960 | 2,114,020 | 8,857,716 |
Data sources: United Nations | World Population Prospects (2026–2100, retrieved 2026-07-08); World Bank | Health (1960–2025, retrieved 2026-07-08).
GeoRank.org/population/israel/portugal | CC BY 
From 2006 to 2016, the population of Israel increased by 1,492,300 people (a 21.2% growth), while Portugal lost 196,836 people (a 1.87% decline).
For the next 10 years, from 2016 to 2026, Israel gained 1,788,048 people (a 20.9% growth), while Portugal's population increased by 462,619 people (a 4.48% growth).
Israel was ranked 99th most populous country in 2006 and is 95th in 2026. Portugal was ranked 78th in 2006 and ranked 91st now.
The UN's World Population Prospects forecasts that in 24 years (in 2050) Israel's population will grow by 34.9% to 13,939,856 people with a rank change from 95th to 87th. The population of Portugal will decrease by 5.92% to 10,149,626 people and rank change from 91st to 97th.
Israel is projected to reach its peak in 2100 at 21.1M people, while Portugal's population already peaked in 2025 at 10.8M people and is projected to decrease to 9.08M people by 2100.
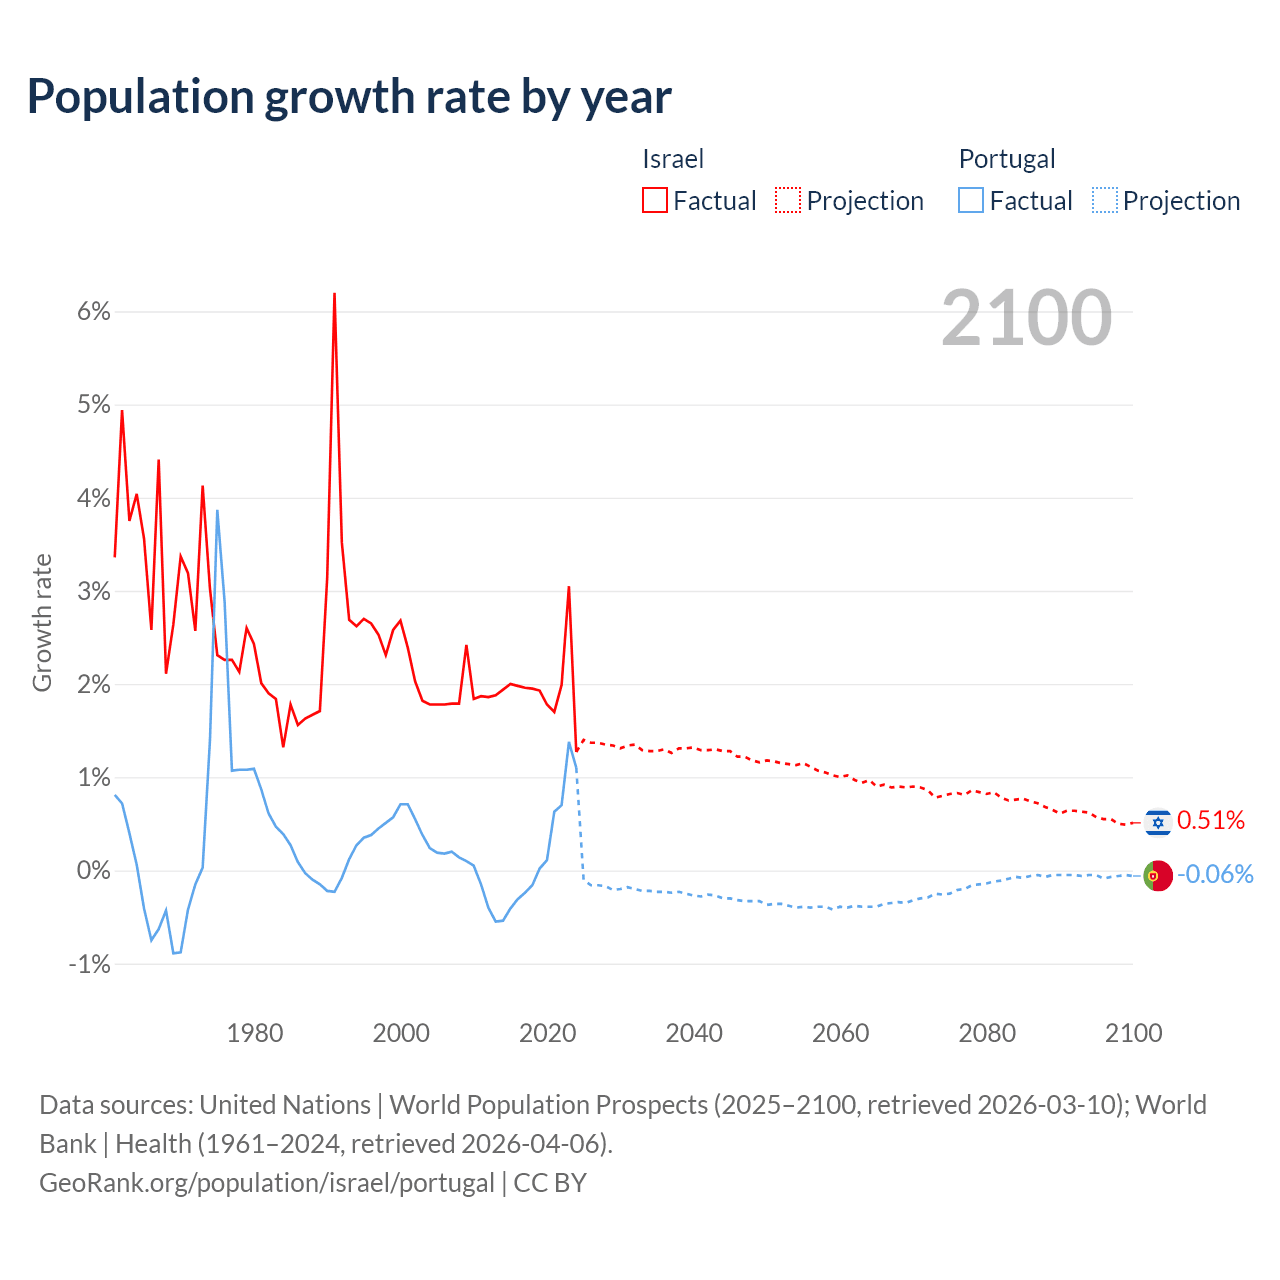
Population growth rate by year
| Year | Growth rate | |
|---|---|---|
|
Israel
|
Portugal
|
|
| 2100 | 0.51% | -0.06% |
| 2099 | 0.49% | -0.05% |
| 2098 | 0.5% | -0.06% |
| 2097 | 0.55% | -0.07% |
| 2096 | 0.55% | -0.09% |
| 2095 | 0.57% | -0.05% |
| 2094 | 0.62% | -0.05% |
| 2093 | 0.63% | -0.06% |
| 2092 | 0.64% | -0.05% |
| 2091 | 0.64% | -0.05% |
| 2090 | 0.61% | -0.05% |
| 2089 | 0.65% | -0.05% |
| 2088 | 0.68% | -0.07% |
| 2087 | 0.72% | -0.05% |
| 2086 | 0.74% | -0.06% |
| 2085 | 0.77% | -0.08% |
| 2084 | 0.76% | -0.07% |
| 2083 | 0.75% | -0.09% |
| 2082 | 0.78% | -0.11% |
| 2081 | 0.84% | -0.12% |
| 2080 | 0.82% | -0.14% |
| 2079 | 0.84% | -0.15% |
| 2078 | 0.86% | -0.16% |
| 2077 | 0.81% | -0.2% |
| 2076 | 0.83% | -0.21% |
| 2075 | 0.82% | -0.25% |
| 2074 | 0.8% | -0.26% |
| 2073 | 0.78% | -0.25% |
| 2072 | 0.86% | -0.29% |
| 2071 | 0.89% | -0.3% |
| 2070 | 0.9% | -0.32% |
| 2069 | 0.89% | -0.35% |
| 2068 | 0.9% | -0.34% |
| 2067 | 0.89% | -0.35% |
| 2066 | 0.92% | -0.36% |
| 2065 | 0.9% | -0.39% |
| 2064 | 0.97% | -0.39% |
| 2063 | 0.94% | -0.39% |
| 2062 | 0.97% | -0.38% |
| 2061 | 1.02% | -0.4% |
| 2060 | 1% | -0.39% |
| 2059 | 1.02% | -0.42% |
| 2058 | 1.05% | -0.39% |
| 2057 | 1.07% | -0.39% |
| 2056 | 1.11% | -0.4% |
| 2055 | 1.15% | -0.39% |
| 2054 | 1.13% | -0.4% |
| 2053 | 1.14% | -0.38% |
| 2052 | 1.15% | -0.36% |
| 2051 | 1.17% | -0.36% |
| 2050 | 1.18% | -0.37% |
| 2049 | 1.16% | -0.33% |
| 2048 | 1.18% | -0.33% |
| 2047 | 1.22% | -0.33% |
| 2046 | 1.22% | -0.32% |
| 2045 | 1.28% | -0.3% |
| 2044 | 1.28% | -0.3% |
| 2043 | 1.3% | -0.27% |
| 2042 | 1.29% | -0.26% |
| 2041 | 1.29% | -0.28% |
| 2040 | 1.32% | -0.27% |
| 2039 | 1.31% | -0.25% |
| 2038 | 1.31% | -0.23% |
| 2037 | 1.26% | -0.24% |
| 2036 | 1.3% | -0.23% |
| 2035 | 1.28% | -0.23% |
| 2034 | 1.28% | -0.22% |
| 2033 | 1.29% | -0.22% |
| 2032 | 1.35% | -0.2% |
| 2031 | 1.34% | -0.18% |
| 2030 | 1.31% | -0.2% |
| 2029 | 1.34% | -0.21% |
| 2028 | 1.35% | -0.17% |
| 2027 | 1.37% | -0.16% |
| 2026 | 1.37% | -0.16% |
| 2025 | 1.21% | 1.03% |
| 2024 | 1.56% | 1.1% |
| 2023 | 3.05% | 1.38% |
| 2022 | 1.99% | 0.7% |
| 2021 | 1.7% | 0.63% |
| 2020 | 1.78% | 0.11% |
| 2019 | 1.93% | 0.02% |
| 2018 | 1.95% | -0.16% |
| 2017 | 1.96% | -0.24% |
| 2016 | 1.98% | -0.31% |
| 2015 | 2% | -0.41% |
| 2014 | 1.94% | -0.54% |
| 2013 | 1.88% | -0.55% |
| 2012 | 1.86% | -0.4% |
| 2011 | 1.87% | -0.15% |
| 2010 | 1.84% | 0.05% |
| 2009 | 2.42% | 0.1% |
| 2008 | 1.79% | 0.14% |
| 2007 | 1.79% | 0.2% |
| 2006 | 1.78% | 0.18% |
| 2005 | 1.78% | 0.19% |
| 2004 | 1.78% | 0.24% |
| 2003 | 1.82% | 0.38% |
| 2002 | 2.03% | 0.55% |
| 2001 | 2.39% | 0.71% |
| 2000 | 2.68% | 0.71% |
| 1999 | 2.58% | 0.57% |
| 1998 | 2.31% | 0.51% |
| 1997 | 2.53% | 0.45% |
| 1996 | 2.65% | 0.38% |
| 1995 | 2.7% | 0.35% |
| 1994 | 2.62% | 0.27% |
| 1993 | 2.69% | 0.12% |
| 1992 | 3.52% | -0.08% |
| 1991 | 6.2% | -0.23% |
| 1990 | 3.14% | -0.22% |
| 1989 | 1.71% | -0.15% |
| 1988 | 1.67% | -0.1% |
| 1987 | 1.63% | -0.03% |
| 1986 | 1.56% | 0.09% |
| 1985 | 1.78% | 0.27% |
| 1984 | 1.32% | 0.39% |
| 1983 | 1.84% | 0.47% |
| 1982 | 1.9% | 0.61% |
| 1981 | 2.01% | 0.87% |
| 1980 | 2.43% | 1.09% |
| 1979 | 2.6% | 1.08% |
| 1978 | 2.13% | 1.08% |
| 1977 | 2.26% | 1.07% |
| 1976 | 2.26% | 2.88% |
| 1975 | 2.31% | 3.87% |
| 1974 | 3.02% | 1.4% |
| 1973 | 4.13% | 0.03% |
| 1972 | 2.57% | -0.15% |
| 1971 | 3.19% | -0.42% |
| 1970 | 3.37% | -0.88% |
| 1969 | 2.64% | -0.89% |
| 1968 | 2.11% | -0.43% |
| 1967 | 4.41% | -0.63% |
| 1966 | 2.58% | -0.75% |
| 1965 | 3.56% | -0.41% |
| 1964 | 4.04% | 0.06% |
| 1963 | 3.75% | 0.4% |
| 1962 | 4.94% | 0.72% |
| 1961 | 3.36% | 0.81% |
Data sources: United Nations | World Population Prospects (2026–2100, retrieved 2026-07-08); World Bank | Health (1961–2025, retrieved 2026-07-08).
GeoRank.org/population/israel/portugal | CC BY
In 2025, the population of Israel grew by 1.21%, while Portugal's population grew by 1.03%.
Live population counters
|
Israel
|
Portugal
|
|
|---|---|---|
| Current population |
10334048
|
10788071
|
| Population rank | 95/197 | 91/197 |
| Percent of world population | 0.12% | 0.13% |
| One net population change |
4.37 minutes
|
4.78 minutes
|
| One birth every |
2.83 minutes
|
6.22 minutes
|
| One death every |
9.91 minutes
|
4.43 minutes
|
| Daily growth/decline | +330 | +302 |
| Annual growth/decline | +120,600 | +110,190 |
| Annual growth/decline rate | +1.21% | +1.03% |
| Population growth rate rank | 87/197 | 99/197 |
| One migration net change every |
46 minutes
|
32 minutes
|
| Annual migration change | +11,466 | +16,472 |
| Net migration rank | 42/196 | 38/196 |
| Foreign-born residents | 2,091,569 | 1,127,184 |
| Foreign-born residents rank | 35/195 | 56/195 |
| Foreign-born share of population | 22.3% | 10.8% |
| Foreign-born share rank | 26/195 | 61/195 |
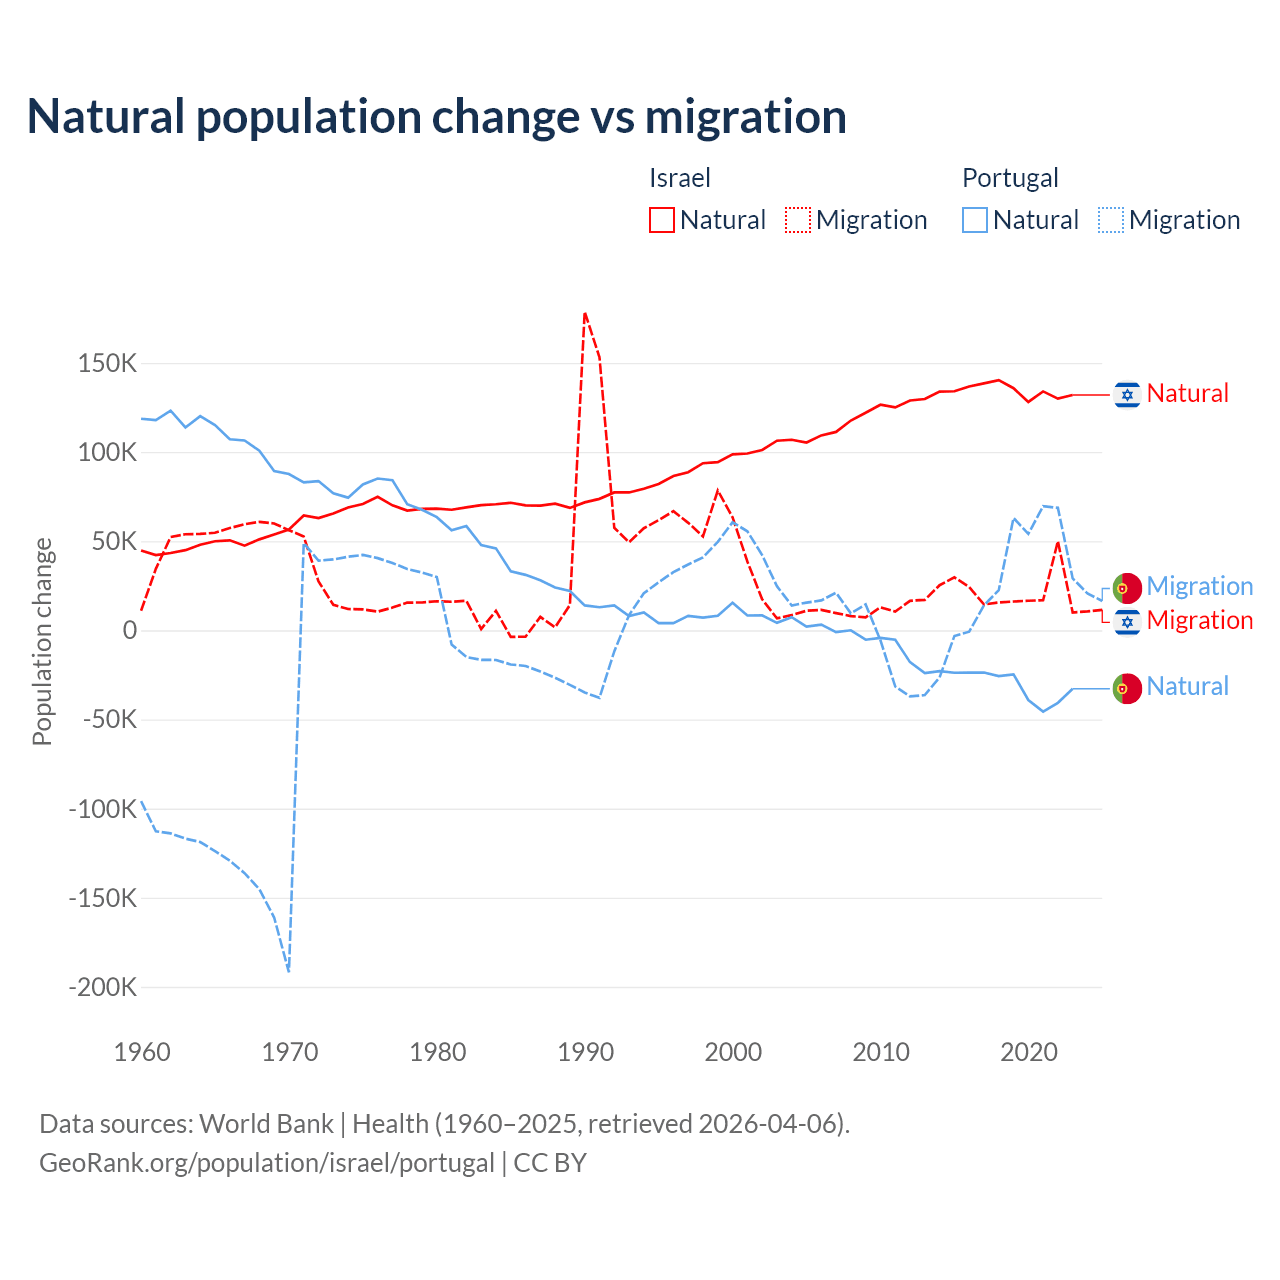
Natural population change vs migration
| Year | Population change | |||
|---|---|---|---|---|
|
Israel
|
Portugal
|
|||
| Natural | Migration | Natural | Migration | |
| 2025 | - | 11,466 | - | 16,472 |
| 2024 | 133,029 | 10,612 | -34,223 | 20,648 |
| 2023 | 131,977 | 9,999 | -32,792 | 29,102 |
| 2022 | 129,982 | 50,004 | -40,694 | 68,696 |
| 2021 | 134,011 | 16,859 | -45,592 | 69,606 |
| 2020 | 128,089 | 16,573 | -39,129 | 54,076 |
| 2019 | 135,810 | 16,134 | -24,687 | 63,031 |
| 2018 | 140,348 | 15,615 | -25,709 | 22,495 |
| 2017 | 138,541 | 14,518 | -23,691 | 13,979 |
| 2016 | 136,736 | 24,308 | -23,749 | -775 |
| 2015 | 134,082 | 29,735 | -23,823 | -3,209 |
| 2014 | 133,916 | 25,303 | -22,882 | -26,447 |
| 2013 | 129,758 | 17,075 | -24,052 | -36,342 |
| 2012 | 128,941 | 16,549 | -17,875 | -37,083 |
| 2011 | 125,030 | 10,470 | -5,279 | -31,513 |
| 2010 | 126,552 | 12,906 | -4,230 | -5,627 |
| 2009 | 122,015 | 7,269 | -5,284 | 14,532 |
| 2008 | 117,672 | 7,974 | 0 | 9,478 |
| 2007 | 111,292 | 9,654 | -1,055 | 21,064 |
| 2006 | 109,332 | 11,446 | 3,156 | 16,754 |
| 2005 | 105,338 | 10,975 | 2,101 | 15,537 |
| 2004 | 106,901 | 8,494 | 7,339 | 13,928 |
| 2003 | 106,366 | 6,684 | 4,184 | 24,740 |
| 2002 | 101,178 | 17,420 | 8,335 | 42,169 |
| 2001 | 99,160 | 38,643 | 8,290 | 55,565 |
| 2000 | 98,737 | 63,409 | 15,435 | 60,586 |
| 1999 | 94,325 | 78,422 | 8,175 | 49,572 |
| 1998 | 93,744 | 52,713 | 7,112 | 40,931 |
| 1997 | 88,707 | 60,297 | 8,087 | 36,922 |
| 1996 | 86,518 | 66,811 | 4,026 | 32,640 |
| 1995 | 82,066 | 61,800 | 4,011 | 26,971 |
| 1994 | 79,365 | 57,273 | 9,991 | 20,761 |
| 1993 | 77,337 | 49,345 | 7,972 | 8,561 |
| 1992 | 77,357 | 57,522 | 13,933 | -11,847 |
| 1991 | 73,740 | 153,141 | 12,948 | -37,914 |
| 1990 | 71,764 | 178,732 | 13,976 | -34,855 |
| 1989 | 68,674 | 14,192 | 22,011 | -30,615 |
| 1988 | 71,072 | 1,675 | 24,047 | -26,595 |
| 1987 | 69,904 | 7,511 | 28,084 | -23,142 |
| 1986 | 70,073 | -3,598 | 31,102 | -20,000 |
| 1985 | 71,538 | -3,686 | 33,077 | -19,183 |
| 1984 | 70,703 | 10,933 | 45,983 | -16,658 |
| 1983 | 70,196 | 689 | 47,798 | -16,568 |
| 1982 | 68,931 | 16,563 | 58,479 | -15,006 |
| 1981 | 67,647 | 16,021 | 56,152 | -7,938 |
| 1980 | 68,253 | 16,284 | 63,481 | 29,881 |
| 1979 | 68,148 | 15,591 | 67,628 | 32,434 |
| 1978 | 67,158 | 15,556 | 70,731 | 34,345 |
| 1977 | 70,092 | 12,747 | 84,156 | 37,779 |
| 1976 | 74,899 | 10,459 | 85,138 | 40,490 |
| 1975 | 70,828 | 11,726 | 81,841 | 42,262 |
| 1974 | 68,891 | 11,929 | 74,412 | 41,254 |
| 1973 | 65,560 | 14,310 | 76,835 | 39,748 |
| 1972 | 62,960 | 27,415 | 83,715 | 39,058 |
| 1971 | 64,449 | 52,632 | 82,980 | 48,944 |
| 1970 | 56,506 | 56,173 | 87,672 | -191,862 |
| 1969 | 53,800 | 59,928 | 89,329 | -161,114 |
| 1968 | 51,014 | 60,804 | 100,737 | -145,200 |
| 1967 | 47,488 | 59,483 | 106,495 | -136,232 |
| 1966 | 50,477 | 57,347 | 107,171 | -129,233 |
| 1965 | 49,979 | 54,694 | 115,182 | -123,855 |
| 1964 | 48,015 | 54,050 | 120,170 | -118,763 |
| 1963 | 44,964 | 53,877 | 113,783 | -116,874 |
| 1962 | 43,337 | 52,313 | 123,217 | -113,947 |
| 1961 | 42,170 | 34,482 | 117,867 | -112,768 |
| 1960 | 44,818 | 10,990 | 118,693 | -95,886 |
Data sources: World Bank | Health (1960–2025, retrieved 2026-07-08).
GeoRank.org/population/israel/portugal | CC BY
Over the last 10 years, 86.8% of the population change in Israel is from natural causes (a gain of 1,342,605 people) and 13.2% is from migration (a gain of 204,357 people). In Portugal 48.2% is from natural causes (a loss of 314,089 people) and 51.8% is from migration (a gain of 337,649 people).
As of 2024, 2,091,569 residents or 22.3% of the population were not native-born in Israel, compared to 1,127,184 people or 10.8% in Portugal.
Biggest cities by population
|
Israel
|
|
|---|---|
| City | Population |
| Jerusalem | 936K |
| Tel Aviv | 468K |
| Haifa | 283K |
| Rishon LeZion | 250K |
| Petah Tikva | 236K |
| Netanya | 217K |
| Beersheba | 209K |
| Holon | 194K |
| Bnei Brak | 194K |
| Ramat Gan | 159K |
|
Portugal
|
|
|---|---|
| City | Population |
| Lisbon | 546K |
| Sintra | 386K |
| Vila Nova de Gaia | 304K |
| Porto | 232K |
| Cascais | 214K |
| Loures | 202K |
| Braga | 193K |
| Almada | 177K |
| Matosinhos | 173K |
| Oeiras | 172K |
Compare countries by 7 more topics
Population differences between Israel and Portugal
|
Israel
|
Portugal
|
|
|---|---|---|
| Life expectancy | 82.9 years | 82.9 years |
| Average age | 33.8 years | 45.9 years |
| Median age | 30.2 years | 47.8 years |
| Male:Female ratio | 49.8:50.2 | 47.6:52.4 |
| Fertility rate | 2.87 births per woman | 1.41 births per woman |
| Population density | 1,228 ppl/mi² | 305 ppl/mi² |
Population map with other countries
Data sources: World Bank | Health (1960–2025, retrieved 2026-07-08); United Nations | World Population Prospects (1960–2026, retrieved 2026-07-08); U.S. Census Bureau (1960–2025, retrieved 2026-07-08); Central Intelligence Agency (CIA) (2000–2019, retrieved 2026-07-08).
GeoRank.org/population/israel/portugal | CC BY
Help us show the world through your eyes
Share a photo of your city and help others discover what it looks like to live there. Your contribution makes our data come alive.
Data sources:
- World Bank | Health (1960–2025, retrieved 2026-07-08)
- United Nations | World Population Prospects (1960–2100, retrieved 2026-07-08)
- U.S. Census Bureau (1960–2025, retrieved 2026-07-08)
- Wikidata (2026, retrieved 2026-07-08)
- Central Intelligence Agency (CIA) (2000–2019, retrieved 2026-07-08)
Creative Commons Attribution (CC BY) — you’re free to copy, share, remix, adapt, and use even commercially as long as you give appropriate credit and clearly indicate if you made changes. Other sources may be subject to different license terms.