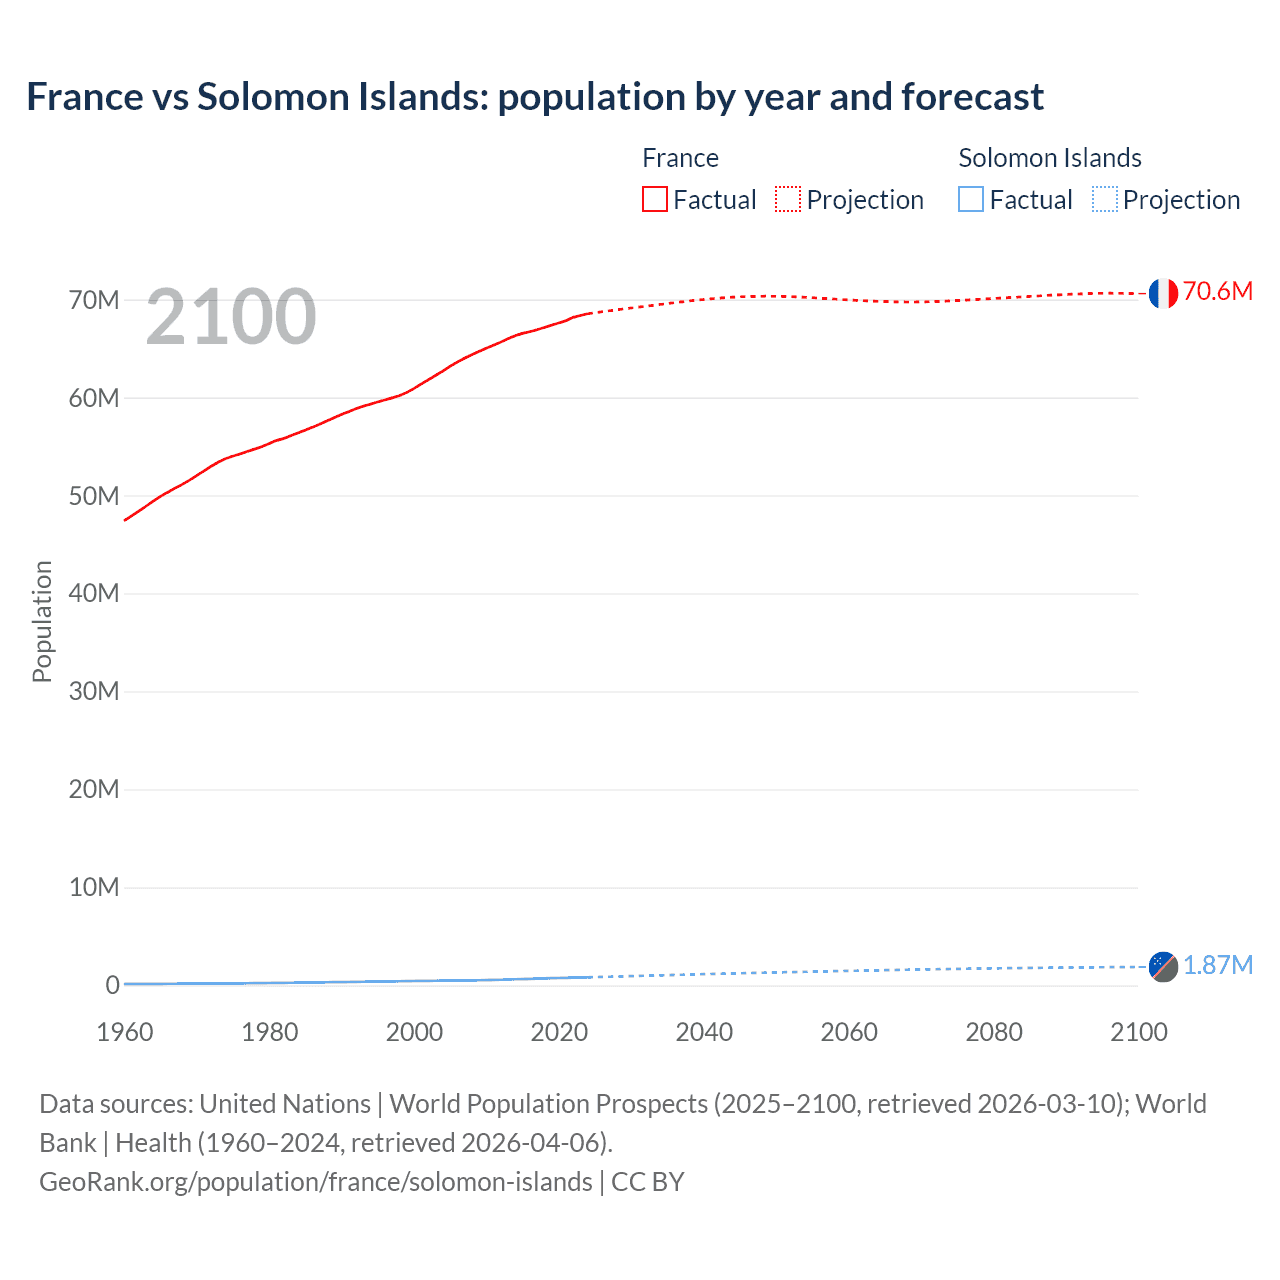
The latest officially reported population of France was 68,720,337 in 2025 vs 838,645 people in the Solomon Islands in 2025. In 2026, based on the adjusted UN estimation, the current France's population is 68,871,753 people compared to 868,694 in the Solomon Islands.
Population statistics:
- France's population is 79.3 times bigger than the Solomon Islands'.
- France is ranked the 23rd most populous country in the world, while the Solomon Islands is the 161st.
- The countries together account for 0.84% of the world: 0.83% for France vs 0.01% for the Solomon Islands.
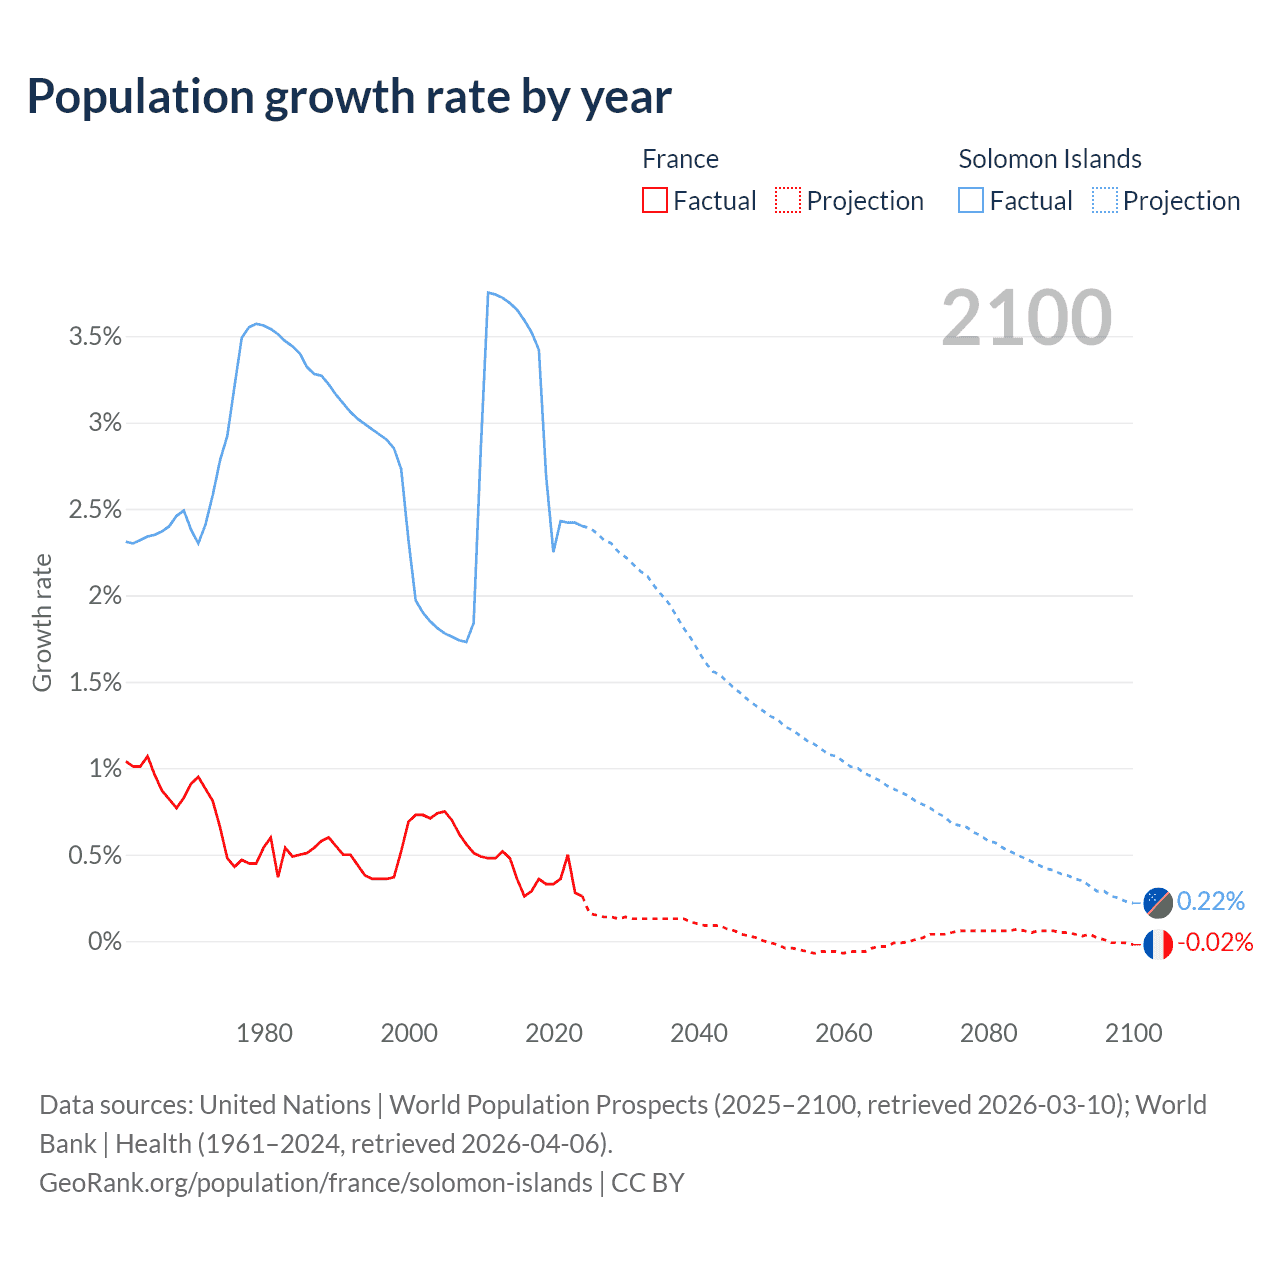
- For the last 10 years, France has had an average growth rate of +0.32% per year vs +2.83% in the Solomon Islands.
- Since 2006, the population of France has increased from 63.6M people to 68.9M (8.25% growth), while the Solomon Islands has grown from 492K to 869K (76.7% growth).
France vs Solomon Islands: population by year and forecast
| Year | Population | |
|---|---|---|
 France
|
 Solomon Islands
|
|
| 2100 | 70,675,442 | 1,869,132 |
| 2099 | 70,692,029 | 1,865,051 |
| 2098 | 70,701,942 | 1,860,822 |
| 2097 | 70,707,028 | 1,856,197 |
| 2096 | 70,713,643 | 1,851,361 |
| 2095 | 70,707,277 | 1,846,006 |
| 2094 | 70,691,394 | 1,840,576 |
| 2093 | 70,665,663 | 1,834,659 |
| 2092 | 70,643,058 | 1,828,323 |
| 2091 | 70,615,655 | 1,821,781 |
| 2090 | 70,582,877 | 1,814,933 |
| 2089 | 70,549,228 | 1,807,885 |
| 2088 | 70,510,136 | 1,800,523 |
| 2087 | 70,470,494 | 1,792,919 |
| 2086 | 70,427,922 | 1,784,993 |
| 2085 | 70,390,427 | 1,776,798 |
| 2084 | 70,348,036 | 1,768,230 |
| 2083 | 70,296,271 | 1,759,388 |
| 2082 | 70,255,426 | 1,750,221 |
| 2081 | 70,210,373 | 1,740,741 |
| 2080 | 70,169,003 | 1,730,900 |
| 2079 | 70,127,568 | 1,720,938 |
| 2078 | 70,087,269 | 1,710,578 |
| 2077 | 70,045,257 | 1,699,838 |
| 2076 | 70,001,871 | 1,688,671 |
| 2075 | 69,959,255 | 1,677,384 |
| 2074 | 69,924,120 | 1,665,984 |
| 2073 | 69,892,712 | 1,654,063 |
| 2072 | 69,866,697 | 1,641,845 |
| 2071 | 69,838,818 | 1,629,270 |
| 2070 | 69,826,471 | 1,616,540 |
| 2069 | 69,816,539 | 1,603,485 |
| 2068 | 69,818,570 | 1,590,112 |
| 2067 | 69,826,386 | 1,576,525 |
| 2066 | 69,835,591 | 1,562,815 |
| 2065 | 69,856,319 | 1,548,873 |
| 2064 | 69,880,666 | 1,534,676 |
| 2063 | 69,910,009 | 1,520,167 |
| 2062 | 69,948,667 | 1,505,610 |
| 2061 | 69,988,307 | 1,490,754 |
| 2060 | 70,030,670 | 1,475,849 |
| 2059 | 70,076,337 | 1,460,639 |
| 2058 | 70,119,195 | 1,445,210 |
| 2057 | 70,164,701 | 1,429,794 |
| 2056 | 70,208,938 | 1,414,149 |
| 2055 | 70,258,544 | 1,398,271 |
| 2054 | 70,298,466 | 1,382,259 |
| 2053 | 70,332,664 | 1,366,025 |
| 2052 | 70,357,980 | 1,349,539 |
| 2051 | 70,383,190 | 1,332,975 |
| 2050 | 70,398,057 | 1,316,163 |
| 2049 | 70,407,335 | 1,299,210 |
| 2048 | 70,406,135 | 1,282,103 |
| 2047 | 70,394,515 | 1,264,854 |
| 2046 | 70,376,409 | 1,247,457 |
| 2045 | 70,345,569 | 1,229,853 |
| 2044 | 70,306,509 | 1,212,131 |
| 2043 | 70,260,348 | 1,194,206 |
| 2042 | 70,199,353 | 1,176,128 |
| 2041 | 70,133,877 | 1,158,032 |
| 2040 | 70,067,958 | 1,139,694 |
| 2039 | 69,998,706 | 1,120,879 |
| 2038 | 69,920,456 | 1,101,654 |
| 2037 | 69,831,930 | 1,082,017 |
| 2036 | 69,743,406 | 1,062,068 |
| 2035 | 69,651,629 | 1,041,799 |
| 2034 | 69,558,099 | 1,021,368 |
| 2033 | 69,468,319 | 1,000,876 |
| 2032 | 69,377,856 | 980,211 |
| 2031 | 69,288,525 | 959,672 |
| 2030 | 69,197,981 | 939,186 |
| 2029 | 69,104,114 | 918,810 |
| 2028 | 69,012,886 | 898,552 |
| 2027 | 68,917,613 | 878,392 |
| 2026 | 68,823,318 | 858,453 |
| 2025 | 68,720,337 | 838,645 |
| 2024 | 68,551,653 | 819,198 |
| 2023 | 68,372,286 | 800,005 |
| 2022 | 68,184,457 | 781,066 |
| 2021 | 67,842,811 | 762,591 |
| 2020 | 67,601,110 | 744,498 |
| 2019 | 67,382,061 | 728,147 |
| 2018 | 67,158,348 | 709,101 |
| 2017 | 66,918,020 | 685,672 |
| 2016 | 66,724,104 | 662,379 |
| 2015 | 66,548,272 | 639,415 |
| 2014 | 66,312,067 | 616,908 |
| 2013 | 65,997,932 | 594,945 |
| 2012 | 65,657,659 | 573,606 |
| 2011 | 65,340,830 | 552,945 |
| 2010 | 65,026,211 | 532,968 |
| 2009 | 64,706,436 | 518,141 |
| 2008 | 64,375,116 | 508,790 |
| 2007 | 64,016,890 | 500,156 |
| 2006 | 63,622,342 | 491,594 |
| 2005 | 63,180,854 | 483,080 |
| 2004 | 62,707,588 | 474,611 |
| 2003 | 62,249,855 | 466,154 |
| 2002 | 61,812,142 | 457,671 |
| 2001 | 61,364,377 | 449,125 |
| 2000 | 60,918,661 | 440,469 |
| 1999 | 60,501,986 | 430,500 |
| 1998 | 60,190,684 | 419,071 |
| 1997 | 59,968,066 | 407,474 |
| 1996 | 59,754,504 | 396,009 |
| 1995 | 59,541,294 | 384,733 |
| 1994 | 59,324,863 | 373,675 |
| 1993 | 59,103,094 | 362,839 |
| 1992 | 58,846,584 | 352,205 |
| 1991 | 58,554,242 | 341,738 |
| 1990 | 58,261,012 | 331,435 |
| 1989 | 57,943,062 | 321,282 |
| 1988 | 57,598,186 | 311,265 |
| 1987 | 57,266,167 | 301,414 |
| 1986 | 56,956,002 | 291,842 |
| 1985 | 56,665,619 | 282,455 |
| 1984 | 56,383,085 | 273,163 |
| 1983 | 56,108,330 | 264,068 |
| 1982 | 55,806,789 | 255,200 |
| 1981 | 55,603,353 | 246,555 |
| 1980 | 55,274,184 | 238,135 |
| 1979 | 54,979,851 | 229,953 |
| 1978 | 54,734,030 | 222,029 |
| 1977 | 54,486,467 | 214,418 |
| 1976 | 54,232,383 | 207,194 |
| 1975 | 54,002,853 | 200,744 |
| 1974 | 53,746,571 | 195,041 |
| 1973 | 53,392,161 | 189,774 |
| 1972 | 52,962,356 | 184,994 |
| 1971 | 52,499,553 | 180,637 |
| 1970 | 52,007,169 | 176,579 |
| 1969 | 51,536,014 | 172,476 |
| 1968 | 51,112,980 | 168,282 |
| 1967 | 50,722,791 | 164,245 |
| 1966 | 50,311,637 | 160,393 |
| 1965 | 49,877,725 | 156,686 |
| 1964 | 49,401,492 | 153,085 |
| 1963 | 48,877,567 | 149,589 |
| 1962 | 48,389,516 | 146,201 |
| 1961 | 47,905,982 | 142,912 |
| 1960 | 47,412,964 | 139,688 |
Data sources: United Nations | World Population Prospects (2026–2100, retrieved 2026-07-08); World Bank | Health (1960–2025, retrieved 2026-07-08).
GeoRank.org/population/france/solomon-islands | CC BY 
From 2006 to 2016, the population of France increased by 3,101,762 people (a 4.88% growth), while the Solomon Islands gained 170,785 people (a 34.7% growth).
For the next 10 years, from 2016 to 2026, France gained 2,147,649 people (a 3.22% growth), while the Solomon Islands' population increased by 206,315 people (a 31.1% growth).
France was ranked 20th most populous country in 2006 and is 23rd in 2026. The Solomon Islands was ranked 165th in 2006 and ranked 161st now.
The UN's World Population Prospects forecasts that in 24 years (in 2050) France's population will grow by 2.22% to 70,398,057 people with a rank change from 23rd to 30th. The population of the Solomon Islands will increase by 51.5% to 1,316,163 people and rank change from 161st to 156th.
France is projected to reach its peak in 2096 at 70.7M people compared to the peak of 1.87M people in 2100 for the Solomon Islands.
Population growth rate by year
| Year | Growth rate | |
|---|---|---|
|
France
|
Solomon Islands
|
|
| 2100 | -0.02% | 0.22% |
| 2099 | -0.01% | 0.23% |
| 2098 | -0.007% | 0.25% |
| 2097 | -0.009% | 0.26% |
| 2096 | 0.009% | 0.29% |
| 2095 | 0.02% | 0.29% |
| 2094 | 0.04% | 0.32% |
| 2093 | 0.03% | 0.35% |
| 2092 | 0.04% | 0.36% |
| 2091 | 0.05% | 0.38% |
| 2090 | 0.05% | 0.39% |
| 2089 | 0.06% | 0.41% |
| 2088 | 0.06% | 0.42% |
| 2087 | 0.06% | 0.44% |
| 2086 | 0.05% | 0.46% |
| 2085 | 0.06% | 0.48% |
| 2084 | 0.07% | 0.5% |
| 2083 | 0.06% | 0.52% |
| 2082 | 0.06% | 0.54% |
| 2081 | 0.06% | 0.57% |
| 2080 | 0.06% | 0.58% |
| 2079 | 0.06% | 0.61% |
| 2078 | 0.06% | 0.63% |
| 2077 | 0.06% | 0.66% |
| 2076 | 0.06% | 0.67% |
| 2075 | 0.05% | 0.68% |
| 2074 | 0.04% | 0.72% |
| 2073 | 0.04% | 0.74% |
| 2072 | 0.04% | 0.77% |
| 2071 | 0.02% | 0.79% |
| 2070 | 0.01% | 0.81% |
| 2069 | -0.003% | 0.84% |
| 2068 | -0.01% | 0.86% |
| 2067 | -0.01% | 0.88% |
| 2066 | -0.03% | 0.9% |
| 2065 | -0.03% | 0.93% |
| 2064 | -0.04% | 0.95% |
| 2063 | -0.06% | 0.97% |
| 2062 | -0.06% | 1% |
| 2061 | -0.06% | 1.01% |
| 2060 | -0.07% | 1.04% |
| 2059 | -0.06% | 1.07% |
| 2058 | -0.06% | 1.08% |
| 2057 | -0.06% | 1.11% |
| 2056 | -0.07% | 1.14% |
| 2055 | -0.06% | 1.16% |
| 2054 | -0.05% | 1.19% |
| 2053 | -0.04% | 1.22% |
| 2052 | -0.04% | 1.24% |
| 2051 | -0.02% | 1.28% |
| 2050 | -0.01% | 1.3% |
| 2049 | 0.002% | 1.33% |
| 2048 | 0.02% | 1.36% |
| 2047 | 0.03% | 1.39% |
| 2046 | 0.04% | 1.43% |
| 2045 | 0.06% | 1.46% |
| 2044 | 0.07% | 1.5% |
| 2043 | 0.09% | 1.54% |
| 2042 | 0.09% | 1.56% |
| 2041 | 0.09% | 1.61% |
| 2040 | 0.1% | 1.68% |
| 2039 | 0.11% | 1.75% |
| 2038 | 0.13% | 1.81% |
| 2037 | 0.13% | 1.88% |
| 2036 | 0.13% | 1.95% |
| 2035 | 0.13% | 2% |
| 2034 | 0.13% | 2.05% |
| 2033 | 0.13% | 2.11% |
| 2032 | 0.13% | 2.14% |
| 2031 | 0.13% | 2.18% |
| 2030 | 0.14% | 2.22% |
| 2029 | 0.13% | 2.25% |
| 2028 | 0.14% | 2.3% |
| 2027 | 0.14% | 2.32% |
| 2026 | 0.15% | 2.36% |
| 2025 | 0.25% | 2.37% |
| 2024 | 0.26% | 2.4% |
| 2023 | 0.28% | 2.42% |
| 2022 | 0.5% | 2.42% |
| 2021 | 0.36% | 2.43% |
| 2020 | 0.33% | 2.25% |
| 2019 | 0.33% | 2.69% |
| 2018 | 0.36% | 3.42% |
| 2017 | 0.29% | 3.52% |
| 2016 | 0.26% | 3.59% |
| 2015 | 0.36% | 3.65% |
| 2014 | 0.48% | 3.69% |
| 2013 | 0.52% | 3.72% |
| 2012 | 0.48% | 3.74% |
| 2011 | 0.48% | 3.75% |
| 2010 | 0.49% | 2.86% |
| 2009 | 0.51% | 1.84% |
| 2008 | 0.56% | 1.73% |
| 2007 | 0.62% | 1.74% |
| 2006 | 0.7% | 1.76% |
| 2005 | 0.75% | 1.78% |
| 2004 | 0.74% | 1.81% |
| 2003 | 0.71% | 1.85% |
| 2002 | 0.73% | 1.9% |
| 2001 | 0.73% | 1.97% |
| 2000 | 0.69% | 2.32% |
| 1999 | 0.52% | 2.73% |
| 1998 | 0.37% | 2.85% |
| 1997 | 0.36% | 2.9% |
| 1996 | 0.36% | 2.93% |
| 1995 | 0.36% | 2.96% |
| 1994 | 0.38% | 2.99% |
| 1993 | 0.44% | 3.02% |
| 1992 | 0.5% | 3.06% |
| 1991 | 0.5% | 3.11% |
| 1990 | 0.55% | 3.16% |
| 1989 | 0.6% | 3.22% |
| 1988 | 0.58% | 3.27% |
| 1987 | 0.54% | 3.28% |
| 1986 | 0.51% | 3.32% |
| 1985 | 0.5% | 3.4% |
| 1984 | 0.49% | 3.44% |
| 1983 | 0.54% | 3.47% |
| 1982 | 0.37% | 3.51% |
| 1981 | 0.6% | 3.54% |
| 1980 | 0.54% | 3.56% |
| 1979 | 0.45% | 3.57% |
| 1978 | 0.45% | 3.55% |
| 1977 | 0.47% | 3.49% |
| 1976 | 0.43% | 3.21% |
| 1975 | 0.48% | 2.92% |
| 1974 | 0.66% | 2.78% |
| 1973 | 0.81% | 2.58% |
| 1972 | 0.88% | 2.41% |
| 1971 | 0.95% | 2.3% |
| 1970 | 0.91% | 2.38% |
| 1969 | 0.83% | 2.49% |
| 1968 | 0.77% | 2.46% |
| 1967 | 0.82% | 2.4% |
| 1966 | 0.87% | 2.37% |
| 1965 | 0.96% | 2.35% |
| 1964 | 1.07% | 2.34% |
| 1963 | 1.01% | 2.32% |
| 1962 | 1.01% | 2.3% |
| 1961 | 1.04% | 2.31% |
Data sources: United Nations | World Population Prospects (2026–2100, retrieved 2026-07-08); World Bank | Health (1961–2025, retrieved 2026-07-08).
GeoRank.org/population/france/solomon-islands | CC BY
In 2025, the population of France grew by 0.25%, while the Solomon Islands' population grew by 2.37%.
Live population counters
|
France
|
Solomon Islands
|
|
|---|---|---|
| Current population |
68871753
|
868694
|
| Population rank | 23/197 | 161/197 |
| Percent of world population | 0.83% | 0.01% |
| One net population change |
3.12 minutes
|
27.1 minutes
|
| One birth every |
47.4 seconds
|
24 minutes
|
| One death every |
48.9 seconds
|
2.1 hours
|
| Daily growth/decline | +462 | +53 |
| Annual growth/decline | +168,684 | +19,447 |
| Annual growth/decline rate | +0.25% | +2.37% |
| Population growth rate rank | 149/197 | 32/197 |
| One migration net change every |
5.75 minutes
|
5.39 hours
|
| Annual migration change | +91,737 | +1,631 |
| Net migration rank | 18/196 | 59/196 |
| Foreign-born residents | 9,186,757 | 2,469 |
| Foreign-born residents rank | 5/195 | 192/195 |
| Foreign-born share of population | 13.8% | 0.3% |
| Foreign-born share rank | 49/195 | 184/195 |
Natural population change vs migration
| Year | Population change | |||
|---|---|---|---|---|
|
France
|
Solomon Islands
|
|||
| Natural | Migration | Natural | Migration | |
| 2025 | - | 91,737 | - | 1,631 |
| 2024 | 20,566 | 90,527 | 17,715 | 1,610 |
| 2023 | 34,186 | 91,862 | 17,436 | 1,636 |
| 2022 | 54,547 | 179,377 | 17,253 | 1,567 |
| 2021 | 74,627 | 131,465 | 16,626 | 1,499 |
| 2020 | 67,602 | 145,593 | 16,488 | 1,556 |
| 2019 | 141,503 | 71,972 | 16,649 | -1,990 |
| 2018 | 147,749 | 132,925 | 16,790 | 6,653 |
| 2017 | 160,604 | 102,984 | 16,897 | 6,513 |
| 2016 | 193,500 | 15,548 | 17,027 | 6,146 |
| 2015 | 206,300 | -345 | 16,909 | 5,853 |
| 2014 | 265,248 | 52,342 | 16,652 | 5,598 |
| 2013 | 244,192 | 116,297 | 16,038 | 5,631 |
| 2012 | 256,065 | 103,287 | 15,585 | 5,420 |
| 2011 | 280,966 | 70,178 | 15,095 | 5,219 |
| 2010 | 286,116 | 52,644 | 14,604 | 5,040 |
| 2009 | 278,238 | 58,032 | 14,381 | -4,360 |
| 2008 | 283,250 | 79,528 | 14,225 | -5,538 |
| 2007 | 288,076 | 91,973 | 13,963 | -5,383 |
| 2006 | 305,387 | 132,512 | 13,799 | -5,262 |
| 2005 | 271,677 | 191,417 | 13,568 | -5,082 |
| 2004 | 282,185 | 200,629 | 13,444 | -4,985 |
| 2003 | 230,325 | 195,616 | 13,344 | -4,881 |
| 2002 | 253,430 | 191,373 | 13,195 | -4,691 |
| 2001 | 263,867 | 179,476 | 13,061 | -4,474 |
| 2000 | 268,042 | 171,637 | 12,938 | -4,219 |
| 1999 | 229,907 | 169,448 | 12,809 | -1,588 |
| 1998 | 222,705 | 20,216 | 12,658 | -1,019 |
| 1997 | 215,885 | -15,255 | 12,478 | -931 |
| 1996 | 221,092 | -21,463 | 12,328 | -947 |
| 1995 | 220,303 | -17,128 | 12,124 | -952 |
| 1994 | 201,704 | -4,232 | 11,771 | -828 |
| 1993 | 224,592 | 16,892 | 11,396 | -665 |
| 1992 | 229,502 | 61,964 | 11,029 | -482 |
| 1991 | 234,216 | 35,201 | 10,789 | -410 |
| 1990 | 238,870 | 43,323 | 10,561 | -335 |
| 1989 | 243,361 | 82,052 | 10,354 | -270 |
| 1988 | 247,672 | 69,935 | 10,142 | -197 |
| 1987 | 251,971 | 59,890 | 9,943 | -179 |
| 1986 | 250,606 | 51,642 | 9,656 | -269 |
| 1985 | 249,328 | 66,149 | 9,534 | -150 |
| 1984 | 248,086 | 76,175 | 9,299 | -102 |
| 1983 | 235,655 | 88,166 | 9,011 | -30 |
| 1982 | 234,389 | 81,084 | 8,720 | 40 |
| 1981 | 222,414 | 69,365 | 8,436 | 99 |
| 1980 | 210,042 | 54,718 | 8,156 | 151 |
| 1979 | 208,923 | 34,295 | 7,874 | 188 |
| 1978 | 213,462 | 18,692 | 7,598 | 174 |
| 1977 | 217,946 | 44,918 | 7,290 | 159 |
| 1976 | 227,776 | 59,515 | 7,058 | -48 |
| 1975 | 248,413 | 16,139 | 6,635 | -760 |
| 1974 | 268,733 | 26,203 | 6,612 | -1,084 |
| 1973 | 282,979 | 103,910 | 6,343 | -1,329 |
| 1972 | 296,589 | 101,223 | 6,074 | -1,520 |
| 1971 | 309,747 | 144,321 | 5,814 | -1,646 |
| 1970 | 322,444 | 182,941 | 5,575 | -1,632 |
| 1969 | 329,831 | 160,403 | 5,444 | -1,187 |
| 1968 | 337,346 | 113,115 | 5,285 | -1,154 |
| 1967 | 339,843 | 63,018 | 5,151 | -1,213 |
| 1966 | 352,181 | 96,097 | 5,028 | -1,256 |
| 1965 | 354,132 | 82,879 | 4,885 | -1,237 |
| 1964 | 360,631 | 163,039 | 4,747 | -1,200 |
| 1963 | 361,694 | 190,925 | 4,571 | -1,129 |
| 1962 | 358,082 | 141,634 | 4,408 | -1,073 |
| 1961 | 354,504 | 128,618 | 4,257 | -1,016 |
| 1960 | 346,115 | 143,032 | 4,119 | -917 |
Data sources: World Bank | Health (1960–2025, retrieved 2026-07-08).
GeoRank.org/population/france/solomon-islands | CC BY
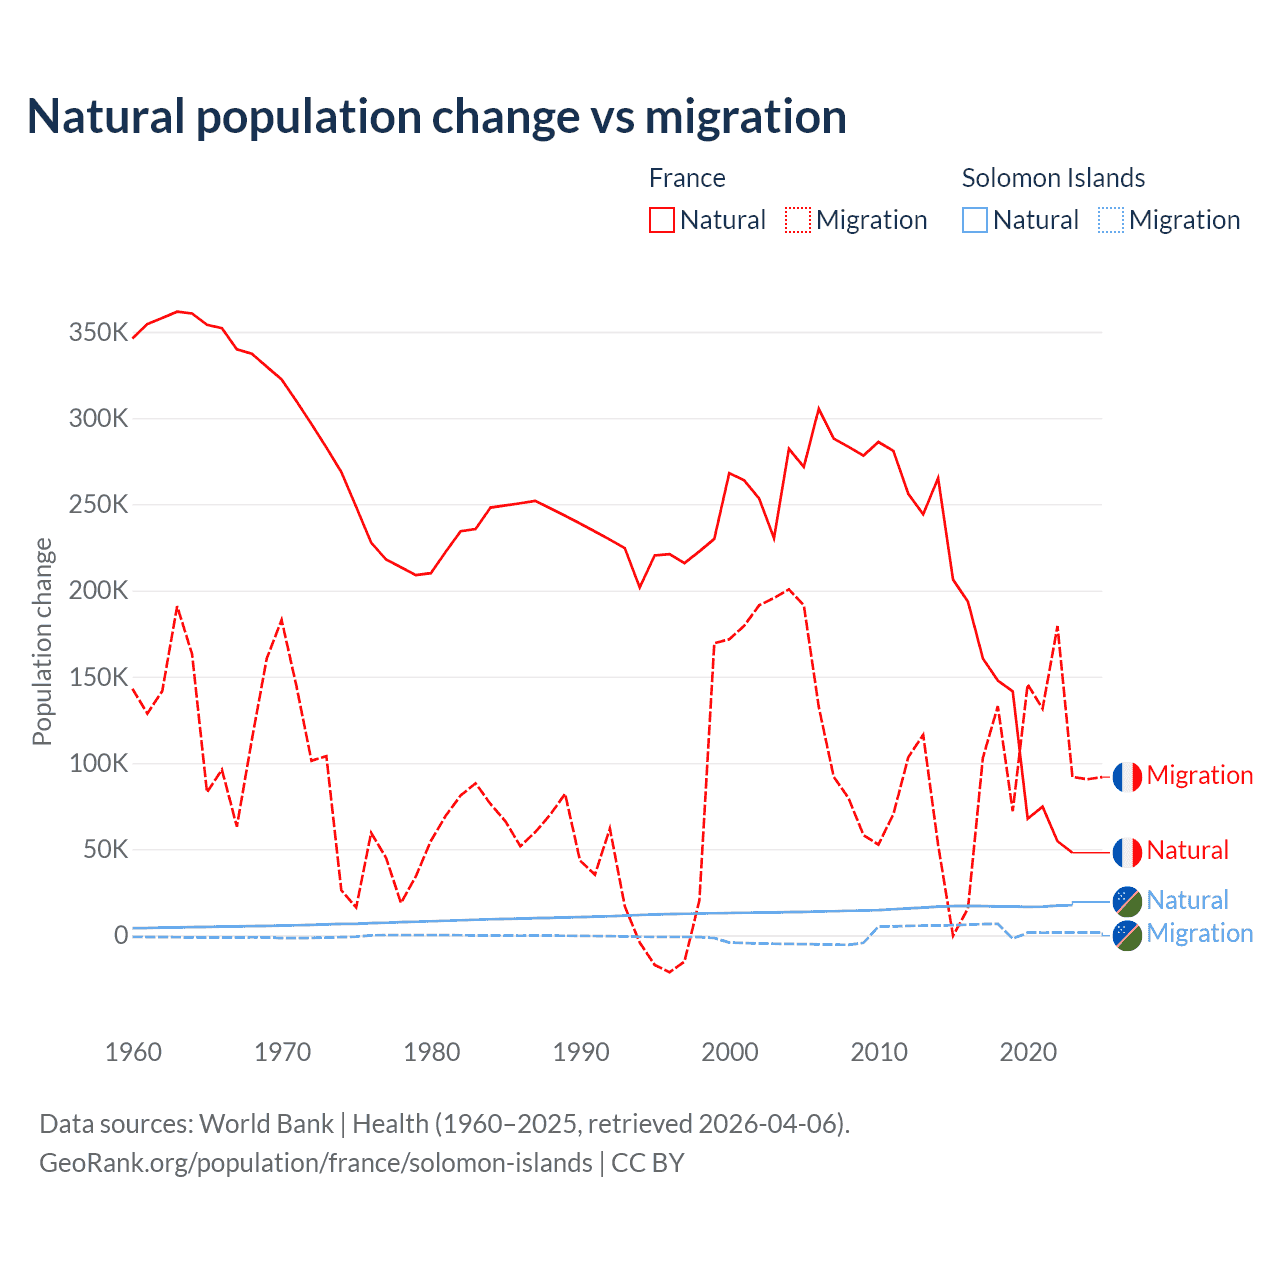
Over the last 10 years, 53.4% of the population change in France is from natural causes (a gain of 1,101,184 people) and 46.6% is from migration (a gain of 961,908 people). In the Solomon Islands 84.5% is from natural causes (a gain of 169,790 people) and 15.5% is from migration (a gain of 31,043 people).
As of 2024, 9,186,757 residents or 13.8% of the population were not native-born in France, compared to 2,469 people or 0.3% in the Solomon Islands.
Biggest cities by population
|
France
|
|
|---|---|
| City | Population |
| Paris | 2.1M |
| Marseille | 886K |
| Lyon | 519K |
| Toulouse | 515K |
| Nice | 358K |
| Nantes | 328K |
| Montpellier | 310K |
| Strasbourg | 294K |
| Bordeaux | 268K |
| Lille | 238K |
|
Solomon Islands
|
|
|---|---|
| City | Population |
| Honiara | 84.5K |
| Auki | 6.81K |
Compare countries by 7 more topics
Population differences between France and the Solomon Islands
|
France
|
Solomon Islands
|
|
|---|---|---|
| Life expectancy | 83.7 years | 71 years |
| Average age | 42.8 years | 25.7 years |
| Median age | 43.2 years | 21.8 years |
| Male:Female ratio | 48.5:51.5 | 51.1:48.9 |
| Fertility rate | 1.61 births per woman | 3.51 births per woman |
| Population density | 331 ppl/mi² | 79.4 ppl/mi² |
Population map with other countries
Data sources: World Bank | Health (1960–2025, retrieved 2026-07-08); United Nations | World Population Prospects (1960–2026, retrieved 2026-07-08); U.S. Census Bureau (1960–2025, retrieved 2026-07-08); Central Intelligence Agency (CIA) (2000–2019, retrieved 2026-07-08).
GeoRank.org/population/france/solomon-islands | CC BY
Help us show the world through your eyes
Share a photo of your city and help others discover what it looks like to live there. Your contribution makes our data come alive.
Data sources:
- World Bank | Health (1960–2025, retrieved 2026-07-08)
- United Nations | World Population Prospects (1960–2100, retrieved 2026-07-08)
- U.S. Census Bureau (1960–2025, retrieved 2026-07-08)
- Central Intelligence Agency (CIA) (2000–2019, retrieved 2026-07-08)
- Wikidata (2026, retrieved 2026-07-08)
Creative Commons Attribution (CC BY) — you’re free to copy, share, remix, adapt, and use even commercially as long as you give appropriate credit and clearly indicate if you made changes. Other sources may be subject to different license terms.