The latest officially reported population of Bahrain was 1,600,366 in 2025 vs 341,784,857 people in the United States in 2025. In 2026, based on the adjusted UN estimation, the current Bahrain's population is 1,649,267 people compared to 344,434,632 in the United States.
Population statistics:
- The United States' population is 208.8 times bigger than Bahrain's.
- Bahrain is ranked the 151st most populous country in the world, while the United States is the 3rd.
- The countries together account for 4.16% of the world: 0.02% for Bahrain vs 4.15% for the United States.
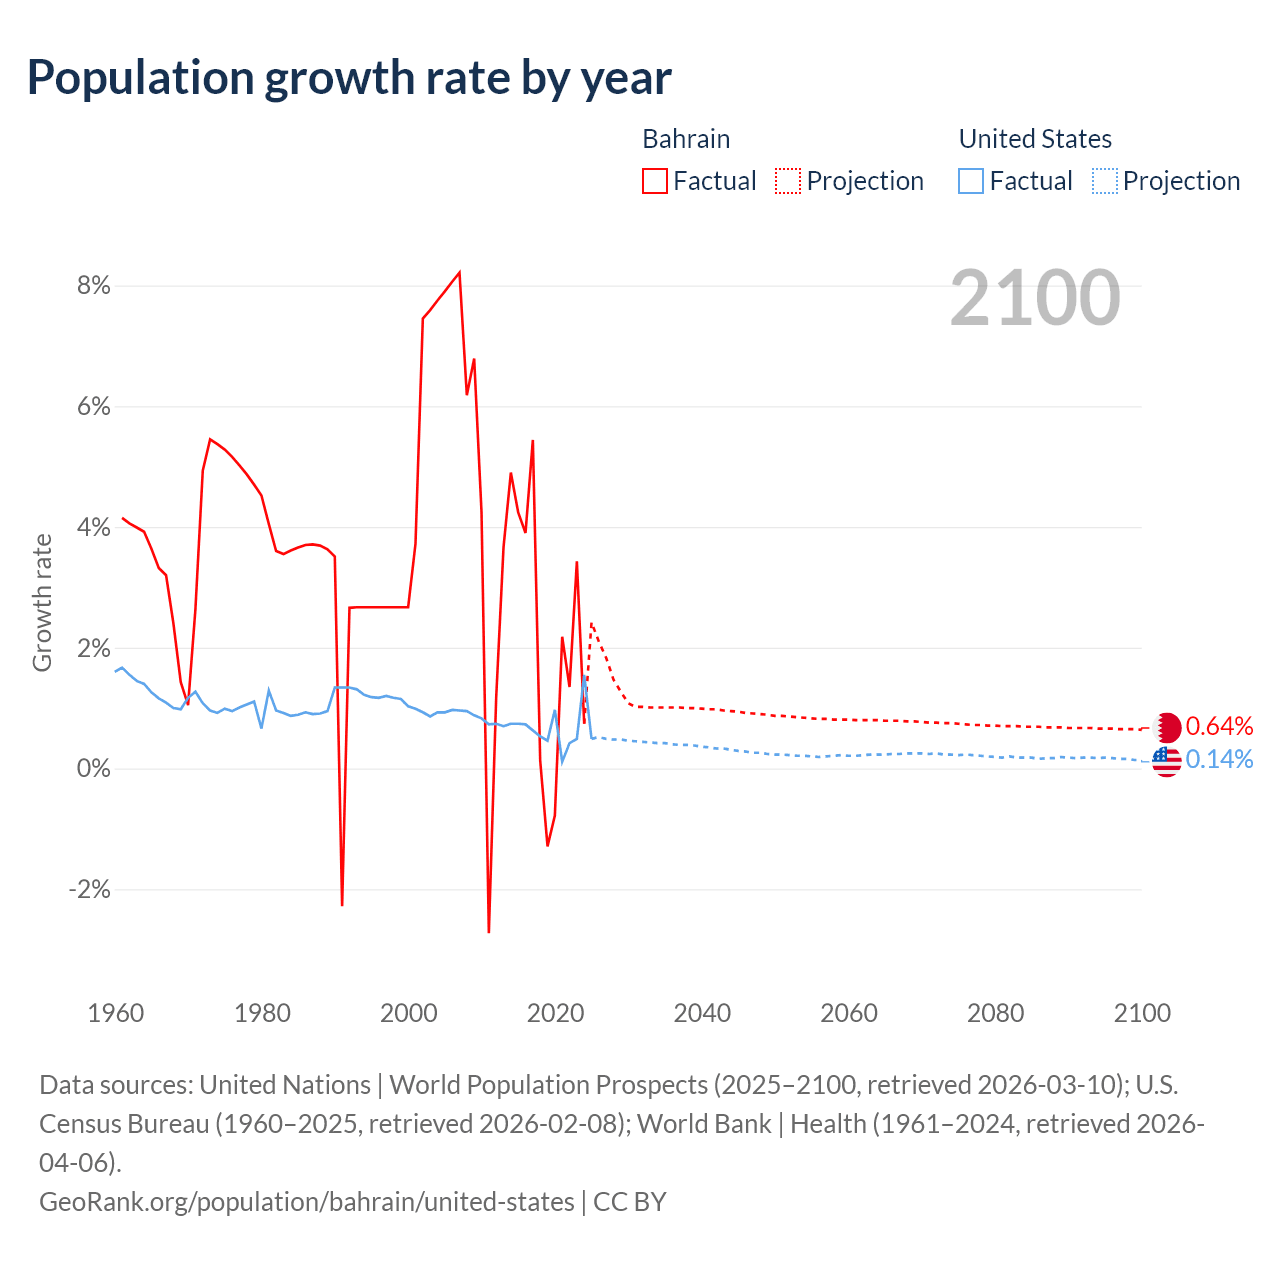
- For the last 10 years, Bahrain has had an average growth rate of +1.83% per year vs +0.65% in the United States.
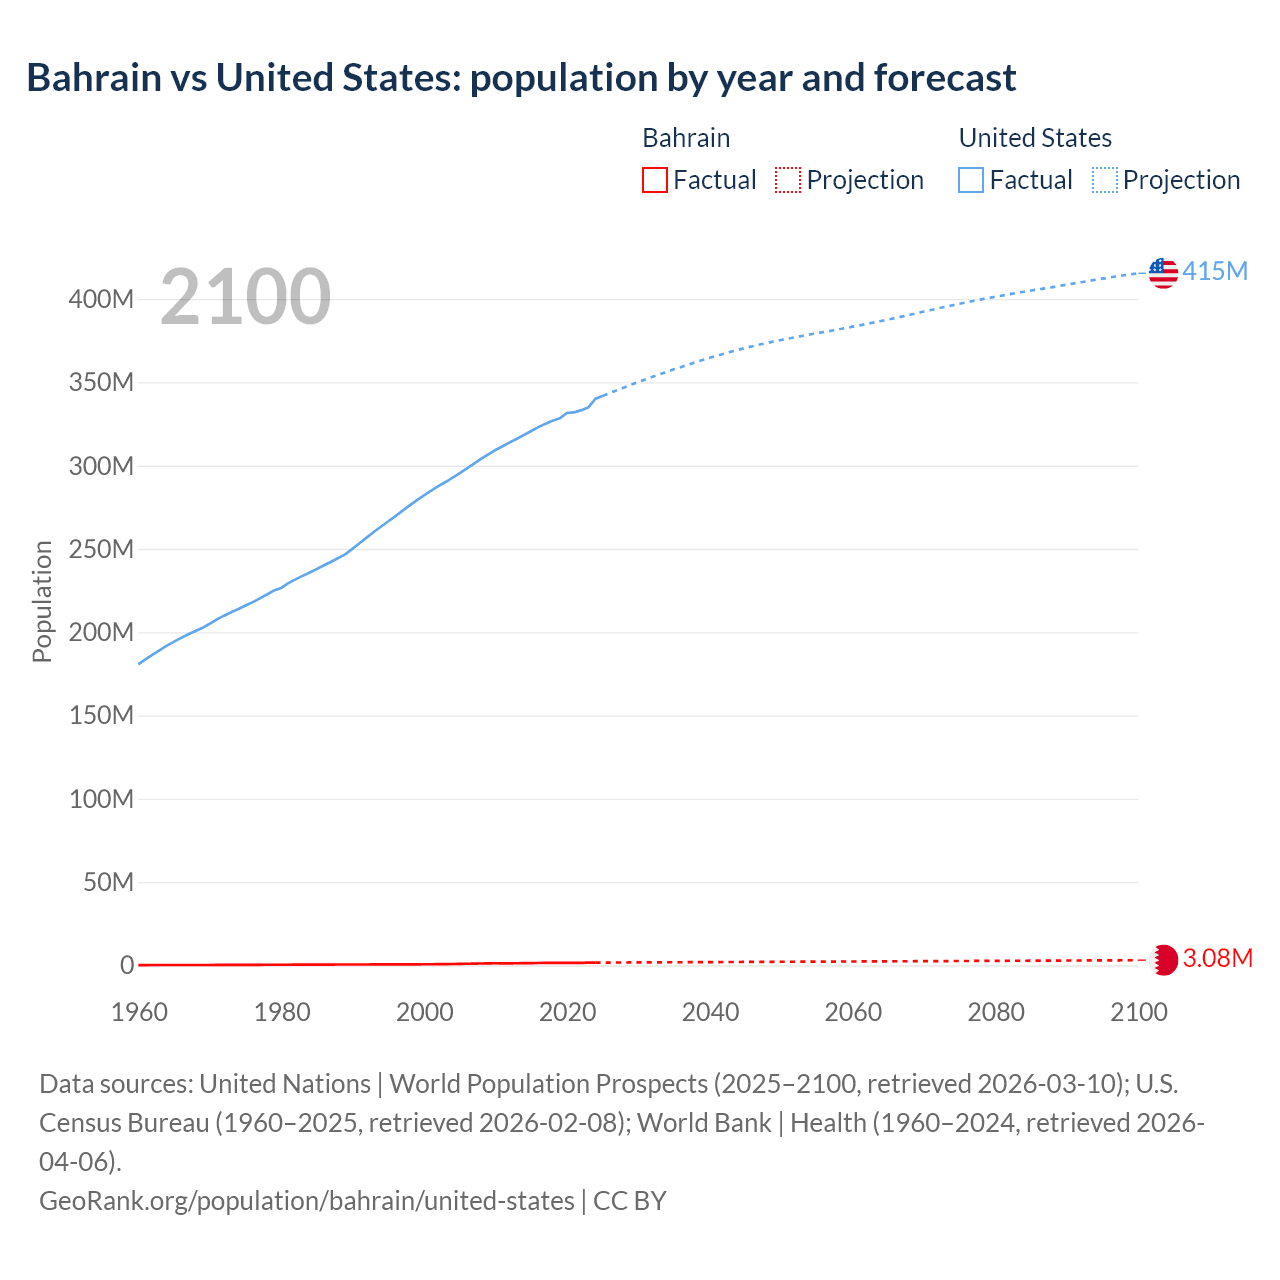
- Since 2006, the population of Bahrain has increased from 960K people to 1.65M (71.7% growth), while the United States has grown from 298M to 344M (15.4% growth).
Bahrain vs United States: population by year and forecast
| Year | Population | |
|---|---|---|
 Bahrain
|
 United States
|
|
| 2100 | 3,031,337 | 415,429,771 |
| 2099 | 3,011,916 | 414,829,167 |
| 2098 | 2,992,487 | 414,231,720 |
| 2097 | 2,973,093 | 413,576,381 |
| 2096 | 2,953,759 | 412,927,393 |
| 2095 | 2,934,466 | 412,225,379 |
| 2094 | 2,915,204 | 411,498,749 |
| 2093 | 2,896,001 | 410,785,729 |
| 2092 | 2,876,839 | 410,051,921 |
| 2091 | 2,857,700 | 409,320,183 |
| 2090 | 2,838,655 | 408,613,732 |
| 2089 | 2,819,707 | 407,885,645 |
| 2088 | 2,800,765 | 407,129,733 |
| 2087 | 2,781,926 | 406,421,298 |
| 2086 | 2,763,133 | 405,715,343 |
| 2085 | 2,744,327 | 405,059,379 |
| 2084 | 2,725,573 | 404,343,130 |
| 2083 | 2,706,819 | 403,612,785 |
| 2082 | 2,688,091 | 402,871,293 |
| 2081 | 2,669,405 | 402,054,554 |
| 2080 | 2,650,761 | 401,319,194 |
| 2079 | 2,632,128 | 400,554,914 |
| 2078 | 2,613,489 | 399,737,968 |
| 2077 | 2,594,847 | 398,906,565 |
| 2076 | 2,576,208 | 398,035,750 |
| 2075 | 2,557,513 | 397,109,170 |
| 2074 | 2,538,752 | 396,226,412 |
| 2073 | 2,519,971 | 395,307,725 |
| 2072 | 2,501,190 | 394,393,561 |
| 2071 | 2,482,346 | 393,415,363 |
| 2070 | 2,463,552 | 392,469,727 |
| 2069 | 2,444,735 | 391,479,981 |
| 2068 | 2,425,908 | 390,517,695 |
| 2067 | 2,407,081 | 389,543,856 |
| 2066 | 2,388,320 | 388,597,719 |
| 2065 | 2,369,644 | 387,685,327 |
| 2064 | 2,351,001 | 386,805,026 |
| 2063 | 2,332,422 | 385,911,917 |
| 2062 | 2,313,935 | 385,032,627 |
| 2061 | 2,295,551 | 384,170,837 |
| 2060 | 2,277,267 | 383,361,269 |
| 2059 | 2,259,033 | 382,542,030 |
| 2058 | 2,240,850 | 381,704,804 |
| 2057 | 2,222,771 | 380,907,023 |
| 2056 | 2,204,739 | 380,159,777 |
| 2055 | 2,186,699 | 379,430,756 |
| 2054 | 2,168,666 | 378,682,851 |
| 2053 | 2,150,594 | 377,878,421 |
| 2052 | 2,132,515 | 377,073,303 |
| 2051 | 2,114,430 | 376,229,840 |
| 2050 | 2,096,281 | 375,373,155 |
| 2049 | 2,078,112 | 374,493,150 |
| 2048 | 2,059,873 | 373,590,762 |
| 2047 | 2,041,553 | 372,626,259 |
| 2046 | 2,023,114 | 371,644,809 |
| 2045 | 2,004,578 | 370,602,914 |
| 2044 | 1,985,907 | 369,518,897 |
| 2043 | 1,967,174 | 368,375,680 |
| 2042 | 1,948,376 | 367,158,772 |
| 2041 | 1,929,535 | 365,937,822 |
| 2040 | 1,910,715 | 364,671,837 |
| 2039 | 1,891,961 | 363,367,337 |
| 2038 | 1,873,245 | 361,997,023 |
| 2037 | 1,854,637 | 360,606,236 |
| 2036 | 1,836,126 | 359,193,245 |
| 2035 | 1,817,753 | 357,750,686 |
| 2034 | 1,799,540 | 356,266,726 |
| 2033 | 1,781,495 | 354,775,032 |
| 2032 | 1,763,602 | 353,259,037 |
| 2031 | 1,745,865 | 351,721,511 |
| 2030 | 1,728,268 | 350,155,042 |
| 2029 | 1,709,742 | 348,564,667 |
| 2028 | 1,688,220 | 346,906,294 |
| 2027 | 1,663,819 | 345,257,605 |
| 2026 | 1,633,899 | 343,565,426 |
| 2025 | 1,600,366 | 341,784,857 |
| 2024 | 1,588,670 | 340,110,988 |
| 2023 | 1,577,059 | 334,914,895 |
| 2022 | 1,524,693 | 333,271,411 |
| 2021 | 1,504,365 | 331,893,745 |
| 2020 | 1,472,204 | 331,526,933 |
| 2019 | 1,483,756 | 328,329,953 |
| 2018 | 1,503,091 | 326,838,199 |
| 2017 | 1,501,116 | 325,122,128 |
| 2016 | 1,423,726 | 323,071,755 |
| 2015 | 1,370,322 | 320,738,994 |
| 2014 | 1,314,562 | 318,386,329 |
| 2013 | 1,253,191 | 316,059,947 |
| 2012 | 1,208,964 | 313,877,662 |
| 2011 | 1,195,020 | 311,583,481 |
| 2010 | 1,228,543 | 309,327,143 |
| 2009 | 1,178,415 | 306,771,529 |
| 2008 | 1,103,496 | 304,093,966 |
| 2007 | 1,039,295 | 301,231,207 |
| 2006 | 960,424 | 298,379,912 |
| 2005 | 888,822 | 295,516,599 |
| 2004 | 823,741 | 292,805,298 |
| 2003 | 764,517 | 290,107,933 |
| 2002 | 710,553 | 287,625,193 |
| 2001 | 661,316 | 284,968,955 |
| 2000 | 637,582 | 282,162,411 |
| 1999 | 620,989 | 279,294,713 |
| 1998 | 604,842 | 276,115,288 |
| 1997 | 589,115 | 272,911,760 |
| 1996 | 573,792 | 269,667,391 |
| 1995 | 558,879 | 266,557,091 |
| 1994 | 544,366 | 263,435,673 |
| 1993 | 530,225 | 260,255,352 |
| 1992 | 516,458 | 256,894,189 |
| 1991 | 503,052 | 253,492,503 |
| 1990 | 514,797 | 250,131,894 |
| 1989 | 497,327 | 246,819,222 |
| 1988 | 479,929 | 244,499,004 |
| 1987 | 462,854 | 242,288,936 |
| 1986 | 446,286 | 240,132,831 |
| 1985 | 430,358 | 237,923,734 |
| 1984 | 415,154 | 235,824,908 |
| 1983 | 400,707 | 233,792,014 |
| 1982 | 386,983 | 231,664,432 |
| 1981 | 373,524 | 229,465,744 |
| 1980 | 358,978 | 226,542,250 |
| 1979 | 343,457 | 225,055,487 |
| 1978 | 328,046 | 222,584,545 |
| 1977 | 312,823 | 220,239,425 |
| 1976 | 297,863 | 218,035,164 |
| 1975 | 283,243 | 215,973,199 |
| 1974 | 269,038 | 213,853,928 |
| 1973 | 255,320 | 211,908,788 |
| 1972 | 242,113 | 209,896,021 |
| 1971 | 230,733 | 207,660,677 |
| 1970 | 224,809 | 205,052,174 |
| 1969 | 222,469 | 202,676,946 |
| 1968 | 219,337 | 200,706,052 |
| 1967 | 214,189 | 198,712,056 |
| 1966 | 207,543 | 196,560,338 |
| 1965 | 200,866 | 194,302,963 |
| 1964 | 193,816 | 191,888,791 |
| 1963 | 186,501 | 189,241,798 |
| 1962 | 179,349 | 186,537,737 |
| 1961 | 172,346 | 183,691,481 |
| 1960 | 165,477 | 180,671,158 |
Data sources: United Nations | World Population Prospects (2026–2100, retrieved 2026-07-08); U.S. Census Bureau (1960–2025, retrieved 2026-07-08); World Bank | Health (1960–2025, retrieved 2026-07-08).
GeoRank.org/population/bahrain/united-states | CC BY 
From 2006 to 2016, the population of Bahrain increased by 463,302 people (a 48.2% growth), while the United States gained 24,691,843 people (a 8.28% growth).
For the next 10 years, from 2016 to 2026, Bahrain gained 225,541 people (a 15.8% growth), while the United States' population increased by 21,362,877 people (a 6.61% growth).
Bahrain was ranked 157th most populous country in 2006 and is 151st in 2026. The United States was ranked 3rd in 2006 and still ranked 3rd now.
The UN's World Population Prospects forecasts that in 24 years (in 2050) Bahrain's population will grow by 27.1% to 2,096,281 people with a rank change from 151st to 146th. The population of the United States will increase by 8.98% to 375,373,155 people and will still be ranked 3rd.
Bahrain is projected to reach its peak in 2100 at 3.03M people compared to the peak of 415M people in 2100 for the United States.
Population growth rate by year
| Year | Growth rate | |
|---|---|---|
|
Bahrain
|
United States
|
|
| 2100 | 0.64% | 0.14% |
| 2099 | 0.65% | 0.14% |
| 2098 | 0.65% | 0.16% |
| 2097 | 0.65% | 0.16% |
| 2096 | 0.66% | 0.17% |
| 2095 | 0.66% | 0.18% |
| 2094 | 0.66% | 0.17% |
| 2093 | 0.67% | 0.18% |
| 2092 | 0.67% | 0.18% |
| 2091 | 0.67% | 0.17% |
| 2090 | 0.67% | 0.18% |
| 2089 | 0.68% | 0.19% |
| 2088 | 0.68% | 0.17% |
| 2087 | 0.68% | 0.17% |
| 2086 | 0.69% | 0.16% |
| 2085 | 0.69% | 0.18% |
| 2084 | 0.69% | 0.18% |
| 2083 | 0.7% | 0.18% |
| 2082 | 0.7% | 0.2% |
| 2081 | 0.7% | 0.18% |
| 2080 | 0.71% | 0.19% |
| 2079 | 0.71% | 0.2% |
| 2078 | 0.72% | 0.21% |
| 2077 | 0.72% | 0.22% |
| 2076 | 0.73% | 0.23% |
| 2075 | 0.74% | 0.22% |
| 2074 | 0.75% | 0.23% |
| 2073 | 0.75% | 0.23% |
| 2072 | 0.76% | 0.25% |
| 2071 | 0.76% | 0.24% |
| 2070 | 0.77% | 0.25% |
| 2069 | 0.78% | 0.25% |
| 2068 | 0.78% | 0.25% |
| 2067 | 0.79% | 0.24% |
| 2066 | 0.79% | 0.24% |
| 2065 | 0.79% | 0.23% |
| 2064 | 0.8% | 0.23% |
| 2063 | 0.8% | 0.23% |
| 2062 | 0.8% | 0.22% |
| 2061 | 0.8% | 0.21% |
| 2060 | 0.81% | 0.21% |
| 2059 | 0.81% | 0.22% |
| 2058 | 0.81% | 0.21% |
| 2057 | 0.82% | 0.2% |
| 2056 | 0.82% | 0.19% |
| 2055 | 0.83% | 0.2% |
| 2054 | 0.84% | 0.21% |
| 2053 | 0.85% | 0.21% |
| 2052 | 0.86% | 0.22% |
| 2051 | 0.87% | 0.23% |
| 2050 | 0.87% | 0.23% |
| 2049 | 0.89% | 0.24% |
| 2048 | 0.9% | 0.26% |
| 2047 | 0.91% | 0.26% |
| 2046 | 0.92% | 0.28% |
| 2045 | 0.94% | 0.29% |
| 2044 | 0.95% | 0.31% |
| 2043 | 0.96% | 0.33% |
| 2042 | 0.98% | 0.33% |
| 2041 | 0.98% | 0.35% |
| 2040 | 0.99% | 0.36% |
| 2039 | 1% | 0.38% |
| 2038 | 1% | 0.39% |
| 2037 | 1.01% | 0.39% |
| 2036 | 1.01% | 0.4% |
| 2035 | 1.01% | 0.42% |
| 2034 | 1.01% | 0.42% |
| 2033 | 1.01% | 0.43% |
| 2032 | 1.02% | 0.44% |
| 2031 | 1.02% | 0.45% |
| 2030 | 1.08% | 0.46% |
| 2029 | 1.27% | 0.48% |
| 2028 | 1.47% | 0.48% |
| 2027 | 1.83% | 0.49% |
| 2026 | 2.1% | 0.52% |
| 2025 | 0.74% | 0.49% |
| 2024 | 0.74% | 1.55% |
| 2023 | 3.43% | 0.49% |
| 2022 | 1.35% | 0.42% |
| 2021 | 2.18% | 0.11% |
| 2020 | -0.78% | 0.97% |
| 2019 | -1.29% | 0.46% |
| 2018 | 0.13% | 0.53% |
| 2017 | 5.44% | 0.63% |
| 2016 | 3.9% | 0.73% |
| 2015 | 4.24% | 0.74% |
| 2014 | 4.9% | 0.74% |
| 2013 | 3.66% | 0.7% |
| 2012 | 1.17% | 0.74% |
| 2011 | -2.73% | 0.73% |
| 2010 | 4.25% | 0.83% |
| 2009 | 6.79% | 0.88% |
| 2008 | 6.18% | 0.95% |
| 2007 | 8.21% | 0.96% |
| 2006 | 8.06% | 0.97% |
| 2005 | 7.9% | 0.93% |
| 2004 | 7.75% | 0.93% |
| 2003 | 7.59% | 0.86% |
| 2002 | 7.45% | 0.93% |
| 2001 | 3.72% | 0.99% |
| 2000 | 2.67% | 1.03% |
| 1999 | 2.67% | 1.15% |
| 1998 | 2.67% | 1.17% |
| 1997 | 2.67% | 1.2% |
| 1996 | 2.67% | 1.17% |
| 1995 | 2.67% | 1.18% |
| 1994 | 2.67% | 1.22% |
| 1993 | 2.67% | 1.31% |
| 1992 | 2.66% | 1.34% |
| 1991 | -2.28% | 1.34% |
| 1990 | 3.51% | 1.34% |
| 1989 | 3.63% | 0.95% |
| 1988 | 3.69% | 0.91% |
| 1987 | 3.71% | 0.9% |
| 1986 | 3.7% | 0.93% |
| 1985 | 3.66% | 0.89% |
| 1984 | 3.61% | 0.87% |
| 1983 | 3.55% | 0.92% |
| 1982 | 3.6% | 0.96% |
| 1981 | 4.05% | 1.29% |
| 1980 | 4.52% | 0.66% |
| 1979 | 4.7% | 1.11% |
| 1978 | 4.87% | 1.06% |
| 1977 | 5.02% | 1.01% |
| 1976 | 5.16% | 0.95% |
| 1975 | 5.28% | 0.99% |
| 1974 | 5.37% | 0.92% |
| 1973 | 5.45% | 0.96% |
| 1972 | 4.93% | 1.08% |
| 1971 | 2.64% | 1.27% |
| 1970 | 1.05% | 1.17% |
| 1969 | 1.43% | 0.98% |
| 1968 | 2.4% | 1% |
| 1967 | 3.2% | 1.09% |
| 1966 | 3.32% | 1.16% |
| 1965 | 3.64% | 1.26% |
| 1964 | 3.92% | 1.4% |
| 1963 | 3.99% | 1.45% |
| 1962 | 4.06% | 1.55% |
| 1961 | 4.15% | 1.67% |
| 1960 | - | 1.6% |
Data sources: United Nations | World Population Prospects (2026–2100, retrieved 2026-07-08); U.S. Census Bureau (1960–2025, retrieved 2026-07-08); World Bank | Health (1961–2025, retrieved 2026-07-08).
GeoRank.org/population/bahrain/united-states | CC BY
In 2025, the population of Bahrain grew by 0.74%, while the United States' population grew by 0.49%.
Live population counters
|
Bahrain
|
United States
|
|
|---|---|---|
| Current population |
1649267
|
344434632
|
| Population rank | 151/197 | 3/197 |
| Percent of world population | 0.02% | 4.15% |
| One net population change |
45.1 minutes
|
18.9 seconds
|
| One birth every |
27.5 minutes
|
8.75 seconds
|
| One death every |
2.5 hours
|
10.3 seconds
|
| Daily growth/decline | +32 | +4,586 |
| Annual growth/decline | +11,696 | +1,673,869 |
| Annual growth/decline rate | +0.74% | +0.49% |
| Population growth rate rank | 115/197 | 128/197 |
| One migration net change every |
29.1 minutes
|
25.7 seconds
|
| Annual migration change | +18,128 | +1,230,663 |
| Net migration rank | 34/196 | 2/196 |
| Foreign-born residents | 840,202 | 52,375,047 |
| Foreign-born residents rank | 66/195 | 1/195 |
| Foreign-born share of population | 52.3% | 15.2% |
| Foreign-born share rank | 7/195 | 41/195 |
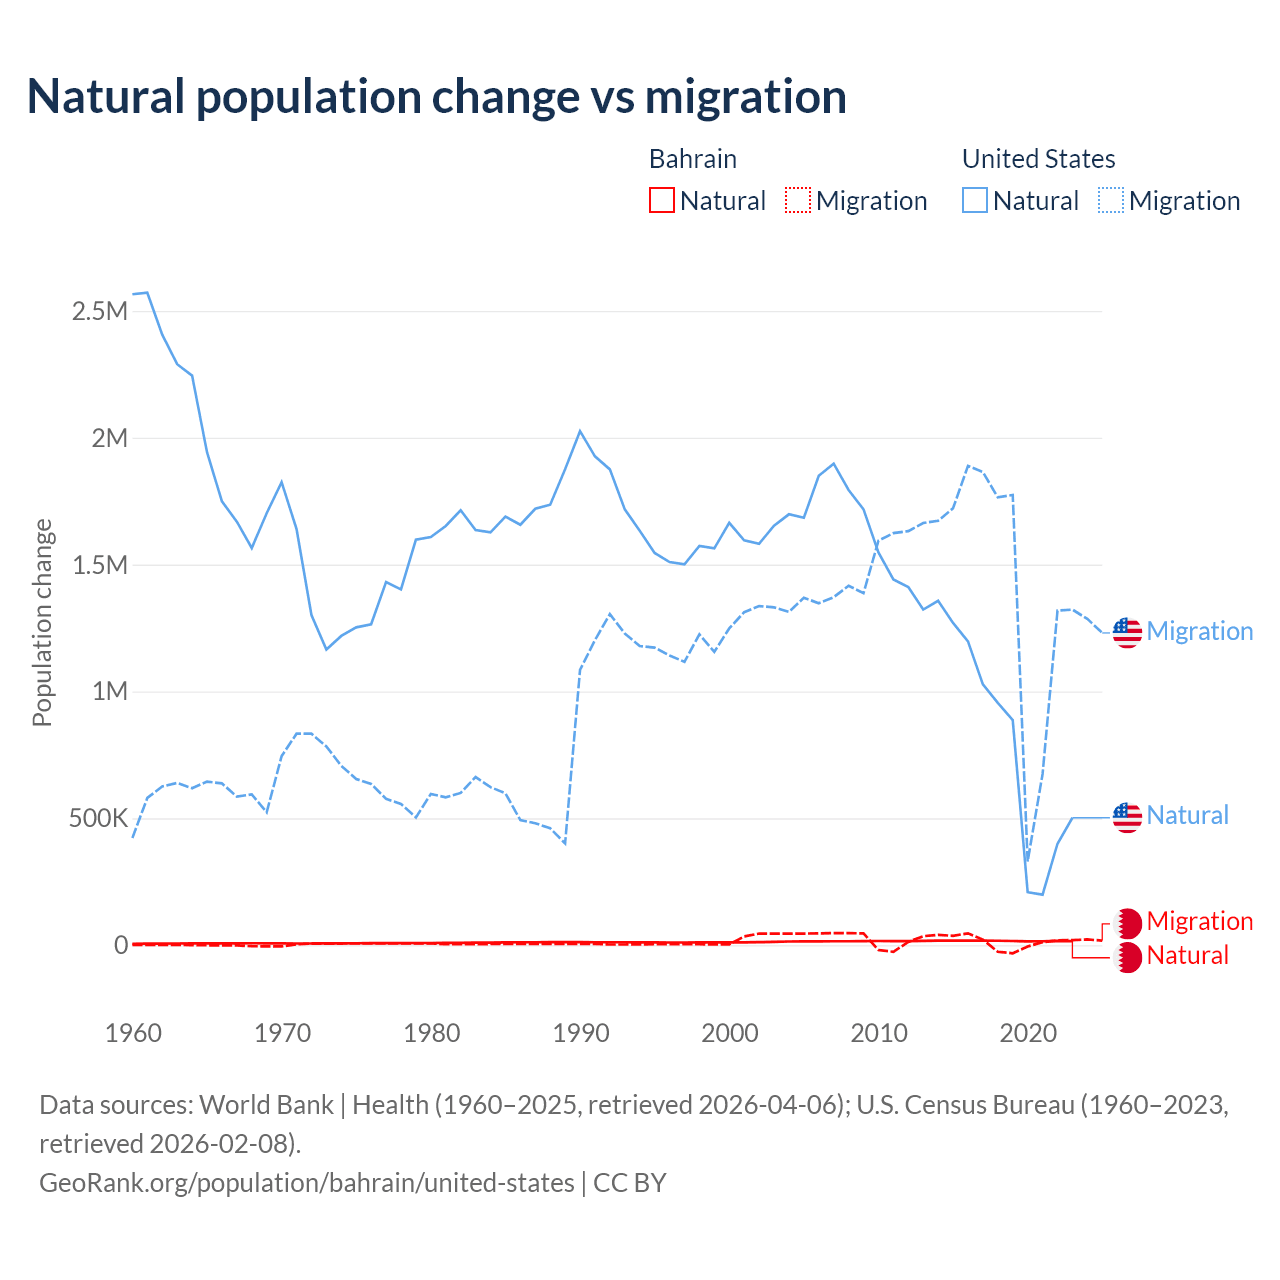
Natural population change vs migration
| Year | Population change | |||
|---|---|---|---|---|
|
Bahrain
|
United States
|
|||
| Natural | Migration | Natural | Migration | |
| 2025 | - | 18,128 | - | 1,230,663 |
| 2024 | 15,606 | 22,699 | 544,178 | 1,286,132 |
| 2023 | 16,356 | 20,002 | 502,372 | 1,322,668 |
| 2022 | 17,058 | 18,975 | 399,926 | 1,319,009 |
| 2021 | 15,401 | 11,882 | 199,137 | 674,787 |
| 2020 | 15,056 | -5,048 | 208,862 | 329,769 |
| 2019 | 16,639 | -31,967 | 887,476 | 1,774,500 |
| 2018 | 17,445 | -25,978 | 955,022 | 1,764,961 |
| 2017 | 18,140 | 21,958 | 1,028,037 | 1,864,738 |
| 2016 | 17,996 | 46,833 | 1,197,627 | 1,889,129 |
| 2015 | 18,193 | 36,809 | 1,270,126 | 1,722,127 |
| 2014 | 17,826 | 40,815 | 1,357,281 | 1,672,598 |
| 2013 | 17,044 | 35,574 | 1,322,711 | 1,663,885 |
| 2012 | 16,219 | 12,801 | 1,411,822 | 1,632,007 |
| 2011 | 15,990 | -26,107 | 1,441,697 | 1,624,033 |
| 2010 | 16,474 | -19,329 | 1,548,182 | 1,594,453 |
| 2009 | 15,795 | 46,467 | 1,717,920 | 1,387,306 |
| 2008 | 15,541 | 47,674 | 1,794,154 | 1,416,841 |
| 2007 | 15,393 | 47,500 | 1,897,757 | 1,371,353 |
| 2006 | 15,248 | 46,615 | 1,849,955 | 1,347,750 |
| 2005 | 15,196 | 45,682 | 1,684,445 | 1,369,224 |
| 2004 | 14,454 | 45,413 | 1,698,271 | 1,313,467 |
| 2003 | 13,243 | 45,571 | 1,653,615 | 1,331,376 |
| 2002 | 11,875 | 45,952 | 1,581,938 | 1,336,518 |
| 2001 | 10,948 | 34,371 | 1,595,826 | 1,312,455 |
| 2000 | 11,339 | 2,886 | 1,664,758 | 1,248,392 |
| 1999 | 11,397 | 3,130 | 1,564,050 | 1,156,311 |
| 1998 | 10,970 | 3,733 | 1,573,857 | 1,225,134 |
| 1997 | 10,739 | 4,036 | 1,501,014 | 1,116,922 |
| 1996 | 10,607 | 4,162 | 1,510,137 | 1,141,648 |
| 1995 | 10,824 | 3,842 | 1,546,031 | 1,173,016 |
| 1994 | 11,133 | 3,387 | 1,633,302 | 1,179,309 |
| 1993 | 11,521 | 2,850 | 1,717,685 | 1,228,478 |
| 1992 | 11,577 | 2,768 | 1,875,328 | 1,304,880 |
| 1991 | 11,491 | 4,562 | 1,926,543 | 1,202,426 |
| 1990 | 12,337 | 5,090 | 2,026,068 | 1,084,720 |
| 1989 | 12,293 | 5,220 | 1,875,826 | 400,998 |
| 1988 | 11,995 | 5,294 | 1,735,943 | 460,778 |
| 1987 | 11,709 | 5,152 | 1,720,252 | 480,815 |
| 1986 | 11,455 | 4,822 | 1,656,917 | 493,082 |
| 1985 | 10,924 | 4,657 | 1,689,258 | 598,777 |
| 1984 | 10,269 | 4,557 | 1,627,192 | 622,793 |
| 1983 | 9,821 | 4,252 | 1,636,544 | 662,840 |
| 1982 | 9,396 | 3,980 | 1,714,317 | 600,149 |
| 1981 | 9,020 | 4,523 | 1,652,153 | 583,070 |
| 1980 | 8,802 | 6,741 | 1,608,450 | 595,916 |
| 1979 | 8,587 | 6,908 | 1,597,894 | 503,559 |
| 1978 | 8,358 | 6,974 | 1,402,283 | 556,521 |
| 1977 | 8,093 | 7,017 | 1,431,556 | 577,060 |
| 1976 | 7,818 | 6,993 | 1,264,604 | 635,590 |
| 1975 | 7,535 | 6,900 | 1,252,644 | 655,078 |
| 1974 | 7,265 | 6,711 | 1,218,968 | 706,978 |
| 1973 | 7,012 | 6,450 | 1,165,499 | 783,163 |
| 1972 | 6,763 | 6,190 | 1,301,355 | 833,543 |
| 1971 | 6,650 | 3,159 | 1,640,519 | 833,549 |
| 1970 | 6,973 | -4,939 | 1,824,965 | 744,902 |
| 1969 | 7,277 | -4,638 | 1,702,487 | 523,740 |
| 1968 | 7,584 | -3,952 | 1,565,507 | 594,514 |
| 1967 | 7,492 | -829 | 1,669,181 | 585,410 |
| 1966 | 7,342 | -718 | 1,749,387 | 637,692 |
| 1965 | 7,148 | -415 | 1,943,030 | 644,902 |
| 1964 | 6,873 | 491 | 2,245,099 | 618,635 |
| 1963 | 6,557 | 714 | 2,289,826 | 639,495 |
| 1962 | 6,232 | 810 | 2,406,337 | 625,617 |
| 1961 | 5,882 | 1,076 | 2,571,681 | 580,333 |
| 1960 | 5,513 | 1,266 | 2,565,530 | 422,708 |
Data sources: World Bank | Health (1960–2025, retrieved 2026-07-08); U.S. Census Bureau (1960–2024, retrieved 2026-07-08).
GeoRank.org/population/bahrain/united-states | CC BY
Over the last 10 years, 59.1% of the population change in Bahrain is from natural causes (a gain of 167,890 people) and 40.9% is from migration (a gain of 116,165 people). In the United States 34% is from natural causes (a gain of 7,192,763 people) and 66% is from migration (a gain of 13,947,820 people).
As of 2024, 840,202 residents or 52.3% of the population were not native-born in Bahrain, compared to 52,375,047 people or 15.2% in the United States.
Biggest cities by population
|
Bahrain
|
|
|---|---|
| City | Population |
| Manama | 298K |
| Riffa | 115K |
| Isa Town | 61.3K |
|
United States
|
|
|---|---|
| City | Population |
| New York | 8.8M |
| Los Angeles | 3.9M |
| Chicago | 2.75M |
| Houston | 2.3M |
| Phoenix | 1.61M |
| Philadelphia | 1.6M |
| San Antonio | 1.43M |
| San Diego | 1.39M |
| Dallas | 1.3M |
| San Jose | 1.01M |
Compare countries by 7 more topics
Population differences between Bahrain and the United States
|
Bahrain
|
United States
|
|
|---|---|---|
| Life expectancy | 81.7 years | 79.8 years |
| Average age | 33.4 years | 40.4 years |
| Median age | 34.3 years | 39.5 years |
| Male:Female ratio | 62:38 | 50.2:49.8 |
| Fertility rate | 1.81 births per woman | 1.63 births per woman |
| Population density | 5,290 ppl/mi² | 97.3 ppl/mi² |
Population map with other countries
Data sources: World Bank | Health (1960–2025, retrieved 2026-07-08); United Nations | World Population Prospects (1960–2026, retrieved 2026-07-08); U.S. Census Bureau (1960–2025, retrieved 2026-07-08); Central Intelligence Agency (CIA) (2000–2019, retrieved 2026-07-08).
GeoRank.org/population/bahrain/united-states | CC BY
Help us show the world through your eyes
Share a photo of your city and help others discover what it looks like to live there. Your contribution makes our data come alive.
Data sources:
- World Bank | Health (1960–2025, retrieved 2026-07-08)
- United Nations | World Population Prospects (1960–2100, retrieved 2026-07-08)
- U.S. Census Bureau (1960–2025, retrieved 2026-07-08)
- Central Intelligence Agency (CIA) (2000–2019, retrieved 2026-07-08)
- Wikidata (2026, retrieved 2026-07-08)
Creative Commons Attribution (CC BY) — you’re free to copy, share, remix, adapt, and use even commercially as long as you give appropriate credit and clearly indicate if you made changes. Other sources may be subject to different license terms.