The latest officially reported population of Turkey was 85,878,556 in 2025 vs 1,000 people in the Vatican in 2019. In 2026, based on the adjusted UN estimation, the current Turkey's population is 86,225,430 people compared to 939 in the Vatican.
Population statistics:
- Turkey's population is 91,827 times bigger than the Vatican's.
- Turkey is ranked the 18th most populous country in the world, while the Vatican is the 197th.
- The countries together account for 1.04% of the world: 1.04% for Turkey vs 0.00001% for the Vatican.
- For the last 10 years, Turkey has had an average growth rate of +0.98% per year vs +1.9% in the Vatican.
- Since 2006, the population of Turkey has increased from 70M people to 86.2M (23.1% growth), while the Vatican has grown from 932 to 939 (0.75% growth).
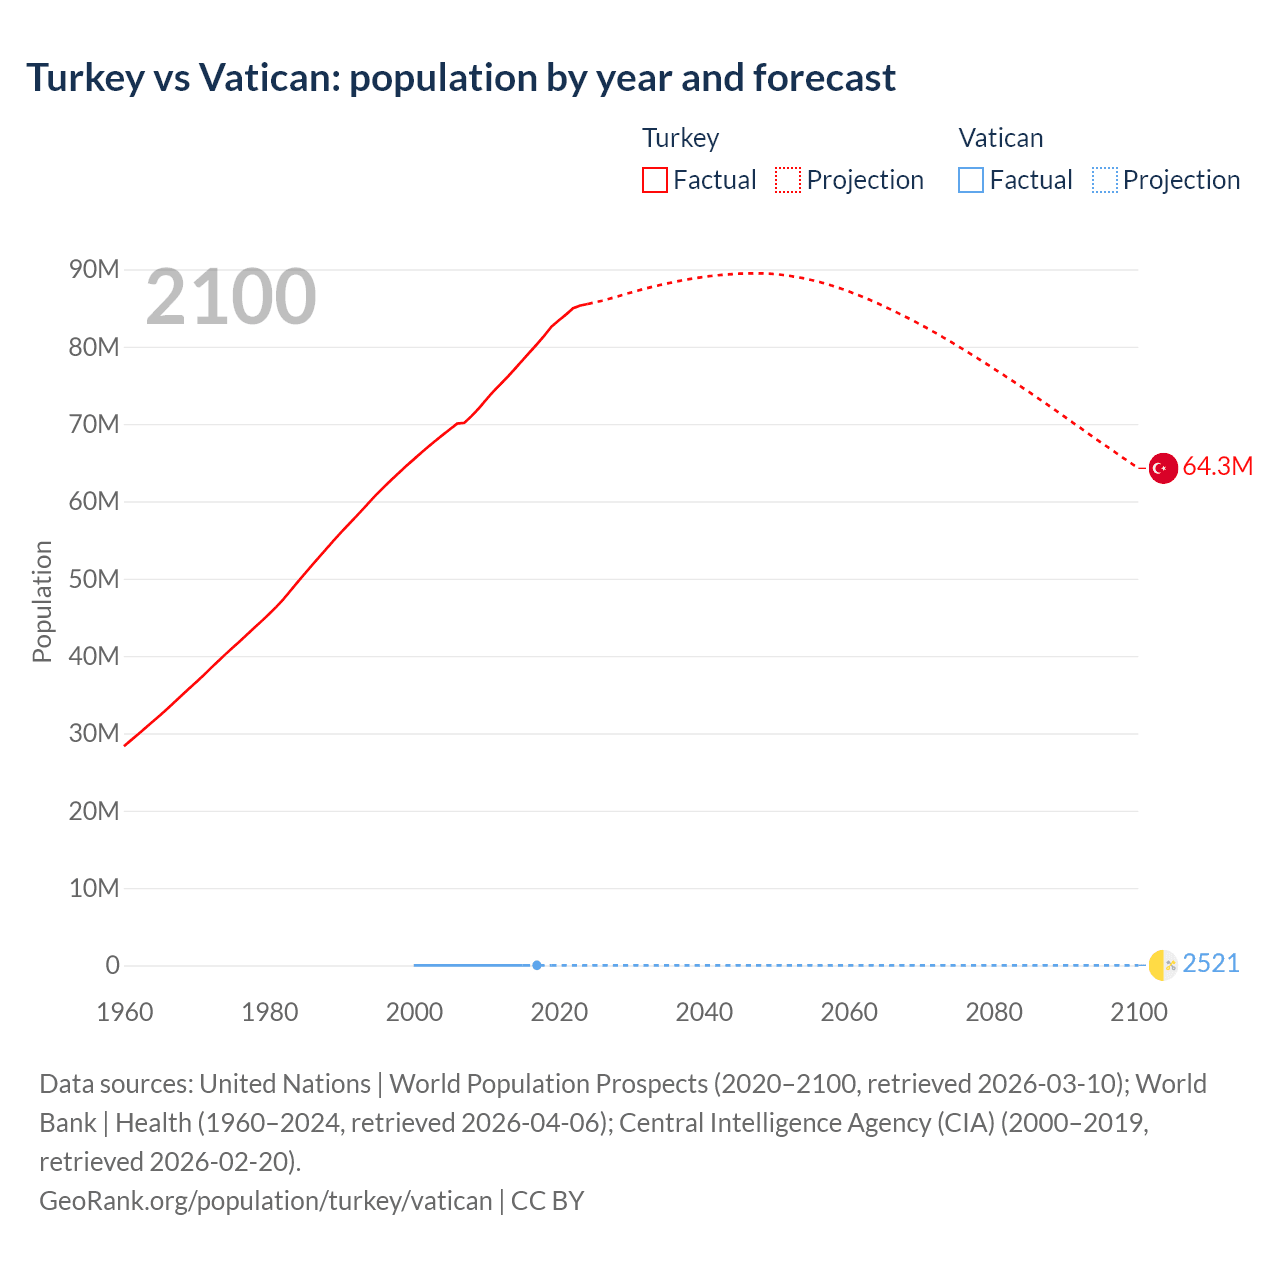
Turkey vs Vatican: population by year and forecast
| Year | Population | |
|---|---|---|
 Turkey
|
 Vatican
|
|
| 2100 | 64,394,191 | 2,521 |
| 2099 | 65,045,868 | 2,506 |
| 2098 | 65,690,351 | 2,497 |
| 2097 | 66,342,622 | 2,482 |
| 2096 | 66,990,674 | 2,469 |
| 2095 | 67,642,188 | 2,452 |
| 2094 | 68,296,562 | 2,435 |
| 2093 | 68,963,773 | 2,421 |
| 2092 | 69,625,957 | 2,400 |
| 2091 | 70,290,255 | 2,384 |
| 2090 | 70,960,483 | 2,359 |
| 2089 | 71,623,547 | 2,337 |
| 2088 | 72,281,102 | 2,319 |
| 2087 | 72,928,397 | 2,291 |
| 2086 | 73,576,610 | 2,269 |
| 2085 | 74,223,570 | 2,248 |
| 2084 | 74,853,312 | 2,217 |
| 2083 | 75,483,067 | 2,183 |
| 2082 | 76,111,533 | 2,159 |
| 2081 | 76,726,689 | 2,129 |
| 2080 | 77,339,541 | 2,105 |
| 2079 | 77,938,889 | 2,089 |
| 2078 | 78,532,577 | 2,068 |
| 2077 | 79,120,573 | 2,050 |
| 2076 | 79,705,459 | 2,025 |
| 2075 | 80,277,544 | 2,001 |
| 2074 | 80,848,141 | 1,970 |
| 2073 | 81,396,237 | 1,944 |
| 2072 | 81,938,080 | 1,912 |
| 2071 | 82,465,112 | 1,866 |
| 2070 | 82,981,973 | 1,829 |
| 2069 | 83,480,362 | 1,795 |
| 2068 | 83,963,140 | 1,777 |
| 2067 | 84,428,242 | 1,755 |
| 2066 | 84,886,666 | 1,729 |
| 2065 | 85,336,225 | 1,701 |
| 2064 | 85,771,285 | 1,679 |
| 2063 | 86,187,013 | 1,651 |
| 2062 | 86,587,114 | 1,623 |
| 2061 | 86,962,577 | 1,595 |
| 2060 | 87,319,314 | 1,556 |
| 2059 | 87,663,392 | 1,530 |
| 2058 | 87,973,789 | 1,512 |
| 2057 | 88,264,809 | 1,493 |
| 2056 | 88,534,755 | 1,469 |
| 2055 | 88,764,080 | 1,441 |
| 2054 | 88,972,362 | 1,419 |
| 2053 | 89,151,673 | 1,382 |
| 2052 | 89,310,785 | 1,358 |
| 2051 | 89,437,110 | 1,335 |
| 2050 | 89,541,520 | 1,311 |
| 2049 | 89,614,107 | 1,283 |
| 2048 | 89,651,068 | 1,256 |
| 2047 | 89,659,415 | 1,237 |
| 2046 | 89,634,354 | 1,215 |
| 2045 | 89,608,012 | 1,192 |
| 2044 | 89,557,421 | 1,174 |
| 2043 | 89,493,042 | 1,152 |
| 2042 | 89,404,193 | 1,135 |
| 2041 | 89,303,546 | 1,105 |
| 2040 | 89,187,952 | 1,070 |
| 2039 | 89,051,669 | 1,033 |
| 2038 | 88,901,719 | 1,001 |
| 2037 | 88,727,471 | 996 |
| 2036 | 88,537,927 | 1,001 |
| 2035 | 88,343,153 | 988 |
| 2034 | 88,139,515 | 988 |
| 2033 | 87,918,397 | 974 |
| 2032 | 87,687,495 | 964 |
| 2031 | 87,437,150 | 977 |
| 2030 | 87,166,904 | 979 |
| 2029 | 86,903,490 | 985 |
| 2028 | 86,627,469 | 983 |
| 2027 | 86,350,539 | 946 |
| 2026 | 86,093,293 | 933 |
| 2025 | 85,878,556 | 927 |
| 2024 | 85,518,661 | 910 |
| 2023 | 85,325,965 | 927 |
| 2022 | 84,979,913 | 951 |
| 2021 | 84,147,318 | 972 |
| 2020 | 83,384,680 | 987 |
| 2019 | 82,579,440 | 1,000 |
| 2018 | 81,407,204 | - |
| 2017 | 80,312,698 | 1,000 |
| 2016 | 79,277,962 | - |
| 2015 | 78,218,479 | 1,000 |
| 2014 | 77,181,884 | 842 |
| 2013 | 76,147,624 | 839 |
| 2012 | 75,175,827 | 836 |
| 2011 | 74,223,629 | 832 |
| 2010 | 73,142,150 | 829 |
| 2009 | 72,039,206 | 826 |
| 2008 | 71,051,678 | 824 |
| 2007 | 70,158,112 | 821 |
| 2006 | 70,045,349 | 932 |
| 2005 | 69,329,557 | 921 |
| 2004 | 68,592,617 | 921 |
| 2003 | 67,831,730 | 911 |
| 2002 | 67,048,795 | 900 |
| 2001 | 66,245,128 | 890 |
| 2000 | 65,425,961 | 880 |
| 1999 | 64,591,923 | - |
| 1998 | 63,734,383 | - |
| 1997 | 62,852,966 | - |
| 1996 | 61,951,134 | - |
| 1995 | 61,024,503 | - |
| 1994 | 60,033,836 | - |
| 1993 | 58,999,167 | - |
| 1992 | 57,990,118 | - |
| 1991 | 57,009,887 | - |
| 1990 | 56,015,628 | - |
| 1989 | 54,976,723 | - |
| 1988 | 53,909,626 | - |
| 1987 | 52,843,670 | - |
| 1986 | 51,777,772 | - |
| 1985 | 50,687,115 | - |
| 1984 | 49,574,069 | - |
| 1983 | 48,447,410 | - |
| 1982 | 47,322,096 | - |
| 1981 | 46,321,190 | - |
| 1980 | 45,408,815 | - |
| 1979 | 44,510,429 | - |
| 1978 | 43,645,306 | - |
| 1977 | 42,773,298 | - |
| 1976 | 41,899,984 | - |
| 1975 | 41,053,126 | - |
| 1974 | 40,210,234 | - |
| 1973 | 39,329,533 | - |
| 1972 | 38,430,221 | - |
| 1971 | 37,518,611 | - |
| 1970 | 36,638,465 | - |
| 1969 | 35,787,774 | - |
| 1968 | 34,921,684 | - |
| 1967 | 34,050,421 | - |
| 1966 | 33,177,672 | - |
| 1965 | 32,345,220 | - |
| 1964 | 31,543,072 | - |
| 1963 | 30,726,841 | - |
| 1962 | 29,916,147 | - |
| 1961 | 29,119,238 | - |
| 1960 | 28,329,898 | - |
Data sources: United Nations | World Population Prospects (2020–2100, retrieved 2026-07-08); World Bank | Health (1960–2025, retrieved 2026-07-08); Central Intelligence Agency (CIA) (2000–2019, retrieved 2026-07-08).
GeoRank.org/population/turkey/vatican | CC BY 
From 2006 to 2016, the population of Turkey increased by 9,232,613 people (a 13.2% growth), while the Vatican gained 68 people (a 7.3% growth).
For the next 10 years, from 2016 to 2026, Turkey gained 6,947,468 people (a 8.76% growth), while the Vatican's population decreased by 61 people (a 6.1% decline).
Turkey was ranked 18th most populous country in 2006 and is still 18th in 2026. The Vatican was ranked 197th in 2006 and still ranked 197th now.
The UN's World Population Prospects forecasts that in 24 years (in 2050) Turkey's population will grow by 3.85% to 89,541,520 people with a rank change from 18th to 19th. The population of the Vatican will increase by 39.6% to 1,311 people and will still be ranked 197th.
Turkey is projected to reach its peak in 2047 at 89.7M people compared to the peak of 2.52K people in 2100 for the Vatican.
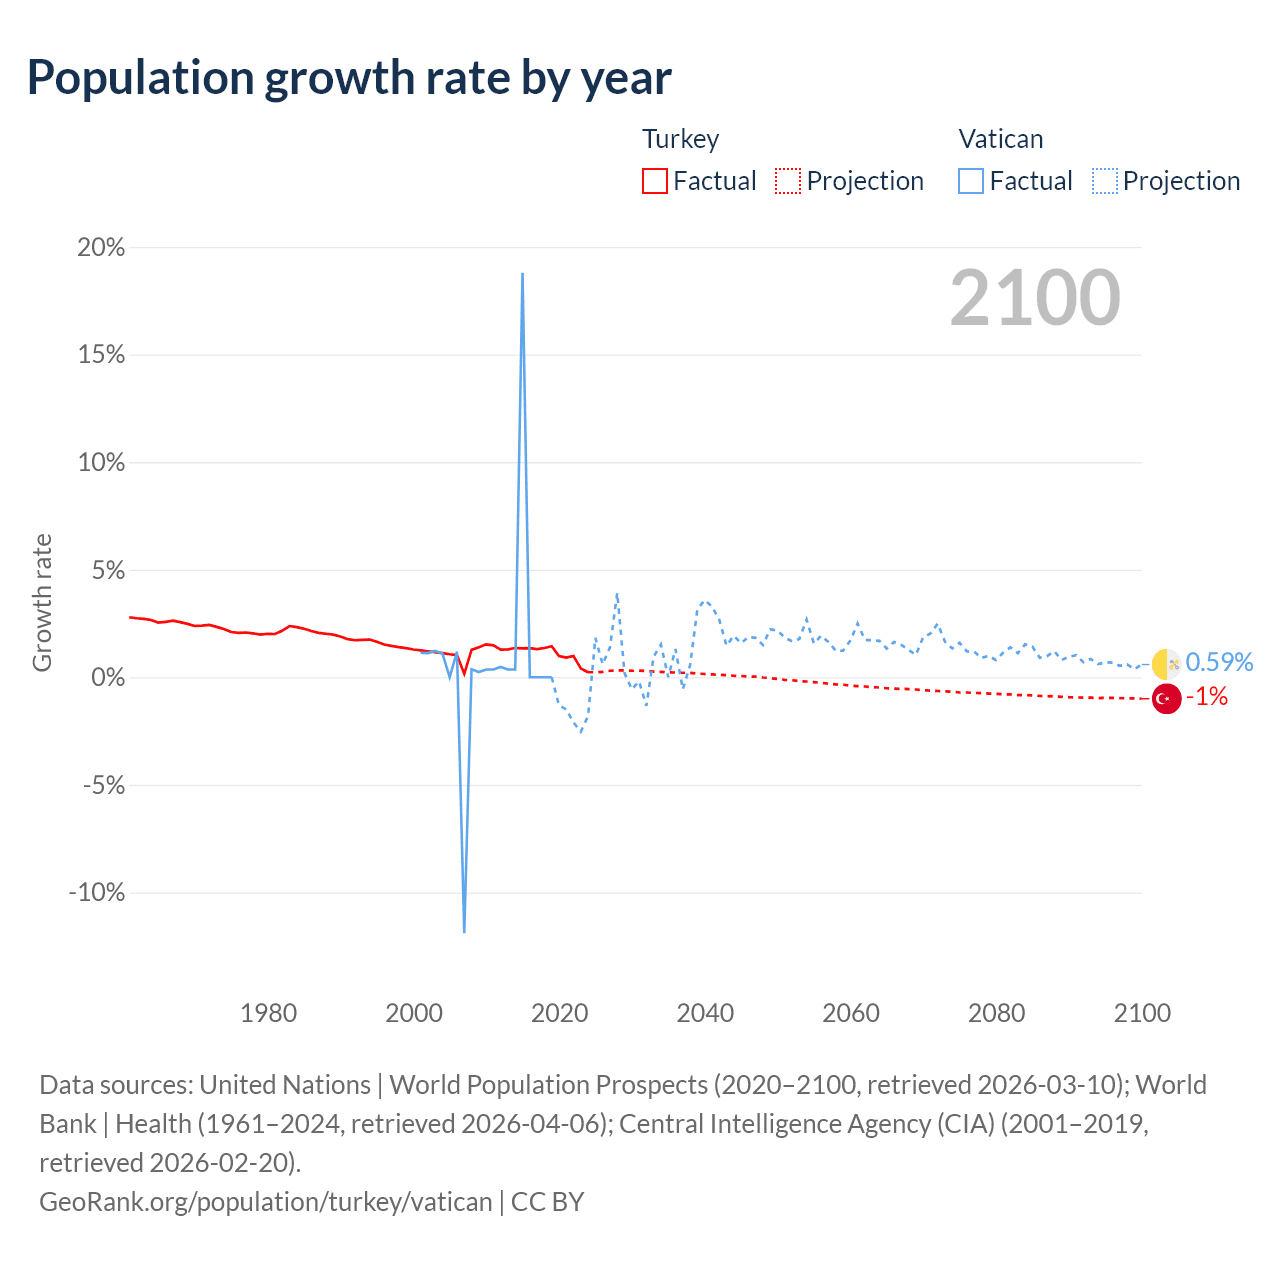
Population growth rate by year
| Year | Growth rate | |
|---|---|---|
|
Turkey
|
Vatican
|
|
| 2100 | -1% | 0.59% |
| 2099 | -0.98% | 0.37% |
| 2098 | -0.98% | 0.6% |
| 2097 | -0.97% | 0.53% |
| 2096 | -0.96% | 0.68% |
| 2095 | -0.96% | 0.69% |
| 2094 | -0.97% | 0.61% |
| 2093 | -0.95% | 0.85% |
| 2092 | -0.95% | 0.7% |
| 2091 | -0.94% | 1.02% |
| 2090 | -0.93% | 0.95% |
| 2089 | -0.91% | 0.8% |
| 2088 | -0.89% | 1.21% |
| 2087 | -0.88% | 0.98% |
| 2086 | -0.87% | 0.91% |
| 2085 | -0.84% | 1.42% |
| 2084 | -0.83% | 1.53% |
| 2083 | -0.83% | 1.12% |
| 2082 | -0.8% | 1.39% |
| 2081 | -0.79% | 1.15% |
| 2080 | -0.77% | 0.8% |
| 2079 | -0.76% | 0.99% |
| 2078 | -0.74% | 0.9% |
| 2077 | -0.73% | 1.19% |
| 2076 | -0.71% | 1.2% |
| 2075 | -0.71% | 1.6% |
| 2074 | -0.67% | 1.34% |
| 2073 | -0.66% | 1.65% |
| 2072 | -0.64% | 2.49% |
| 2071 | -0.62% | 2.03% |
| 2070 | -0.6% | 1.86% |
| 2069 | -0.57% | 1.04% |
| 2068 | -0.55% | 1.27% |
| 2067 | -0.54% | 1.5% |
| 2066 | -0.53% | 1.64% |
| 2065 | -0.51% | 1.33% |
| 2064 | -0.48% | 1.69% |
| 2063 | -0.46% | 1.71% |
| 2062 | -0.43% | 1.74% |
| 2061 | -0.41% | 2.5% |
| 2060 | -0.39% | 1.7% |
| 2059 | -0.35% | 1.23% |
| 2058 | -0.33% | 1.24% |
| 2057 | -0.3% | 1.64% |
| 2056 | -0.26% | 1.93% |
| 2055 | -0.23% | 1.57% |
| 2054 | -0.2% | 2.68% |
| 2053 | -0.18% | 1.78% |
| 2052 | -0.14% | 1.67% |
| 2051 | -0.12% | 1.84% |
| 2050 | -0.08% | 2.17% |
| 2049 | -0.04% | 2.22% |
| 2048 | -0.009% | 1.5% |
| 2047 | 0.03% | 1.83% |
| 2046 | 0.03% | 1.87% |
| 2045 | 0.06% | 1.58% |
| 2044 | 0.07% | 1.93% |
| 2043 | 0.1% | 1.47% |
| 2042 | 0.11% | 2.68% |
| 2041 | 0.13% | 3.29% |
| 2040 | 0.15% | 3.59% |
| 2039 | 0.17% | 3.15% |
| 2038 | 0.2% | 0.56% |
| 2037 | 0.21% | -0.56% |
| 2036 | 0.22% | 1.31% |
| 2035 | 0.23% | 0% |
| 2034 | 0.25% | 1.52% |
| 2033 | 0.26% | 0.96% |
| 2032 | 0.29% | -1.33% |
| 2031 | 0.31% | -0.19% |
| 2030 | 0.3% | -0.56% |
| 2029 | 0.32% | 0.19% |
| 2028 | 0.32% | 3.92% |
| 2027 | 0.3% | 1.39% |
| 2026 | 0.25% | 0.6% |
| 2025 | 0.42% | 1.83% |
| 2024 | 0.23% | -1.8% |
| 2023 | 0.41% | -2.53% |
| 2022 | 0.99% | -2.1% |
| 2021 | 0.91% | -1.5% |
| 2020 | 0.98% | -1.3% |
| 2019 | 1.44% | 0% |
| 2018 | 1.36% | 0% |
| 2017 | 1.31% | 0% |
| 2016 | 1.35% | 0% |
| 2015 | 1.34% | 18.8% |
| 2014 | 1.36% | 0.36% |
| 2013 | 1.29% | 0.36% |
| 2012 | 1.28% | 0.48% |
| 2011 | 1.48% | 0.36% |
| 2010 | 1.53% | 0.36% |
| 2009 | 1.39% | 0.24% |
| 2008 | 1.27% | 0.37% |
| 2007 | 0.16% | -11.9% |
| 2006 | 1.03% | 1.19% |
| 2005 | 1.07% | 0% |
| 2004 | 1.12% | 1.1% |
| 2003 | 1.17% | 1.22% |
| 2002 | 1.21% | 1.12% |
| 2001 | 1.25% | 1.14% |
| 2000 | 1.29% | - |
| 1999 | 1.35% | - |
| 1998 | 1.4% | - |
| 1997 | 1.46% | - |
| 1996 | 1.52% | - |
| 1995 | 1.65% | - |
| 1994 | 1.75% | - |
| 1993 | 1.74% | - |
| 1992 | 1.72% | - |
| 1991 | 1.77% | - |
| 1990 | 1.89% | - |
| 1989 | 1.98% | - |
| 1988 | 2.02% | - |
| 1987 | 2.06% | - |
| 1986 | 2.15% | - |
| 1985 | 2.25% | - |
| 1984 | 2.33% | - |
| 1983 | 2.38% | - |
| 1982 | 2.16% | - |
| 1981 | 2.01% | - |
| 1980 | 2.02% | - |
| 1979 | 1.98% | - |
| 1978 | 2.04% | - |
| 1977 | 2.08% | - |
| 1976 | 2.06% | - |
| 1975 | 2.1% | - |
| 1974 | 2.24% | - |
| 1973 | 2.34% | - |
| 1972 | 2.43% | - |
| 1971 | 2.4% | - |
| 1970 | 2.38% | - |
| 1969 | 2.48% | - |
| 1968 | 2.56% | - |
| 1967 | 2.63% | - |
| 1966 | 2.57% | - |
| 1965 | 2.54% | - |
| 1964 | 2.66% | - |
| 1963 | 2.71% | - |
| 1962 | 2.74% | - |
| 1961 | 2.79% | - |
Data sources: United Nations | World Population Prospects (2020–2100, retrieved 2026-07-08); World Bank | Health (1961–2025, retrieved 2026-07-08); Central Intelligence Agency (CIA) (2001–2019, retrieved 2026-07-08).
GeoRank.org/population/turkey/vatican | CC BY
In 2025, the population of Turkey grew by 0.42%, while the Vatican's population declined by 0%.
Live population counters
|
Turkey
|
Vatican
|
|
|---|---|---|
| Current population |
86225430
|
939
|
| Population rank | 18/197 | 197/197 |
| Percent of world population | 1.04% | 0.00001% |
| One net population change |
1.46 minutes
|
1 month
|
| One birth every |
33.5 seconds
|
n/a |
| One death every |
1.08 minutes
|
n/a |
| Daily growth/decline | +986 | +0 |
| Annual growth/decline | +359,895 | +0 |
| Annual growth/decline rate | +0.42% | +0% |
| Population growth rate rank | 138/197 | 158/197 |
| One migration net change every |
2.04 minutes
|
n/a |
| Annual migration change | -258,205 | n/a |
| Net migration rank | 188/196 | |
| Foreign-born residents | 7,083,501 | n/a |
| Foreign-born residents rank | 11/195 | |
| Foreign-born share of population | 8.1% | n/a |
| Foreign-born share rank | 75/195 |
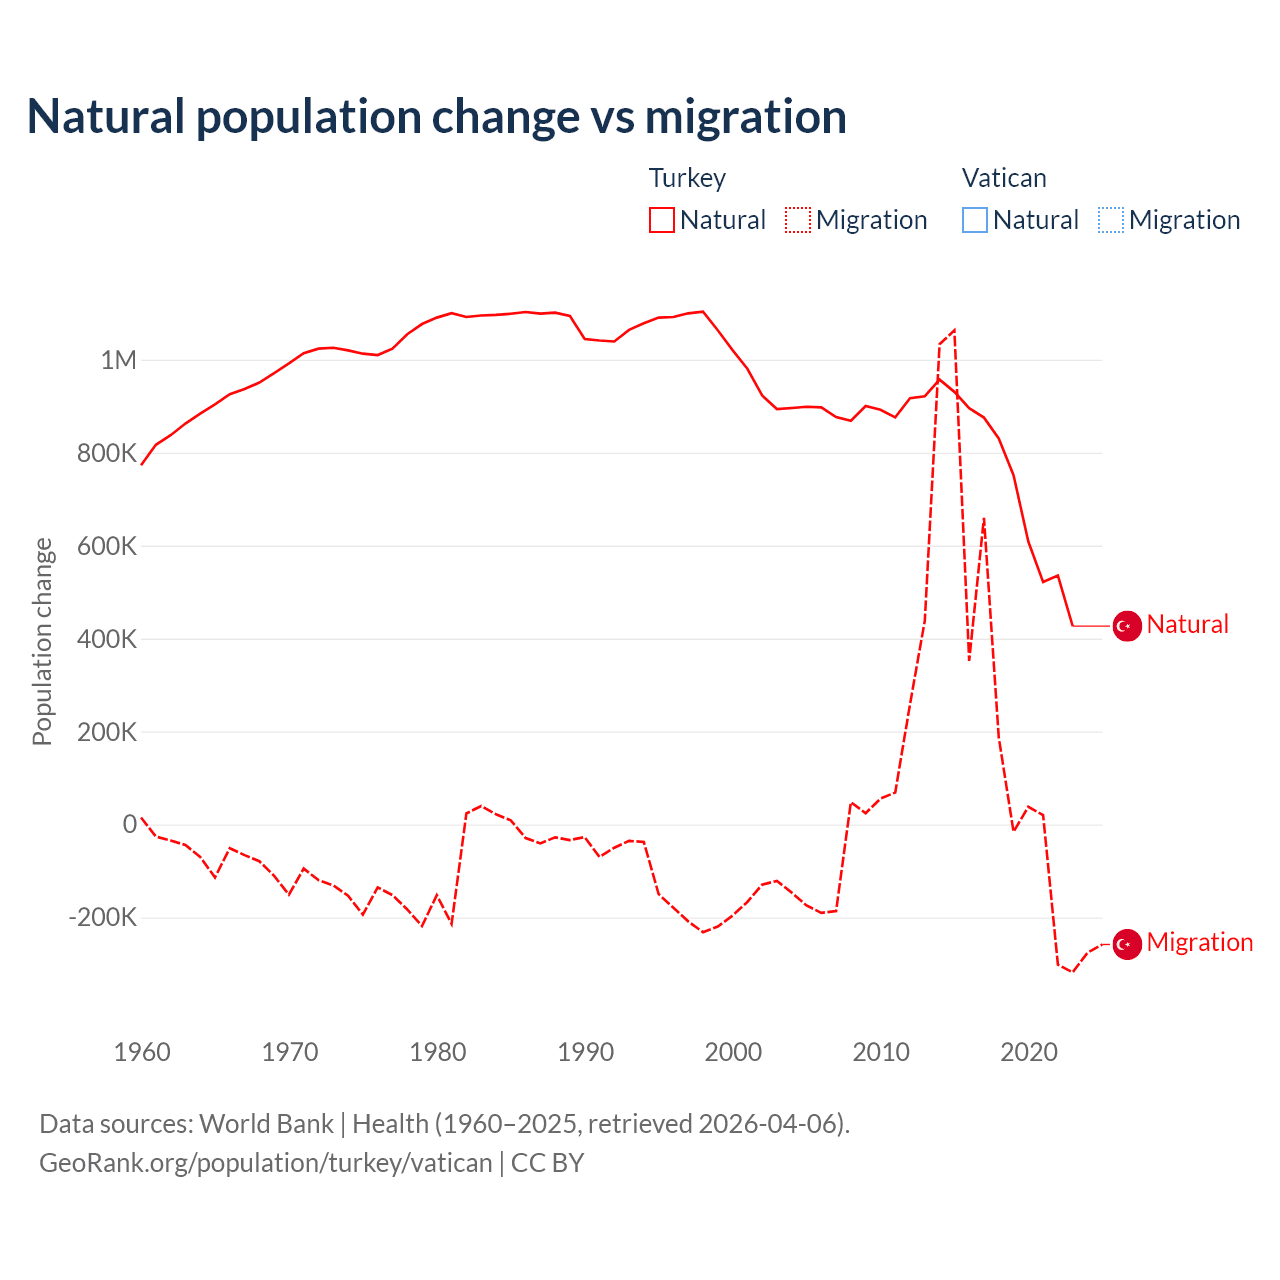
Natural population change vs migration
| Year | Population change | |||
|---|---|---|---|---|
|
Turkey
|
Vatican
|
|||
| Natural | Migration | Natural | Migration | |
| 2025 | - | -258,205 | - | - |
| 2024 | 453,249 | -275,952 | - | - |
| 2023 | 426,630 | -318,070 | - | - |
| 2022 | 535,373 | -301,544 | - | - |
| 2021 | 521,713 | 20,283 | - | - |
| 2020 | 608,708 | 37,934 | - | - |
| 2019 | 751,472 | -15,690 | - | - |
| 2018 | 830,353 | 187,570 | - | - |
| 2017 | 875,408 | 659,846 | - | - |
| 2016 | 895,841 | 352,063 | - | - |
| 2015 | 930,799 | 1,063,140 | - | - |
| 2014 | 957,055 | 1,033,384 | - | - |
| 2013 | 921,386 | 438,618 | - | - |
| 2012 | 917,145 | 258,623 | - | - |
| 2011 | 875,839 | 68,849 | - | - |
| 2010 | 892,334 | 55,532 | - | - |
| 2009 | 900,491 | 24,276 | - | - |
| 2008 | 868,749 | 47,915 | - | - |
| 2007 | 876,626 | -186,402 | - | - |
| 2006 | 897,351 | -190,194 | - | - |
| 2005 | 898,650 | -174,177 | - | - |
| 2004 | 896,025 | -146,574 | - | - |
| 2003 | 893,683 | -121,383 | - | - |
| 2002 | 922,927 | -129,444 | - | - |
| 2001 | 980,560 | -166,759 | - | - |
| 2000 | 1,020,515 | -195,996 | - | - |
| 1999 | 1,063,312 | -219,778 | - | - |
| 1998 | 1,103,242 | -231,744 | - | - |
| 1997 | 1,099,738 | -208,465 | - | - |
| 1996 | 1,091,827 | -179,423 | - | - |
| 1995 | 1,090,630 | -149,737 | - | - |
| 1994 | 1,078,208 | -37,762 | - | - |
| 1993 | 1,064,168 | -35,245 | - | - |
| 1992 | 1,039,125 | -49,923 | - | - |
| 1991 | 1,041,229 | -69,982 | - | - |
| 1990 | 1,044,467 | -27,193 | - | - |
| 1989 | 1,094,036 | -33,519 | - | - |
| 1988 | 1,101,266 | -27,659 | - | - |
| 1987 | 1,099,042 | -40,772 | - | - |
| 1986 | 1,102,660 | -29,134 | - | - |
| 1985 | 1,098,846 | 8,960 | - | - |
| 1984 | 1,096,529 | 21,787 | - | - |
| 1983 | 1,095,106 | 39,871 | - | - |
| 1982 | 1,091,863 | 23,728 | - | - |
| 1981 | 1,100,082 | -213,889 | - | - |
| 1980 | 1,090,538 | -151,969 | - | - |
| 1979 | 1,076,707 | -218,509 | - | - |
| 1978 | 1,054,863 | -182,818 | - | - |
| 1977 | 1,023,779 | -151,825 | - | - |
| 1976 | 1,009,999 | -135,377 | - | - |
| 1975 | 1,012,904 | -193,829 | - | - |
| 1974 | 1,020,053 | -153,311 | - | - |
| 1973 | 1,025,675 | -130,985 | - | - |
| 1972 | 1,023,781 | -119,850 | - | - |
| 1971 | 1,014,165 | -94,891 | - | - |
| 1970 | 991,950 | -150,924 | - | - |
| 1969 | 970,958 | -110,578 | - | - |
| 1968 | 950,778 | -78,973 | - | - |
| 1967 | 936,727 | -65,993 | - | - |
| 1966 | 925,790 | -50,999 | - | - |
| 1965 | 904,016 | -113,911 | - | - |
| 1964 | 884,152 | -69,978 | - | - |
| 1963 | 862,626 | -44,317 | - | - |
| 1962 | 837,473 | -34,353 | - | - |
| 1961 | 816,911 | -26,187 | - | - |
| 1960 | 773,009 | 14,948 | - | - |
Data sources: World Bank | Health (1960–2025, retrieved 2026-07-08).
GeoRank.org/population/turkey/vatican | CC BY
Biggest cities by population
Compare countries by 7 more topics
Population differences between Turkey and the Vatican
|
Turkey
|
Vatican
|
|
|---|---|---|
| Life expectancy | 78.4 years | 83.4 years |
| Average age | 35.7 years | n/a |
| Median age | 34.5 years | n/a |
| Male:Female ratio | 49.9:50.1 | n/a |
| Fertility rate | 1.48 births per woman | n/a |
| Population density | 289.7 ppl/mi² | 5,493 ppl/mi² |
Population map with other countries
Data sources: World Bank | Health (1960–2025, retrieved 2026-07-08); United Nations | World Population Prospects (1960–2026, retrieved 2026-07-08); U.S. Census Bureau (1960–2025, retrieved 2026-07-08); Central Intelligence Agency (CIA) (2000–2019, retrieved 2026-07-08).
GeoRank.org/population/turkey/vatican | CC BY
Help us show the world through your eyes
Share a photo of your city and help others discover what it looks like to live there. Your contribution makes our data come alive.
Data sources:
- World Bank | Health (1960–2025, retrieved 2026-07-08)
- United Nations | World Population Prospects (1960–2100, retrieved 2026-07-08)
- U.S. Census Bureau (1960–2025, retrieved 2026-07-08)
- Central Intelligence Agency (CIA) (2000–2019, retrieved 2026-07-08)
- Wikidata (2026, retrieved 2026-07-08)
Creative Commons Attribution (CC BY) — you’re free to copy, share, remix, adapt, and use even commercially as long as you give appropriate credit and clearly indicate if you made changes. Other sources may be subject to different license terms.