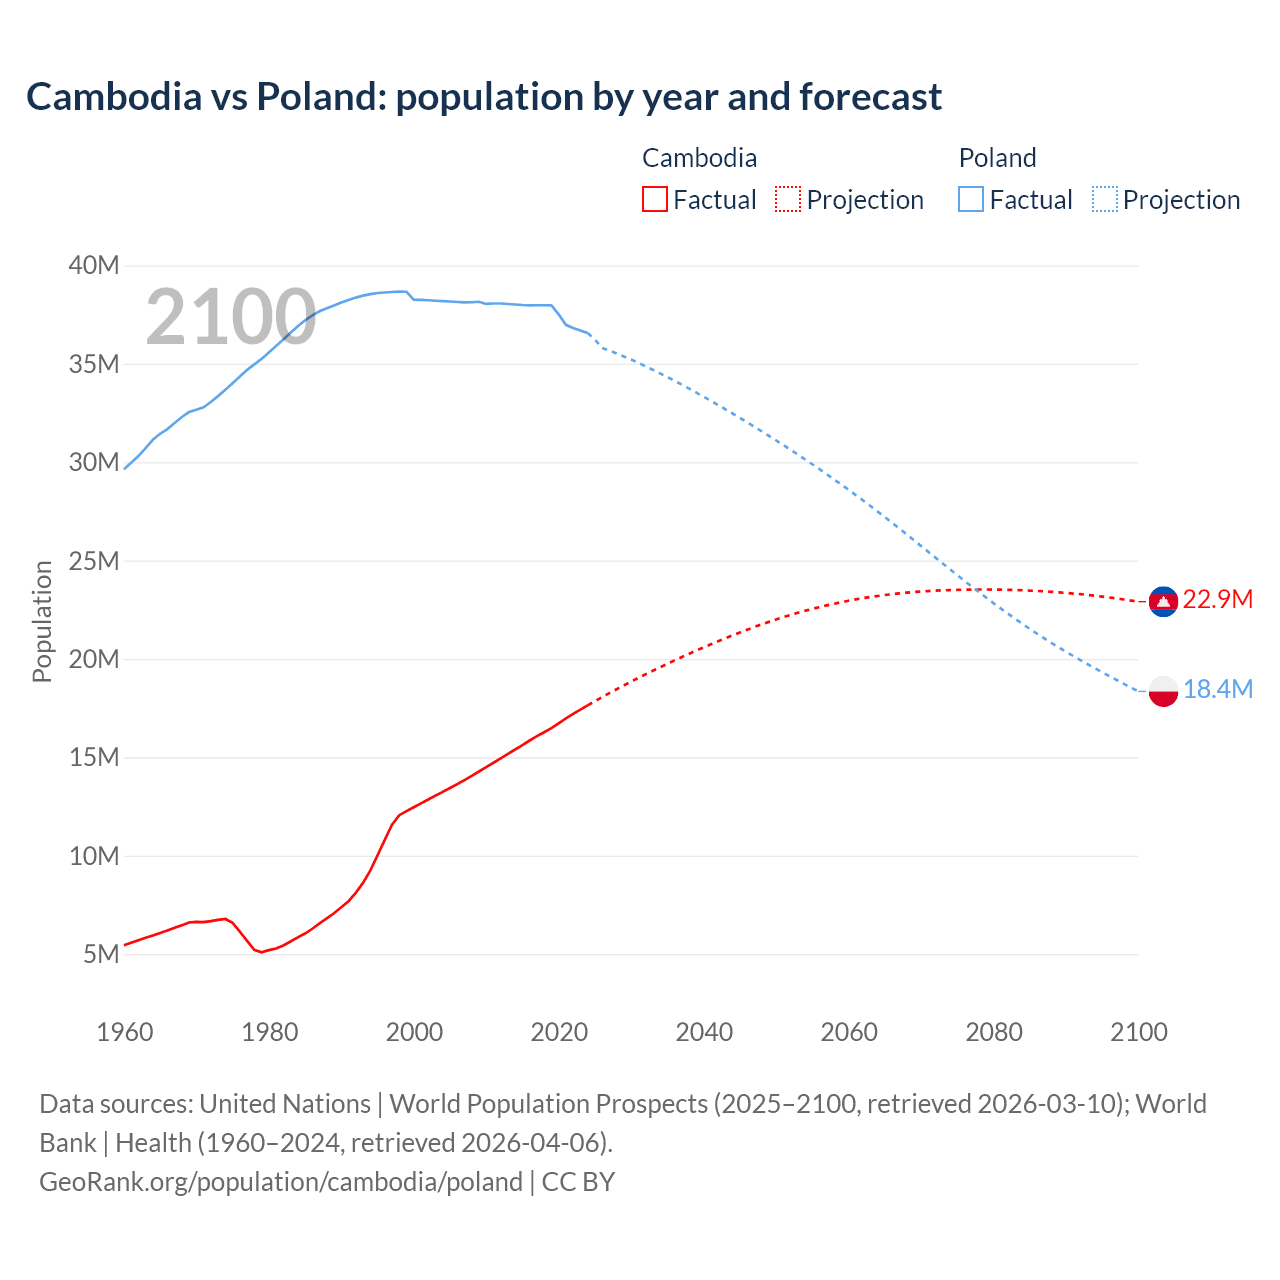
The latest officially reported population of Cambodia was 17,847,982 in 2025 vs 36,435,861 people in Poland in 2025. In 2026, based on the adjusted UN estimation, the current Cambodia's population is 18,159,213 people compared to 36,007,074 in Poland.
Population statistics:
- Poland's population is 1.98 times bigger than Cambodia's.
- Cambodia is ranked the 73rd most populous country in the world, while Poland is the 47th.
- The countries together account for 0.65% of the world: 0.22% for Cambodia vs 0.43% for Poland.
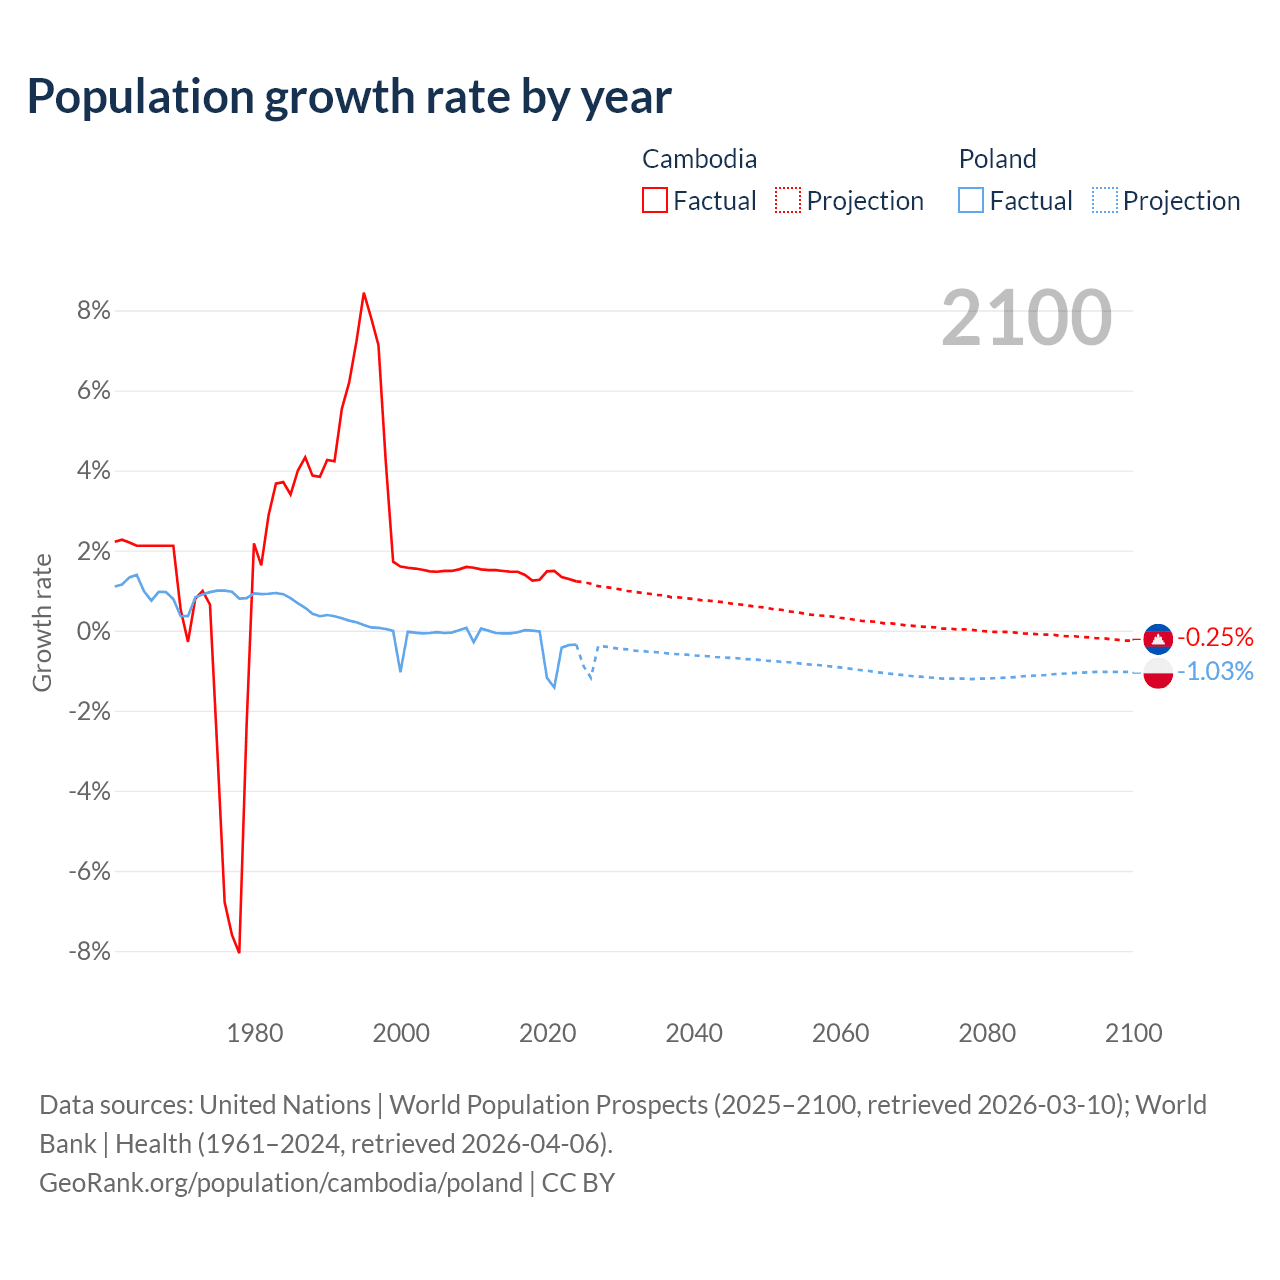
- For the last 10 years, Cambodia has had an average growth rate of +1.35% per year vs -0.38% in Poland.
- Since 2006, the population of Cambodia has increased from 13.6M people to 18.2M (33.1% growth), while Poland has declined from 38.1M to 36M (5.6% decline).
Cambodia vs Poland: population by year and forecast
| Year | Population | |
|---|---|---|
 Cambodia
|
 Poland
|
|
| 2100 | 22,901,914 | 18,452,579 |
| 2099 | 22,958,383 | 18,644,857 |
| 2098 | 23,015,331 | 18,838,707 |
| 2097 | 23,068,989 | 19,033,962 |
| 2096 | 23,118,854 | 19,231,896 |
| 2095 | 23,162,704 | 19,431,204 |
| 2094 | 23,207,466 | 19,634,214 |
| 2093 | 23,247,521 | 19,840,304 |
| 2092 | 23,285,540 | 20,049,969 |
| 2091 | 23,317,510 | 20,263,764 |
| 2090 | 23,349,581 | 20,482,150 |
| 2089 | 23,381,110 | 20,705,051 |
| 2088 | 23,404,619 | 20,933,750 |
| 2087 | 23,429,179 | 21,167,790 |
| 2086 | 23,450,970 | 21,407,163 |
| 2085 | 23,469,059 | 21,652,018 |
| 2084 | 23,486,236 | 21,902,736 |
| 2083 | 23,498,658 | 22,159,983 |
| 2082 | 23,506,751 | 22,423,109 |
| 2081 | 23,512,878 | 22,691,495 |
| 2080 | 23,518,840 | 22,964,515 |
| 2079 | 23,523,165 | 23,242,960 |
| 2078 | 23,523,989 | 23,524,184 |
| 2077 | 23,519,769 | 23,811,918 |
| 2076 | 23,512,440 | 24,102,012 |
| 2075 | 23,506,393 | 24,395,355 |
| 2074 | 23,494,004 | 24,691,719 |
| 2073 | 23,481,588 | 24,990,908 |
| 2072 | 23,463,712 | 25,290,453 |
| 2071 | 23,443,140 | 25,590,102 |
| 2070 | 23,420,769 | 25,889,034 |
| 2069 | 23,393,461 | 26,187,633 |
| 2068 | 23,362,386 | 26,485,171 |
| 2067 | 23,324,169 | 26,780,961 |
| 2066 | 23,283,399 | 27,074,124 |
| 2065 | 23,242,009 | 27,364,039 |
| 2064 | 23,191,929 | 27,650,950 |
| 2063 | 23,139,318 | 27,934,132 |
| 2062 | 23,083,489 | 28,212,240 |
| 2061 | 23,020,659 | 28,487,283 |
| 2060 | 22,951,813 | 28,757,525 |
| 2059 | 22,877,844 | 29,025,705 |
| 2058 | 22,799,179 | 29,288,751 |
| 2057 | 22,715,484 | 29,548,996 |
| 2056 | 22,628,607 | 29,806,770 |
| 2055 | 22,537,541 | 30,060,951 |
| 2054 | 22,440,088 | 30,311,416 |
| 2053 | 22,338,320 | 30,559,065 |
| 2052 | 22,231,339 | 30,801,964 |
| 2051 | 22,117,409 | 31,043,690 |
| 2050 | 22,001,254 | 31,281,762 |
| 2049 | 21,877,484 | 31,516,893 |
| 2048 | 21,749,790 | 31,748,736 |
| 2047 | 21,618,052 | 31,978,608 |
| 2046 | 21,480,480 | 32,205,877 |
| 2045 | 21,340,224 | 32,431,013 |
| 2044 | 21,195,511 | 32,653,012 |
| 2043 | 21,046,437 | 32,873,136 |
| 2042 | 20,893,438 | 33,090,733 |
| 2041 | 20,738,659 | 33,303,578 |
| 2040 | 20,582,241 | 33,514,705 |
| 2039 | 20,421,184 | 33,722,530 |
| 2038 | 20,256,225 | 33,926,660 |
| 2037 | 20,088,660 | 34,126,585 |
| 2036 | 19,922,341 | 34,323,967 |
| 2035 | 19,747,906 | 34,515,669 |
| 2034 | 19,573,792 | 34,704,048 |
| 2033 | 19,395,265 | 34,887,791 |
| 2032 | 19,215,259 | 35,067,502 |
| 2031 | 19,030,553 | 35,242,658 |
| 2030 | 18,843,778 | 35,410,392 |
| 2029 | 18,652,372 | 35,572,635 |
| 2028 | 18,456,287 | 35,725,650 |
| 2027 | 18,256,828 | 35,870,384 |
| 2026 | 18,056,115 | 36,007,074 |
| 2025 | 17,847,982 | 36,435,861 |
| 2024 | 17,638,801 | 36,559,233 |
| 2023 | 17,423,880 | 36,687,353 |
| 2022 | 17,201,724 | 36,821,749 |
| 2021 | 16,974,305 | 36,981,559 |
| 2020 | 16,725,474 | 37,515,748 |
| 2019 | 16,481,304 | 37,965,475 |
| 2018 | 16,274,522 | 37,974,750 |
| 2017 | 16,073,372 | 37,974,826 |
| 2016 | 15,852,803 | 37,970,087 |
| 2015 | 15,623,251 | 37,986,412 |
| 2014 | 15,396,772 | 38,011,735 |
| 2013 | 15,170,208 | 38,040,196 |
| 2012 | 14,945,085 | 38,063,164 |
| 2011 | 14,722,584 | 38,063,255 |
| 2010 | 14,500,726 | 38,042,794 |
| 2009 | 14,276,810 | 38,151,603 |
| 2008 | 14,053,479 | 38,125,759 |
| 2007 | 13,841,770 | 38,120,560 |
| 2006 | 13,639,028 | 38,141,267 |
| 2005 | 13,439,202 | 38,165,445 |
| 2004 | 13,244,731 | 38,182,222 |
| 2003 | 13,050,968 | 38,204,570 |
| 2002 | 12,855,241 | 38,230,364 |
| 2001 | 12,658,484 | 38,248,076 |
| 2000 | 12,462,336 | 38,258,629 |
| 1999 | 12,265,731 | 38,660,271 |
| 1998 | 12,058,173 | 38,663,481 |
| 1997 | 11,570,982 | 38,649,660 |
| 1996 | 10,801,270 | 38,624,370 |
| 1995 | 10,018,497 | 38,594,998 |
| 1994 | 9,239,162 | 38,542,652 |
| 1993 | 8,616,381 | 38,461,408 |
| 1992 | 8,113,083 | 38,363,667 |
| 1991 | 7,686,850 | 38,246,193 |
| 1990 | 7,374,752 | 38,110,782 |
| 1989 | 7,073,473 | 37,961,529 |
| 1988 | 6,812,014 | 37,824,487 |
| 1987 | 6,557,970 | 37,668,045 |
| 1986 | 6,285,693 | 37,456,119 |
| 1985 | 6,043,783 | 37,201,885 |
| 1984 | 5,845,117 | 36,904,134 |
| 1983 | 5,636,203 | 36,571,808 |
| 1982 | 5,436,432 | 36,230,481 |
| 1981 | 5,284,495 | 35,898,587 |
| 1980 | 5,199,872 | 35,574,150 |
| 1979 | 5,088,808 | 35,247,217 |
| 1978 | 5,211,653 | 34,965,600 |
| 1977 | 5,668,551 | 34,689,050 |
| 1976 | 6,134,991 | 34,356,300 |
| 1975 | 6,581,371 | 34,015,199 |
| 1974 | 6,783,240 | 33,678,899 |
| 1973 | 6,739,726 | 33,357,200 |
| 1972 | 6,673,886 | 33,055,650 |
| 1971 | 6,620,880 | 32,783,500 |
| 1970 | 6,639,182 | 32,664,300 |
| 1969 | 6,604,725 | 32,548,300 |
| 1968 | 6,467,324 | 32,294,655 |
| 1967 | 6,332,944 | 31,987,155 |
| 1966 | 6,201,232 | 31,681,000 |
| 1965 | 6,072,289 | 31,444,950 |
| 1964 | 5,946,178 | 31,139,450 |
| 1963 | 5,823,010 | 30,712,000 |
| 1962 | 5,697,558 | 30,308,500 |
| 1961 | 5,571,168 | 29,964,000 |
| 1960 | 5,449,966 | 29,637,450 |
Data sources: United Nations | World Population Prospects (2026–2100, retrieved 2026-07-08); World Bank | Health (1960–2025, retrieved 2026-07-08).
GeoRank.org/population/cambodia/poland | CC BY 
From 2006 to 2016, the population of Cambodia increased by 2,213,775 people (a 16.2% growth), while Poland lost 171,180 people (a 0.45% decline).
For the next 10 years, from 2016 to 2026, Cambodia gained 2,306,410 people (a 14.5% growth), while Poland's population decreased by 1,963,013 people (a 5.17% decline).
Cambodia was ranked 67th most populous country in 2006 and is 73rd in 2026. Poland was ranked 32nd in 2006 and ranked 47th now.
The UN's World Population Prospects forecasts that in 24 years (in 2050) Cambodia's population will grow by 21.2% to 22,001,254 people and will still be ranked 73rd. The population of Poland will decrease by 13.1% to 31,281,762 people and rank change from 47th to 61st.
Cambodia is projected to reach its peak in 2078 at 23.5M people, while Poland's population already peaked in 1998 at 38.7M people and is projected to decrease to 18.5M people by 2100.
Population growth rate by year
| Year | Growth rate | |
|---|---|---|
|
Cambodia
|
Poland
|
|
| 2100 | -0.25% | -1.03% |
| 2099 | -0.25% | -1.03% |
| 2098 | -0.23% | -1.03% |
| 2097 | -0.22% | -1.03% |
| 2096 | -0.19% | -1.03% |
| 2095 | -0.19% | -1.03% |
| 2094 | -0.17% | -1.04% |
| 2093 | -0.16% | -1.05% |
| 2092 | -0.14% | -1.06% |
| 2091 | -0.14% | -1.07% |
| 2090 | -0.13% | -1.08% |
| 2089 | -0.1% | -1.09% |
| 2088 | -0.1% | -1.11% |
| 2087 | -0.09% | -1.12% |
| 2086 | -0.08% | -1.13% |
| 2085 | -0.07% | -1.14% |
| 2084 | -0.05% | -1.16% |
| 2083 | -0.03% | -1.17% |
| 2082 | -0.03% | -1.18% |
| 2081 | -0.03% | -1.19% |
| 2080 | -0.02% | -1.2% |
| 2079 | -0.004% | -1.2% |
| 2078 | 0.02% | -1.21% |
| 2077 | 0.03% | -1.2% |
| 2076 | 0.03% | -1.2% |
| 2075 | 0.05% | -1.2% |
| 2074 | 0.05% | -1.2% |
| 2073 | 0.08% | -1.18% |
| 2072 | 0.09% | -1.17% |
| 2071 | 0.1% | -1.15% |
| 2070 | 0.12% | -1.14% |
| 2069 | 0.13% | -1.12% |
| 2068 | 0.16% | -1.1% |
| 2067 | 0.18% | -1.08% |
| 2066 | 0.18% | -1.06% |
| 2065 | 0.22% | -1.04% |
| 2064 | 0.23% | -1.01% |
| 2063 | 0.24% | -0.99% |
| 2062 | 0.27% | -0.97% |
| 2061 | 0.3% | -0.94% |
| 2060 | 0.32% | -0.92% |
| 2059 | 0.35% | -0.9% |
| 2058 | 0.37% | -0.88% |
| 2057 | 0.38% | -0.86% |
| 2056 | 0.4% | -0.85% |
| 2055 | 0.43% | -0.83% |
| 2054 | 0.46% | -0.81% |
| 2053 | 0.48% | -0.79% |
| 2052 | 0.52% | -0.78% |
| 2051 | 0.53% | -0.76% |
| 2050 | 0.57% | -0.75% |
| 2049 | 0.59% | -0.73% |
| 2048 | 0.61% | -0.72% |
| 2047 | 0.64% | -0.71% |
| 2046 | 0.66% | -0.69% |
| 2045 | 0.68% | -0.68% |
| 2044 | 0.71% | -0.67% |
| 2043 | 0.73% | -0.66% |
| 2042 | 0.75% | -0.64% |
| 2041 | 0.76% | -0.63% |
| 2040 | 0.79% | -0.62% |
| 2039 | 0.81% | -0.6% |
| 2038 | 0.83% | -0.59% |
| 2037 | 0.83% | -0.58% |
| 2036 | 0.88% | -0.56% |
| 2035 | 0.89% | -0.54% |
| 2034 | 0.92% | -0.53% |
| 2033 | 0.94% | -0.51% |
| 2032 | 0.97% | -0.5% |
| 2031 | 0.99% | -0.47% |
| 2030 | 1.03% | -0.46% |
| 2029 | 1.06% | -0.43% |
| 2028 | 1.09% | -0.4% |
| 2027 | 1.11% | -0.38% |
| 2026 | 1.17% | -1.18% |
| 2025 | 1.19% | -0.34% |
| 2024 | 1.23% | -0.35% |
| 2023 | 1.29% | -0.36% |
| 2022 | 1.34% | -0.43% |
| 2021 | 1.49% | -1.42% |
| 2020 | 1.48% | -1.18% |
| 2019 | 1.27% | -0.02% |
| 2018 | 1.25% | -0% |
| 2017 | 1.39% | 0.01% |
| 2016 | 1.47% | -0.04% |
| 2015 | 1.47% | -0.07% |
| 2014 | 1.49% | -0.07% |
| 2013 | 1.51% | -0.06% |
| 2012 | 1.51% | -0% |
| 2011 | 1.53% | 0.05% |
| 2010 | 1.57% | -0.29% |
| 2009 | 1.59% | 0.07% |
| 2008 | 1.53% | 0.01% |
| 2007 | 1.49% | -0.05% |
| 2006 | 1.49% | -0.06% |
| 2005 | 1.47% | -0.04% |
| 2004 | 1.48% | -0.06% |
| 2003 | 1.52% | -0.07% |
| 2002 | 1.55% | -0.05% |
| 2001 | 1.57% | -0.03% |
| 2000 | 1.6% | -1.04% |
| 1999 | 1.72% | -0.008% |
| 1998 | 4.21% | 0.04% |
| 1997 | 7.13% | 0.07% |
| 1996 | 7.81% | 0.08% |
| 1995 | 8.44% | 0.14% |
| 1994 | 7.23% | 0.21% |
| 1993 | 6.2% | 0.25% |
| 1992 | 5.54% | 0.31% |
| 1991 | 4.23% | 0.36% |
| 1990 | 4.26% | 0.39% |
| 1989 | 3.84% | 0.36% |
| 1988 | 3.87% | 0.42% |
| 1987 | 4.33% | 0.57% |
| 1986 | 4% | 0.68% |
| 1985 | 3.4% | 0.81% |
| 1984 | 3.71% | 0.91% |
| 1983 | 3.67% | 0.94% |
| 1982 | 2.88% | 0.92% |
| 1981 | 1.63% | 0.91% |
| 1980 | 2.18% | 0.93% |
| 1979 | -2.36% | 0.81% |
| 1978 | -8.06% | 0.8% |
| 1977 | -7.6% | 0.97% |
| 1976 | -6.78% | 1% |
| 1975 | -2.98% | 1% |
| 1974 | 0.65% | 0.96% |
| 1973 | 0.99% | 0.91% |
| 1972 | 0.8% | 0.83% |
| 1971 | -0.28% | 0.36% |
| 1970 | 0.52% | 0.36% |
| 1969 | 2.12% | 0.79% |
| 1968 | 2.12% | 0.96% |
| 1967 | 2.12% | 0.97% |
| 1966 | 2.12% | 0.75% |
| 1965 | 2.12% | 0.98% |
| 1964 | 2.12% | 1.39% |
| 1963 | 2.2% | 1.33% |
| 1962 | 2.27% | 1.15% |
| 1961 | 2.22% | 1.1% |
Data sources: United Nations | World Population Prospects (2026–2100, retrieved 2026-07-08); World Bank | Health (1961–2025, retrieved 2026-07-08).
GeoRank.org/population/cambodia/poland | CC BY
In 2025, the population of Cambodia grew by 1.19%, while Poland's population declined by 0.34%.
Live population counters
|
Cambodia
|
Poland
|
|
|---|---|---|
| Current population |
18159213
|
36007074
|
| Population rank | 73/197 | 47/197 |
| Percent of world population | 0.22% | 0.43% |
| One net population change |
2.52 minutes
|
4.27 minutes
|
| One birth every |
1.47 minutes
|
2.08 minutes
|
| One death every |
4.62 minutes
|
1.28 minutes
|
| Daily growth/decline | +573 | -338 |
| Annual growth/decline | +209,181 | -123,372 |
| Annual growth/decline rate | +1.19% | -0.34% |
| Population growth rate rank | 88/197 | 179/197 |
| One migration net change every |
16.7 minutes
|
1.59 minutes
|
| Annual migration change | -31,469 | -330,820 |
| Net migration rank | 167/196 | 191/196 |
| Foreign-born residents | 83,925 | 1,739,901 |
| Foreign-born residents rank | 136/195 | 41/195 |
| Foreign-born share of population | 0.5% | 4.5% |
| Foreign-born share rank | 175/195 | 97/195 |
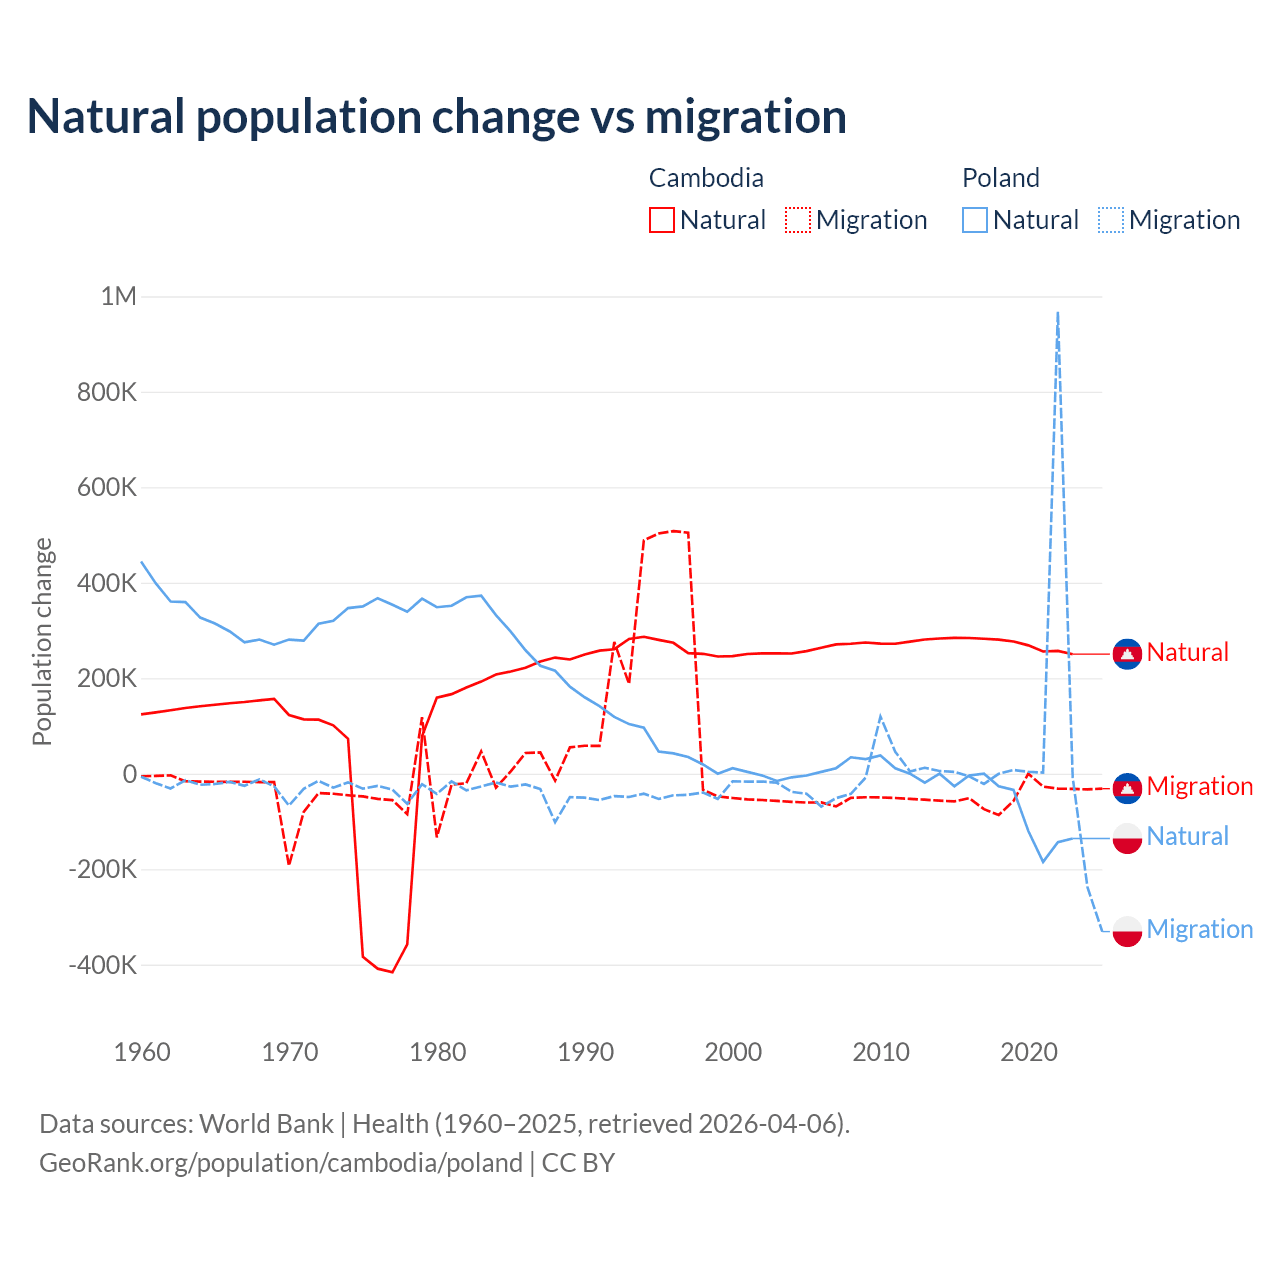
Natural population change vs migration
| Year | Population change | |||
|---|---|---|---|---|
|
Cambodia
|
Poland
|
|||
| Natural | Migration | Natural | Migration | |
| 2025 | - | -31,469 | - | -330,820 |
| 2024 | 244,386 | -32,960 | -157,205 | -238,062 |
| 2023 | 250,242 | -31,837 | -135,743 | -7,824 |
| 2022 | 257,269 | -31,350 | -143,605 | 967,744 |
| 2021 | 255,939 | -27,025 | -184,907 | 2,251 |
| 2020 | 268,745 | 0 | -120,050 | 3,920 |
| 2019 | 276,870 | -57,268 | -34,169 | 7,696 |
| 2018 | 280,671 | -86,702 | -26,582 | -223 |
| 2017 | 282,698 | -74,362 | 0 | -21,535 |
| 2016 | 284,130 | -51,324 | -3,797 | -5,675 |
| 2015 | 284,390 | -58,101 | -26,590 | 3,887 |
| 2014 | 283,193 | -56,536 | 0 | 5,525 |
| 2013 | 281,013 | -54,554 | -19,020 | 12,402 |
| 2012 | 276,649 | -52,874 | 0 | 4,635 |
| 2011 | 272,161 | -50,941 | 11,419 | 45,951 |
| 2010 | 272,266 | -49,781 | 38,043 | 119,623 |
| 2009 | 274,700 | -49,354 | 30,521 | -8,283 |
| 2008 | 272,132 | -50,809 | 34,313 | -42,288 |
| 2007 | 270,745 | -68,653 | 11,436 | -51,235 |
| 2006 | 263,697 | -60,315 | 3,814 | -68,882 |
| 2005 | 256,756 | -60,473 | -3,817 | -41,942 |
| 2004 | 251,650 | -58,972 | -7,637 | -38,216 |
| 2003 | 251,884 | -57,026 | -15,281 | -19,039 |
| 2002 | 251,860 | -55,245 | -3,823 | -16,462 |
| 2001 | 250,726 | -53,815 | 3,825 | -16,648 |
| 2000 | 246,330 | -50,957 | 11,478 | -15,921 |
| 1999 | 245,425 | -47,608 | 0 | -53,035 |
| 1998 | 251,076 | -33,781 | 19,332 | -39,509 |
| 1997 | 252,351 | 504,742 | 34,785 | -44,230 |
| 1996 | 274,147 | 508,187 | 42,487 | -45,349 |
| 1995 | 280,168 | 503,042 | 46,314 | -52,989 |
| 1994 | 286,728 | 488,732 | 96,357 | -41,845 |
| 1993 | 282,221 | 187,883 | 103,846 | -48,805 |
| 1992 | 260,673 | 275,823 | 118,928 | -46,893 |
| 1991 | 257,709 | 58,264 | 141,511 | -55,342 |
| 1990 | 249,776 | 58,455 | 160,066 | -50,339 |
| 1989 | 239,211 | 55,125 | 182,215 | -49,192 |
| 1988 | 243,203 | -14,627 | 215,599 | -101,671 |
| 1987 | 235,064 | 44,442 | 226,008 | -32,310 |
| 1986 | 221,684 | 43,356 | 258,448 | -22,520 |
| 1985 | 214,101 | 4,677 | 297,615 | -27,277 |
| 1984 | 207,700 | -29,141 | 332,137 | -18,402 |
| 1983 | 192,849 | 46,428 | 373,032 | -26,724 |
| 1982 | 180,300 | -20,026 | 369,551 | -34,980 |
| 1981 | 166,578 | -22,982 | 351,806 | -16,155 |
| 1980 | 159,157 | -133,508 | 348,627 | -42,420 |
| 1979 | 78,143 | 118,334 | 366,571 | -22,162 |
| 1978 | -357,478 | -84,695 | 339,166 | -62,936 |
| 1977 | -416,117 | -55,504 | 353,828 | -33,496 |
| 1976 | -408,505 | -52,741 | 367,612 | -25,716 |
| 1975 | -383,806 | -47,717 | 350,356 | -31,346 |
| 1974 | 73,001 | -45,225 | 346,893 | -18,273 |
| 1973 | 101,304 | -42,053 | 320,229 | -29,335 |
| 1972 | 113,190 | -40,764 | 314,028 | -15,004 |
| 1971 | 113,813 | -80,232 | 278,660 | -31,767 |
| 1970 | 122,832 | -193,008 | 280,913 | -66,859 |
| 1969 | 156,777 | -17,676 | 270,151 | -26,744 |
| 1968 | 153,444 | -17,745 | 280,963 | -11,905 |
| 1967 | 150,046 | -16,983 | 275,089 | -25,479 |
| 1966 | 147,583 | -17,216 | 297,801 | -17,158 |
| 1965 | 144,460 | -16,930 | 314,450 | -21,658 |
| 1964 | 141,216 | -16,516 | 326,965 | -23,273 |
| 1963 | 137,562 | -15,929 | 359,330 | -13,770 |
| 1962 | 132,861 | -3,578 | 360,671 | -31,021 |
| 1961 | 128,259 | -4,764 | 398,521 | -20,044 |
| 1960 | 124,237 | -5,339 | 444,562 | -6,306 |
Data sources: World Bank | Health (1960–2025, retrieved 2026-07-08).
GeoRank.org/population/cambodia/poland | CC BY
Over the last 10 years, 85.6% of the population change in Cambodia is from natural causes (a gain of 2,685,340 people) and 14.4% is from migration (a loss of 450,929 people). In Poland 53.9% is from natural causes (a loss of 832,648 people) and 46.1% is from migration (a gain of 712,179 people).
As of 2024, 83,925 residents or 0.5% of the population were not native-born in Cambodia, compared to 1,739,901 people or 4.5% in Poland.
Biggest cities by population
|
Cambodia
|
|
|---|---|
| City | Population |
| Phnom Penh | 2.13M |
| Siem Reap | 245K |
| Battambang | 119K |
| Serei Saophoan | 99K |
| Sihanoukville | 71.1K |
| Kampong Cham | 61.8K |
| Kampot | 42.1K |
| Svay Rieng | 41.4K |
| Prey Veng | 33.1K |
| Stung Treng | 29.7K |
|
Poland
|
|
|---|---|
| City | Population |
| Warsaw | 1.86M |
| Krakow | 804K |
| Wroclaw | 674K |
| Lodz | 649K |
| Poznan | 547K |
| Gdansk | 488K |
| Szczecin | 388K |
| Lublin | 335K |
| Bydgoszcz | 325K |
| Bialystok | 290K |
Compare countries by 7 more topics
Population differences between Cambodia and Poland
|
Cambodia
|
Poland
|
|
|---|---|---|
| Life expectancy | 71.1 years | 79.2 years |
| Average age | 29.9 years | 43.1 years |
| Median age | 27.2 years | 43.5 years |
| Male:Female ratio | 49:51 | 48.4:51.6 |
| Fertility rate | 2.55 births per woman | 1.14 births per woman |
| Population density | 264.9 ppl/mi² | 304 ppl/mi² |
Population map with other countries
Data sources: World Bank | Health (1960–2025, retrieved 2026-07-08); United Nations | World Population Prospects (1960–2026, retrieved 2026-07-08); U.S. Census Bureau (1960–2025, retrieved 2026-07-08); Central Intelligence Agency (CIA) (2000–2019, retrieved 2026-07-08).
GeoRank.org/population/cambodia/poland | CC BY
Help us show the world through your eyes
Share a photo of your city and help others discover what it looks like to live there. Your contribution makes our data come alive.
Data sources:
- World Bank | Health (1960–2025, retrieved 2026-07-08)
- United Nations | World Population Prospects (1960–2100, retrieved 2026-07-08)
- U.S. Census Bureau (1960–2025, retrieved 2026-07-08)
- Wikidata (2026, retrieved 2026-07-08)
- Central Intelligence Agency (CIA) (2000–2019, retrieved 2026-07-08)
Creative Commons Attribution (CC BY) — you’re free to copy, share, remix, adapt, and use even commercially as long as you give appropriate credit and clearly indicate if you made changes. Other sources may be subject to different license terms.