The latest officially reported population of Ethiopia was 135,472,051 in 2025 vs 116,786,962 people in the Philippines in 2025. In 2026, based on the adjusted UN estimation, the current Ethiopia's population is 140,722,974 people compared to 118,213,646 in the Philippines.
Population statistics:
- Ethiopia's population is 1.19 times bigger than the Philippines'.
- Ethiopia is ranked the 10th most populous country in the world, while the Philippines is the 15th.
- The countries together account for 3.12% of the world: 1.69% for Ethiopia vs 1.42% for the Philippines.
- For the last 10 years, Ethiopia has had an average growth rate of +2.69% per year vs +1.08% in the Philippines.
- Since 2006, the population of Ethiopia has increased from 80.7M people to 141M (74.4% growth), while the Philippines has grown from 89.5M to 118M (32.1% growth).
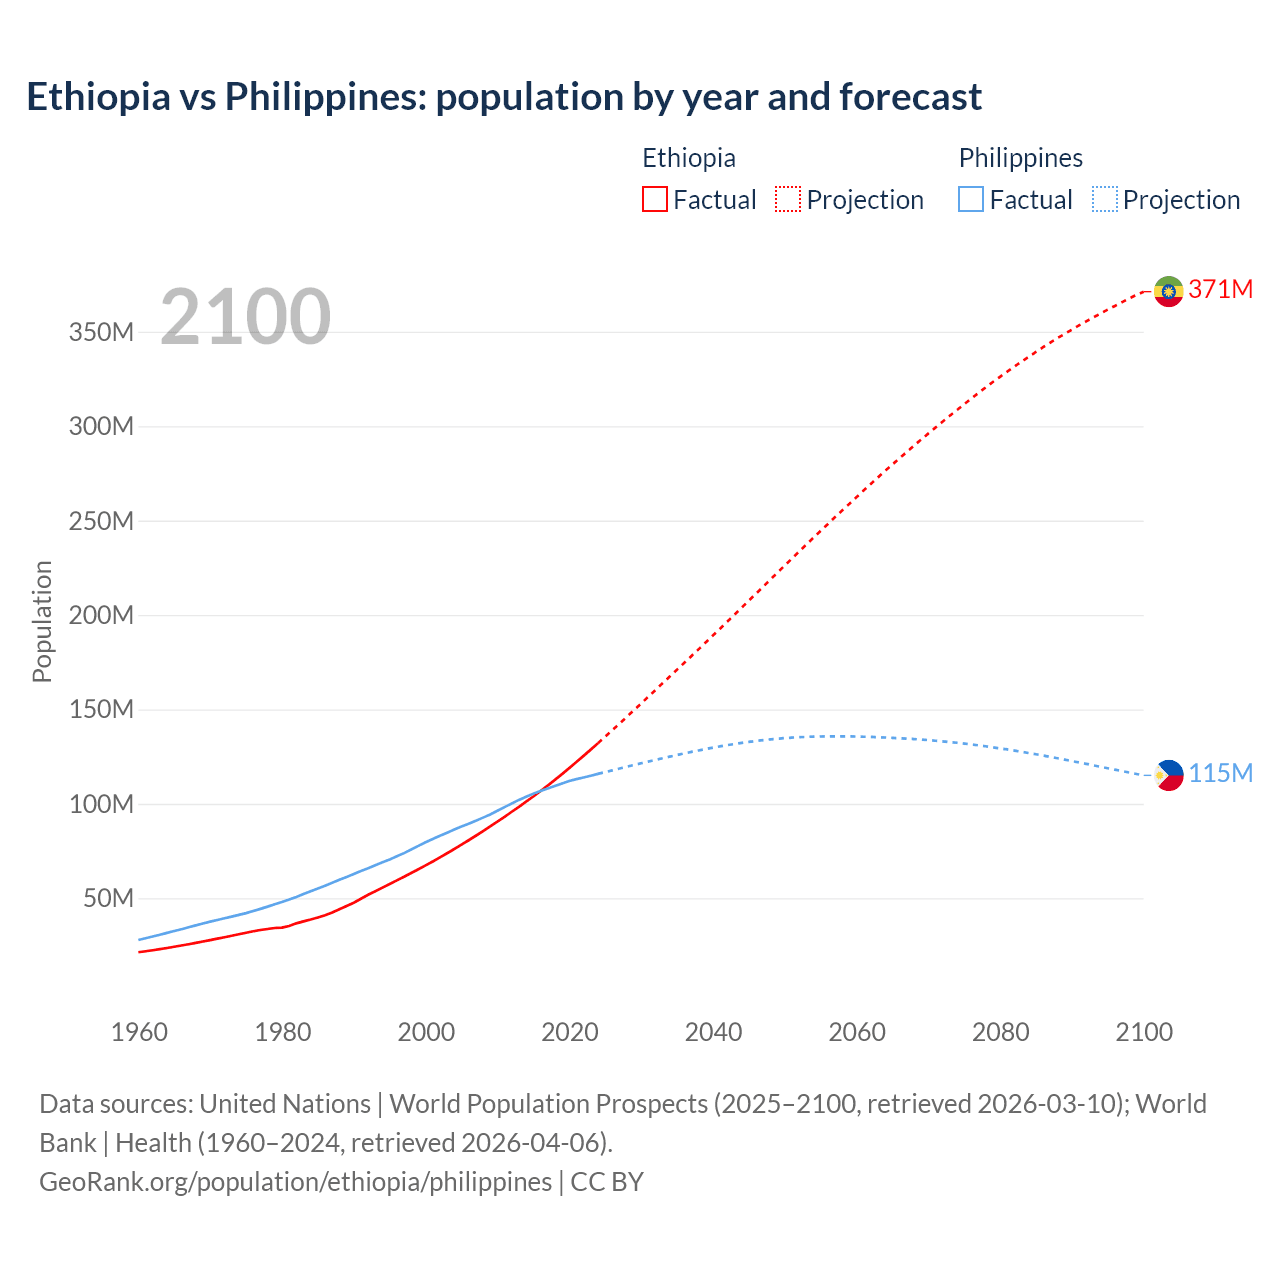
Ethiopia vs Philippines: population by year and forecast
| Year | Population | |
|---|---|---|
 Ethiopia
|
 Philippines
|
|
| 2100 | 371,078,260 | 115,059,775 |
| 2099 | 369,338,252 | 115,816,309 |
| 2098 | 367,513,542 | 116,573,828 |
| 2097 | 365,567,496 | 117,333,883 |
| 2096 | 363,536,294 | 118,100,419 |
| 2095 | 361,596,042 | 118,866,742 |
| 2094 | 359,531,317 | 119,626,818 |
| 2093 | 357,460,480 | 120,388,122 |
| 2092 | 355,389,829 | 121,147,462 |
| 2091 | 353,218,632 | 121,904,917 |
| 2090 | 350,960,021 | 122,652,199 |
| 2089 | 348,751,618 | 123,391,846 |
| 2088 | 346,517,326 | 124,122,345 |
| 2087 | 344,162,324 | 124,843,149 |
| 2086 | 341,671,994 | 125,552,213 |
| 2085 | 339,167,930 | 126,246,777 |
| 2084 | 336,649,520 | 126,918,902 |
| 2083 | 334,083,247 | 127,566,644 |
| 2082 | 331,401,460 | 128,196,192 |
| 2081 | 328,715,487 | 128,799,883 |
| 2080 | 326,013,981 | 129,384,776 |
| 2079 | 323,282,865 | 129,937,788 |
| 2078 | 320,422,535 | 130,470,163 |
| 2077 | 317,492,915 | 130,981,766 |
| 2076 | 314,518,328 | 131,455,691 |
| 2075 | 311,487,723 | 131,899,779 |
| 2074 | 308,416,133 | 132,321,868 |
| 2073 | 305,383,505 | 132,712,554 |
| 2072 | 302,258,564 | 133,078,198 |
| 2071 | 299,119,280 | 133,413,261 |
| 2070 | 295,963,235 | 133,726,740 |
| 2069 | 292,756,723 | 134,013,962 |
| 2068 | 289,522,748 | 134,276,965 |
| 2067 | 286,191,689 | 134,521,893 |
| 2066 | 282,905,709 | 134,738,123 |
| 2065 | 279,576,283 | 134,943,069 |
| 2064 | 276,197,958 | 135,121,691 |
| 2063 | 272,782,685 | 135,278,856 |
| 2062 | 269,340,926 | 135,418,302 |
| 2061 | 265,803,351 | 135,533,003 |
| 2060 | 262,269,354 | 135,624,320 |
| 2059 | 258,692,767 | 135,691,307 |
| 2058 | 255,205,644 | 135,723,393 |
| 2057 | 251,656,356 | 135,729,299 |
| 2056 | 248,002,497 | 135,713,449 |
| 2055 | 244,426,069 | 135,658,483 |
| 2054 | 240,794,405 | 135,564,032 |
| 2053 | 237,155,110 | 135,433,969 |
| 2052 | 233,479,314 | 135,267,110 |
| 2051 | 229,733,593 | 135,047,521 |
| 2050 | 226,055,085 | 134,786,831 |
| 2049 | 222,351,471 | 134,476,341 |
| 2048 | 218,627,197 | 134,125,026 |
| 2047 | 214,883,954 | 133,725,025 |
| 2046 | 211,161,780 | 133,275,028 |
| 2045 | 207,461,987 | 132,781,283 |
| 2044 | 203,749,820 | 132,246,145 |
| 2043 | 200,035,613 | 131,672,273 |
| 2042 | 196,351,202 | 131,060,574 |
| 2041 | 192,689,672 | 130,412,807 |
| 2040 | 189,023,384 | 129,728,924 |
| 2039 | 185,365,776 | 129,013,931 |
| 2038 | 181,733,067 | 128,259,977 |
| 2037 | 178,124,993 | 127,475,872 |
| 2036 | 174,515,366 | 126,664,807 |
| 2035 | 170,904,339 | 125,834,749 |
| 2034 | 167,316,305 | 124,984,319 |
| 2033 | 163,763,376 | 124,117,657 |
| 2032 | 160,167,364 | 123,239,893 |
| 2031 | 156,590,018 | 122,353,079 |
| 2030 | 153,023,174 | 121,447,264 |
| 2029 | 149,461,578 | 120,532,209 |
| 2028 | 145,944,350 | 119,603,538 |
| 2027 | 142,419,893 | 118,669,567 |
| 2026 | 138,930,724 | 117,732,112 |
| 2025 | 135,472,051 | 116,786,962 |
| 2024 | 132,059,767 | 115,843,670 |
| 2023 | 128,691,692 | 114,891,199 |
| 2022 | 125,384,287 | 113,964,338 |
| 2021 | 122,138,588 | 113,100,950 |
| 2020 | 118,917,671 | 112,081,264 |
| 2019 | 115,737,383 | 110,804,683 |
| 2018 | 112,664,152 | 109,465,287 |
| 2017 | 109,666,481 | 108,119,693 |
| 2016 | 106,718,162 | 106,735,719 |
| 2015 | 103,867,135 | 105,312,992 |
| 2014 | 101,115,610 | 103,767,130 |
| 2013 | 98,438,751 | 102,076,336 |
| 2012 | 95,798,767 | 100,175,512 |
| 2011 | 93,149,970 | 98,248,614 |
| 2010 | 90,538,514 | 96,337,125 |
| 2009 | 88,007,636 | 94,384,250 |
| 2008 | 85,543,668 | 92,699,095 |
| 2007 | 83,103,217 | 91,075,184 |
| 2006 | 80,703,490 | 89,508,986 |
| 2005 | 78,367,470 | 88,015,962 |
| 2004 | 76,077,206 | 86,394,504 |
| 2003 | 73,832,663 | 84,731,835 |
| 2002 | 71,635,517 | 83,068,889 |
| 2001 | 69,487,762 | 81,401,488 |
| 2000 | 67,411,494 | 79,625,397 |
| 1999 | 65,374,561 | 77,753,257 |
| 1998 | 63,363,524 | 75,791,024 |
| 1997 | 61,404,539 | 73,908,810 |
| 1996 | 59,467,635 | 72,190,242 |
| 1995 | 57,537,335 | 70,546,246 |
| 1994 | 55,611,508 | 69,019,291 |
| 1993 | 53,708,891 | 67,530,621 |
| 1992 | 51,853,747 | 65,926,125 |
| 1991 | 49,717,198 | 64,382,249 |
| 1990 | 47,609,755 | 62,854,666 |
| 1989 | 45,879,690 | 61,265,260 |
| 1988 | 44,150,825 | 59,739,052 |
| 1987 | 42,460,039 | 58,157,496 |
| 1986 | 41,037,656 | 56,645,077 |
| 1985 | 39,842,136 | 55,213,006 |
| 1984 | 38,735,722 | 53,726,181 |
| 1983 | 37,740,817 | 52,194,620 |
| 1982 | 36,701,290 | 50,695,707 |
| 1981 | 35,304,012 | 49,311,727 |
| 1980 | 34,428,514 | 48,043,740 |
| 1979 | 34,238,652 | 46,807,103 |
| 1978 | 33,734,592 | 45,575,281 |
| 1977 | 33,167,272 | 44,367,962 |
| 1976 | 32,534,418 | 43,201,488 |
| 1975 | 31,723,252 | 42,120,826 |
| 1974 | 30,957,273 | 41,174,341 |
| 1973 | 30,166,785 | 40,294,130 |
| 1972 | 29,374,608 | 39,408,560 |
| 1971 | 28,600,106 | 38,518,659 |
| 1970 | 27,829,128 | 37,622,204 |
| 1969 | 27,072,571 | 36,660,799 |
| 1968 | 26,337,930 | 35,638,342 |
| 1967 | 25,620,276 | 34,621,320 |
| 1966 | 24,952,689 | 33,617,170 |
| 1965 | 24,310,612 | 32,625,316 |
| 1964 | 23,666,548 | 31,643,032 |
| 1963 | 23,051,637 | 30,674,731 |
| 1962 | 22,465,126 | 29,723,536 |
| 1961 | 21,906,102 | 28,792,621 |
| 1960 | 21,376,693 | 27,891,897 |
Data sources: United Nations | World Population Prospects (2026–2100, retrieved 2026-07-08); World Bank | Health (1960–2025, retrieved 2026-07-08).
GeoRank.org/population/ethiopia/philippines | CC BY 
From 2006 to 2016, the population of Ethiopia increased by 26,014,672 people (a 32.2% growth), while the Philippines gained 17,226,733 people (a 19.2% growth).
For the next 10 years, from 2016 to 2026, Ethiopia gained 34,004,812 people (a 31.9% growth), while the Philippines' population increased by 11,477,927 people (a 10.8% growth).
Ethiopia was ranked 16th most populous country in 2006 and is 10th in 2026. The Philippines was ranked 12th in 2006 and ranked 15th now.
The UN's World Population Prospects forecasts that in 24 years (in 2050) Ethiopia's population will grow by 60.6% to 226,055,085 people with a rank change from 10th to 7th. The population of the Philippines will increase by 14% to 134,786,831 people and rank change from 15th to 14th.
Ethiopia is projected to reach its peak in 2100 at 371M people compared to the peak of 136M people in 2057 for the Philippines.
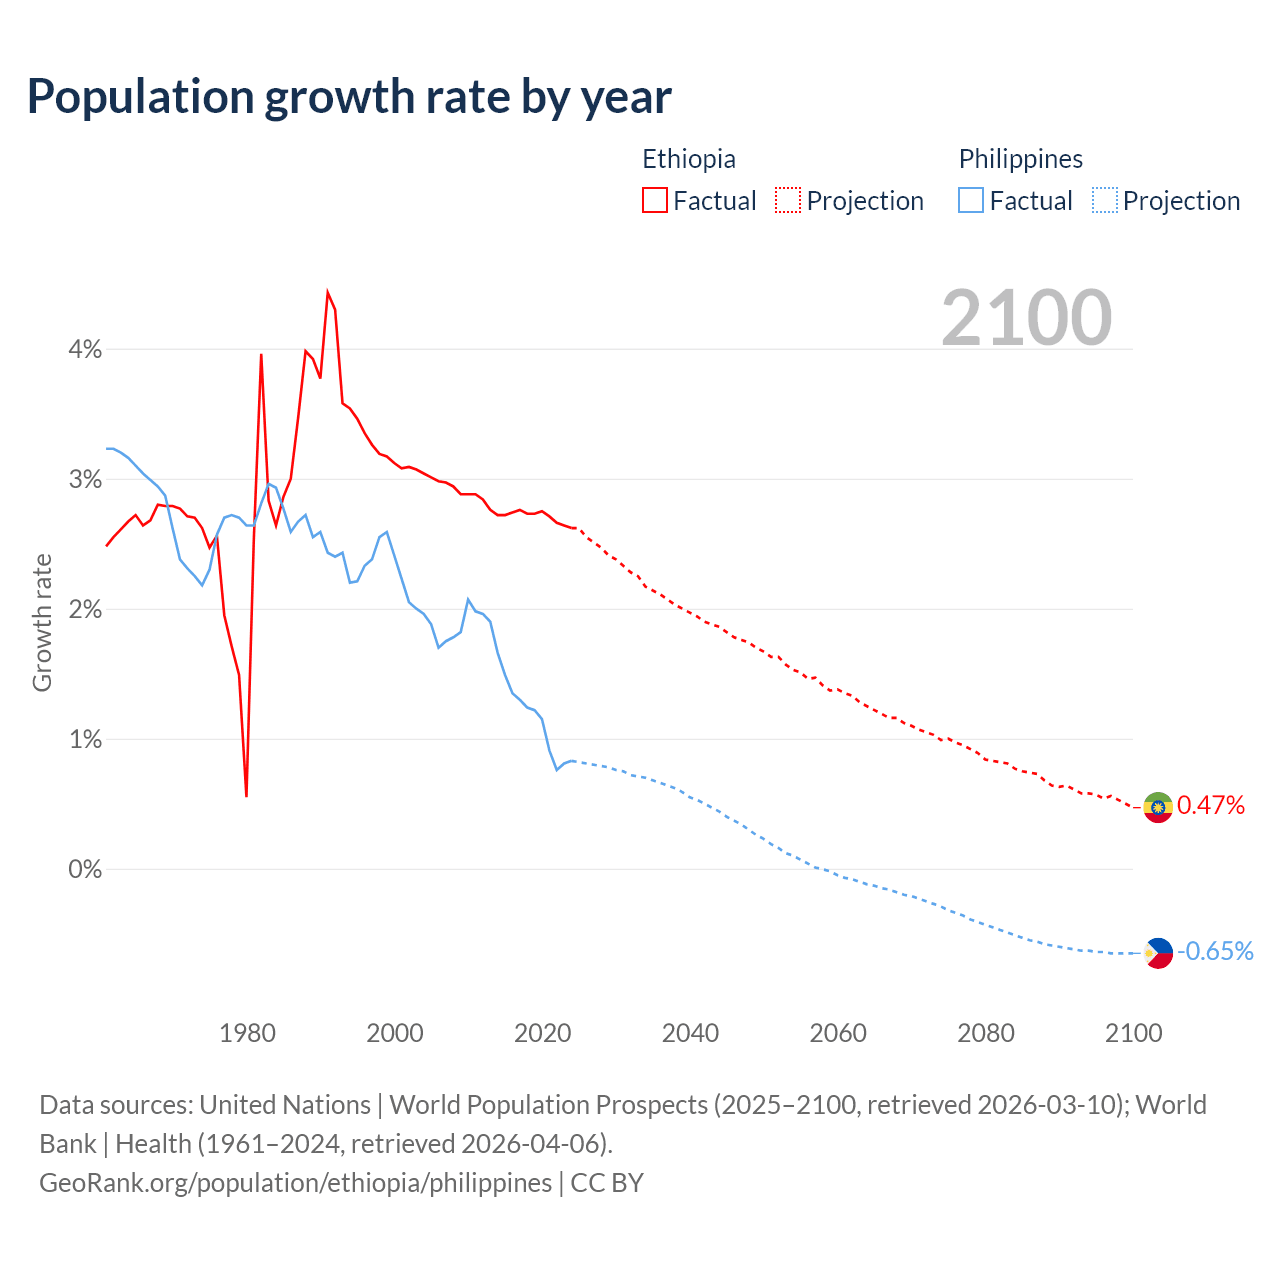
Population growth rate by year
| Year | Growth rate | |
|---|---|---|
|
Ethiopia
|
Philippines
|
|
| 2100 | 0.47% | -0.65% |
| 2099 | 0.5% | -0.65% |
| 2098 | 0.53% | -0.65% |
| 2097 | 0.56% | -0.65% |
| 2096 | 0.54% | -0.64% |
| 2095 | 0.57% | -0.64% |
| 2094 | 0.58% | -0.63% |
| 2093 | 0.58% | -0.63% |
| 2092 | 0.61% | -0.62% |
| 2091 | 0.64% | -0.61% |
| 2090 | 0.63% | -0.6% |
| 2089 | 0.64% | -0.59% |
| 2088 | 0.68% | -0.58% |
| 2087 | 0.73% | -0.56% |
| 2086 | 0.74% | -0.55% |
| 2085 | 0.75% | -0.53% |
| 2084 | 0.77% | -0.51% |
| 2083 | 0.81% | -0.49% |
| 2082 | 0.82% | -0.47% |
| 2081 | 0.83% | -0.45% |
| 2080 | 0.84% | -0.43% |
| 2079 | 0.89% | -0.41% |
| 2078 | 0.92% | -0.39% |
| 2077 | 0.95% | -0.36% |
| 2076 | 0.97% | -0.34% |
| 2075 | 1% | -0.32% |
| 2074 | 0.99% | -0.29% |
| 2073 | 1.03% | -0.27% |
| 2072 | 1.05% | -0.25% |
| 2071 | 1.07% | -0.23% |
| 2070 | 1.1% | -0.21% |
| 2069 | 1.12% | -0.2% |
| 2068 | 1.16% | -0.18% |
| 2067 | 1.16% | -0.16% |
| 2066 | 1.19% | -0.15% |
| 2065 | 1.22% | -0.13% |
| 2064 | 1.25% | -0.12% |
| 2063 | 1.28% | -0.1% |
| 2062 | 1.33% | -0.08% |
| 2061 | 1.35% | -0.07% |
| 2060 | 1.38% | -0.05% |
| 2059 | 1.37% | -0.02% |
| 2058 | 1.41% | -0.004% |
| 2057 | 1.47% | 0.01% |
| 2056 | 1.46% | 0.04% |
| 2055 | 1.51% | 0.07% |
| 2054 | 1.53% | 0.1% |
| 2053 | 1.57% | 0.12% |
| 2052 | 1.63% | 0.16% |
| 2051 | 1.63% | 0.19% |
| 2050 | 1.67% | 0.23% |
| 2049 | 1.7% | 0.26% |
| 2048 | 1.74% | 0.3% |
| 2047 | 1.76% | 0.34% |
| 2046 | 1.78% | 0.37% |
| 2045 | 1.82% | 0.4% |
| 2044 | 1.86% | 0.44% |
| 2043 | 1.88% | 0.47% |
| 2042 | 1.9% | 0.5% |
| 2041 | 1.94% | 0.53% |
| 2040 | 1.97% | 0.55% |
| 2039 | 2% | 0.59% |
| 2038 | 2.03% | 0.62% |
| 2037 | 2.07% | 0.64% |
| 2036 | 2.11% | 0.66% |
| 2035 | 2.14% | 0.68% |
| 2034 | 2.17% | 0.7% |
| 2033 | 2.25% | 0.71% |
| 2032 | 2.28% | 0.72% |
| 2031 | 2.33% | 0.75% |
| 2030 | 2.38% | 0.76% |
| 2029 | 2.41% | 0.78% |
| 2028 | 2.47% | 0.79% |
| 2027 | 2.51% | 0.8% |
| 2026 | 2.55% | 0.81% |
| 2025 | 2.58% | 0.81% |
| 2024 | 2.62% | 0.83% |
| 2023 | 2.64% | 0.81% |
| 2022 | 2.66% | 0.76% |
| 2021 | 2.71% | 0.91% |
| 2020 | 2.75% | 1.15% |
| 2019 | 2.73% | 1.22% |
| 2018 | 2.73% | 1.24% |
| 2017 | 2.76% | 1.3% |
| 2016 | 2.74% | 1.35% |
| 2015 | 2.72% | 1.49% |
| 2014 | 2.72% | 1.66% |
| 2013 | 2.76% | 1.9% |
| 2012 | 2.84% | 1.96% |
| 2011 | 2.88% | 1.98% |
| 2010 | 2.88% | 2.07% |
| 2009 | 2.88% | 1.82% |
| 2008 | 2.94% | 1.78% |
| 2007 | 2.97% | 1.75% |
| 2006 | 2.98% | 1.7% |
| 2005 | 3.01% | 1.88% |
| 2004 | 3.04% | 1.96% |
| 2003 | 3.07% | 2% |
| 2002 | 3.09% | 2.05% |
| 2001 | 3.08% | 2.23% |
| 2000 | 3.12% | 2.41% |
| 1999 | 3.17% | 2.59% |
| 1998 | 3.19% | 2.55% |
| 1997 | 3.26% | 2.38% |
| 1996 | 3.35% | 2.33% |
| 1995 | 3.46% | 2.21% |
| 1994 | 3.54% | 2.2% |
| 1993 | 3.58% | 2.43% |
| 1992 | 4.3% | 2.4% |
| 1991 | 4.43% | 2.43% |
| 1990 | 3.77% | 2.59% |
| 1989 | 3.92% | 2.55% |
| 1988 | 3.98% | 2.72% |
| 1987 | 3.47% | 2.67% |
| 1986 | 3% | 2.59% |
| 1985 | 2.86% | 2.77% |
| 1984 | 2.64% | 2.93% |
| 1983 | 2.83% | 2.96% |
| 1982 | 3.96% | 2.81% |
| 1981 | 2.54% | 2.64% |
| 1980 | 0.55% | 2.64% |
| 1979 | 1.49% | 2.7% |
| 1978 | 1.71% | 2.72% |
| 1977 | 1.95% | 2.7% |
| 1976 | 2.56% | 2.57% |
| 1975 | 2.47% | 2.3% |
| 1974 | 2.62% | 2.18% |
| 1973 | 2.7% | 2.25% |
| 1972 | 2.71% | 2.31% |
| 1971 | 2.77% | 2.38% |
| 1970 | 2.79% | 2.62% |
| 1969 | 2.79% | 2.87% |
| 1968 | 2.8% | 2.94% |
| 1967 | 2.68% | 2.99% |
| 1966 | 2.64% | 3.04% |
| 1965 | 2.72% | 3.1% |
| 1964 | 2.67% | 3.16% |
| 1963 | 2.61% | 3.2% |
| 1962 | 2.55% | 3.23% |
| 1961 | 2.48% | 3.23% |
Data sources: United Nations | World Population Prospects (2026–2100, retrieved 2026-07-08); World Bank | Health (1961–2025, retrieved 2026-07-08).
GeoRank.org/population/ethiopia/philippines | CC BY
In 2025, the population of Ethiopia grew by 2.58%, while the Philippines' population grew by 0.81%.
Live population counters
|
Ethiopia
|
Philippines
|
|
|---|---|---|
| Current population |
140722974
|
118213646
|
| Population rank | 10/197 | 15/197 |
| Percent of world population | 1.69% | 1.42% |
| One net population change |
9.27 seconds
|
33.5 seconds
|
| One birth every |
7.59 seconds
|
17.1 seconds
|
| One death every |
40.6 seconds
|
42.9 seconds
|
| Daily growth/decline | +9,349 | +2,584 |
| Annual growth/decline | +3,412,284 | +943,292 |
| Annual growth/decline rate | +2.58% | +0.81% |
| Population growth rate rank | 24/197 | 110/197 |
| One migration net change every |
21.9 minutes
|
3.53 minutes
|
| Annual migration change | +24,054 | -149,315 |
| Net migration rank | 31/196 | 185/196 |
| Foreign-born residents | 1,168,455 | 87,212 |
| Foreign-born residents rank | 53/195 | 135/195 |
| Foreign-born share of population | 0.9% | 0.1% |
| Foreign-born share rank | 157/195 | 195/195 |
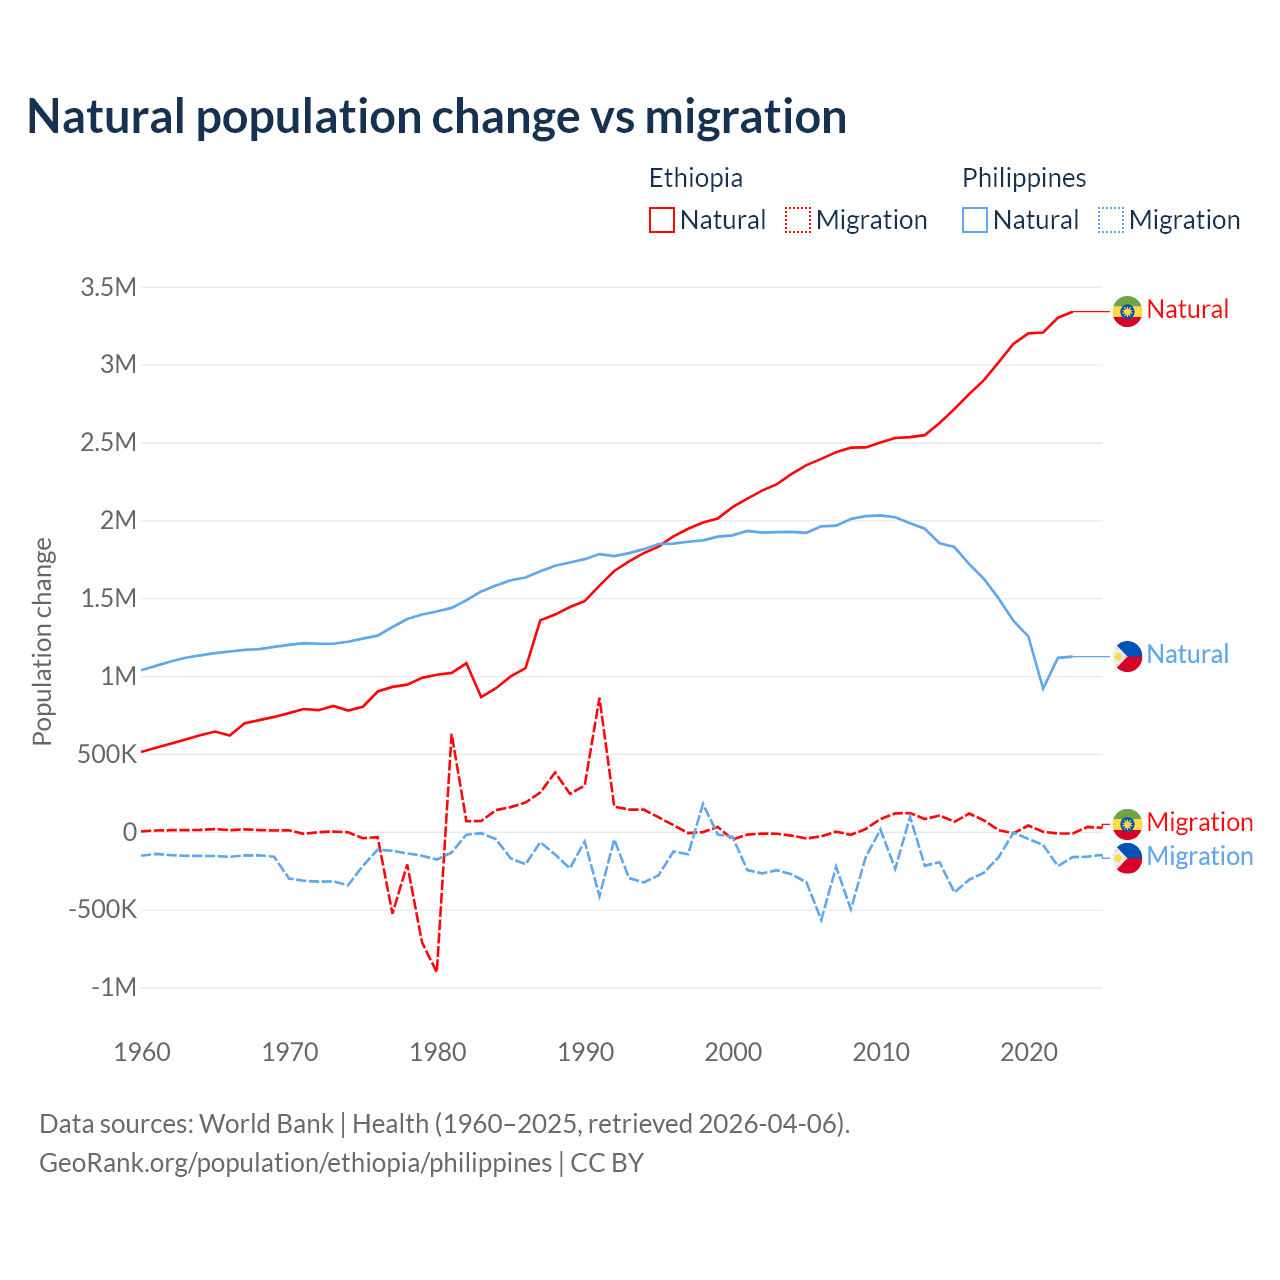
Natural population change vs migration
| Year | Population change | |||
|---|---|---|---|---|
|
Ethiopia
|
Philippines
|
|||
| Natural | Migration | Natural | Migration | |
| 2025 | - | 24,054 | - | -149,315 |
| 2024 | 3,379,409 | 30,069 | 1,105,612 | -160,373 |
| 2023 | 3,338,649 | -11,996 | 1,123,981 | -164,284 |
| 2022 | 3,300,114 | -11,996 | 1,115,825 | -221,754 |
| 2021 | 3,204,673 | -1,377 | 917,928 | -85,185 |
| 2020 | 3,199,718 | 38,866 | 1,253,741 | -47,014 |
| 2019 | 3,132,780 | -10,807 | 1,352,703 | -6,208 |
| 2018 | 3,015,231 | 9,302 | 1,495,843 | -163,602 |
| 2017 | 2,899,143 | 71,766 | 1,622,444 | -263,593 |
| 2016 | 2,809,889 | 115,823 | 1,718,232 | -309,251 |
| 2015 | 2,713,529 | 62,785 | 1,827,180 | -390,702 |
| 2014 | 2,623,647 | 103,122 | 1,851,828 | -196,524 |
| 2013 | 2,546,020 | 80,955 | 1,944,758 | -218,439 |
| 2012 | 2,533,398 | 119,517 | 1,979,568 | 95,702 |
| 2011 | 2,527,811 | 116,793 | 2,018,419 | -240,005 |
| 2010 | 2,498,048 | 80,213 | 2,030,979 | 13,556 |
| 2009 | 2,467,118 | 16,315 | 2,025,580 | -164,411 |
| 2008 | 2,465,283 | -20,780 | 2,007,584 | -498,480 |
| 2007 | 2,436,753 | -381 | 1,964,673 | -225,977 |
| 2006 | 2,393,585 | -30,512 | 1,960,246 | -566,647 |
| 2005 | 2,353,375 | -44,421 | 1,918,484 | -326,063 |
| 2004 | 2,296,999 | -25,430 | 1,924,265 | -273,743 |
| 2003 | 2,231,223 | -13,744 | 1,922,904 | -248,066 |
| 2002 | 2,189,683 | -12,925 | 1,919,556 | -268,520 |
| 2001 | 2,137,791 | -19,063 | 1,931,169 | -247,496 |
| 2000 | 2,083,622 | -49,891 | 1,902,330 | -33,868 |
| 1999 | 2,010,987 | 29,142 | 1,894,147 | -18,323 |
| 1998 | 1,984,989 | -3,011 | 1,870,371 | 178,274 |
| 1997 | 1,945,112 | -9,119 | 1,861,098 | -145,334 |
| 1996 | 1,896,364 | 41,456 | 1,849,587 | -128,251 |
| 1995 | 1,831,068 | 91,727 | 1,846,900 | -280,327 |
| 1994 | 1,788,133 | 140,715 | 1,813,827 | -326,539 |
| 1993 | 1,734,851 | 141,545 | 1,788,414 | -298,337 |
| 1992 | 1,673,839 | 160,106 | 1,769,259 | -50,338 |
| 1991 | 1,579,416 | 859,737 | 1,782,165 | -413,300 |
| 1990 | 1,479,663 | 296,014 | 1,749,622 | -63,296 |
| 1989 | 1,441,769 | 242,614 | 1,728,354 | -235,884 |
| 1988 | 1,393,356 | 379,966 | 1,707,402 | -147,523 |
| 1987 | 1,356,853 | 251,387 | 1,671,330 | -68,149 |
| 1986 | 1,050,277 | 186,227 | 1,631,491 | -209,835 |
| 1985 | 997,050 | 157,476 | 1,614,042 | -171,539 |
| 1984 | 920,670 | 137,632 | 1,579,872 | -48,739 |
| 1983 | 863,472 | 68,022 | 1,542,194 | -10,229 |
| 1982 | 1,080,853 | 66,702 | 1,485,790 | -19,912 |
| 1981 | 1,018,838 | 628,135 | 1,436,599 | -134,484 |
| 1980 | 1,007,516 | -903,529 | 1,413,735 | -179,832 |
| 1979 | 987,203 | -711,455 | 1,394,056 | -154,684 |
| 1978 | 943,388 | -210,991 | 1,364,661 | -140,372 |
| 1977 | 929,381 | -527,133 | 1,314,002 | -123,608 |
| 1976 | 899,577 | -36,125 | 1,258,286 | -115,730 |
| 1975 | 801,425 | -42,540 | 1,239,069 | -220,296 |
| 1974 | 777,306 | -4,232 | 1,218,884 | -344,674 |
| 1973 | 807,535 | 347 | 1,206,285 | -320,091 |
| 1972 | 779,808 | -3,375 | 1,206,414 | -321,491 |
| 1971 | 787,047 | -14,510 | 1,210,256 | -315,363 |
| 1970 | 760,821 | 8,589 | 1,198,944 | -300,923 |
| 1969 | 736,428 | 7,258 | 1,186,306 | -161,517 |
| 1968 | 715,602 | 9,992 | 1,172,146 | -152,017 |
| 1967 | 695,283 | 14,437 | 1,166,704 | -152,812 |
| 1966 | 616,281 | 9,160 | 1,156,498 | -162,127 |
| 1965 | 642,359 | 16,348 | 1,146,094 | -156,782 |
| 1964 | 618,667 | 10,749 | 1,131,586 | -156,342 |
| 1963 | 590,998 | 9,418 | 1,116,591 | -155,267 |
| 1962 | 563,650 | 8,960 | 1,091,953 | -150,903 |
| 1961 | 538,518 | 6,938 | 1,064,377 | -143,597 |
| 1960 | 511,694 | 1,696 | 1,036,017 | -155,354 |
Data sources: World Bank | Health (1960–2025, retrieved 2026-07-08).
GeoRank.org/population/ethiopia/philippines | CC BY
Over the last 10 years, 99.1% of the population change in Ethiopia is from natural causes (a gain of 30,993,135 people) and 0.93% is from migration (a gain of 292,435 people). In the Philippines 88.2% is from natural causes (a gain of 13,533,489 people) and 11.8% is from migration (a loss of 1,811,966 people).
As of 2024, 1,168,455 residents or 0.9% of the population were not native-born in Ethiopia, compared to 87,212 people or 0.1% in the Philippines.
Biggest cities by population
|
Ethiopia
|
|
|---|---|
| City | Population |
| Addis Ababa | 5.7M |
| Gondar | 324K |
| Mekelle | 324K |
| Awasa | 300K |
| Dire Dawa | 277K |
| Bahir Dar | 243K |
| Dessie | 188K |
| Jimma | 178K |
| Harar | 157K |
| Jijiga | 126K |
|
Philippines
|
|
|---|---|
| City | Population |
| Quezon | 3.08M |
| Manila | 1.9M |
| Davao | 1.85M |
| Caloocan | 1.71M |
| Taguig | 1.31M |
| Zamboanga | 1.02M |
| Palawan | 969K |
| Cebu | 965K |
| Antipolo | 914K |
| Pasig | 853K |
Compare countries by 7 more topics
Population differences between Ethiopia and the Philippines
|
Ethiopia
|
Philippines
|
|
|---|---|---|
| Life expectancy | 68.1 years | 70.2 years |
| Average age | 24 years | 30 years |
| Median age | 20.1 years | 27.2 years |
| Male:Female ratio | 50.1:49.9 | 49.9:50.1 |
| Fertility rate | 3.91 births per woman | 1.89 births per woman |
| Population density | 319 ppl/mi² | 1,023 ppl/mi² |
Population map with other countries
Data sources: World Bank | Health (1960–2025, retrieved 2026-07-08); United Nations | World Population Prospects (1960–2026, retrieved 2026-07-08); U.S. Census Bureau (1960–2025, retrieved 2026-07-08); Central Intelligence Agency (CIA) (2000–2019, retrieved 2026-07-08).
GeoRank.org/population/ethiopia/philippines | CC BY
Help us show the world through your eyes
Share a photo of your city and help others discover what it looks like to live there. Your contribution makes our data come alive.
Data sources:
- World Bank | Health (1960–2025, retrieved 2026-07-08)
- United Nations | World Population Prospects (1960–2100, retrieved 2026-07-08)
- U.S. Census Bureau (1960–2025, retrieved 2026-07-08)
- Wikidata (2026, retrieved 2026-07-08)
- Central Intelligence Agency (CIA) (2000–2019, retrieved 2026-07-08)
Creative Commons Attribution (CC BY) — you’re free to copy, share, remix, adapt, and use even commercially as long as you give appropriate credit and clearly indicate if you made changes. Other sources may be subject to different license terms.