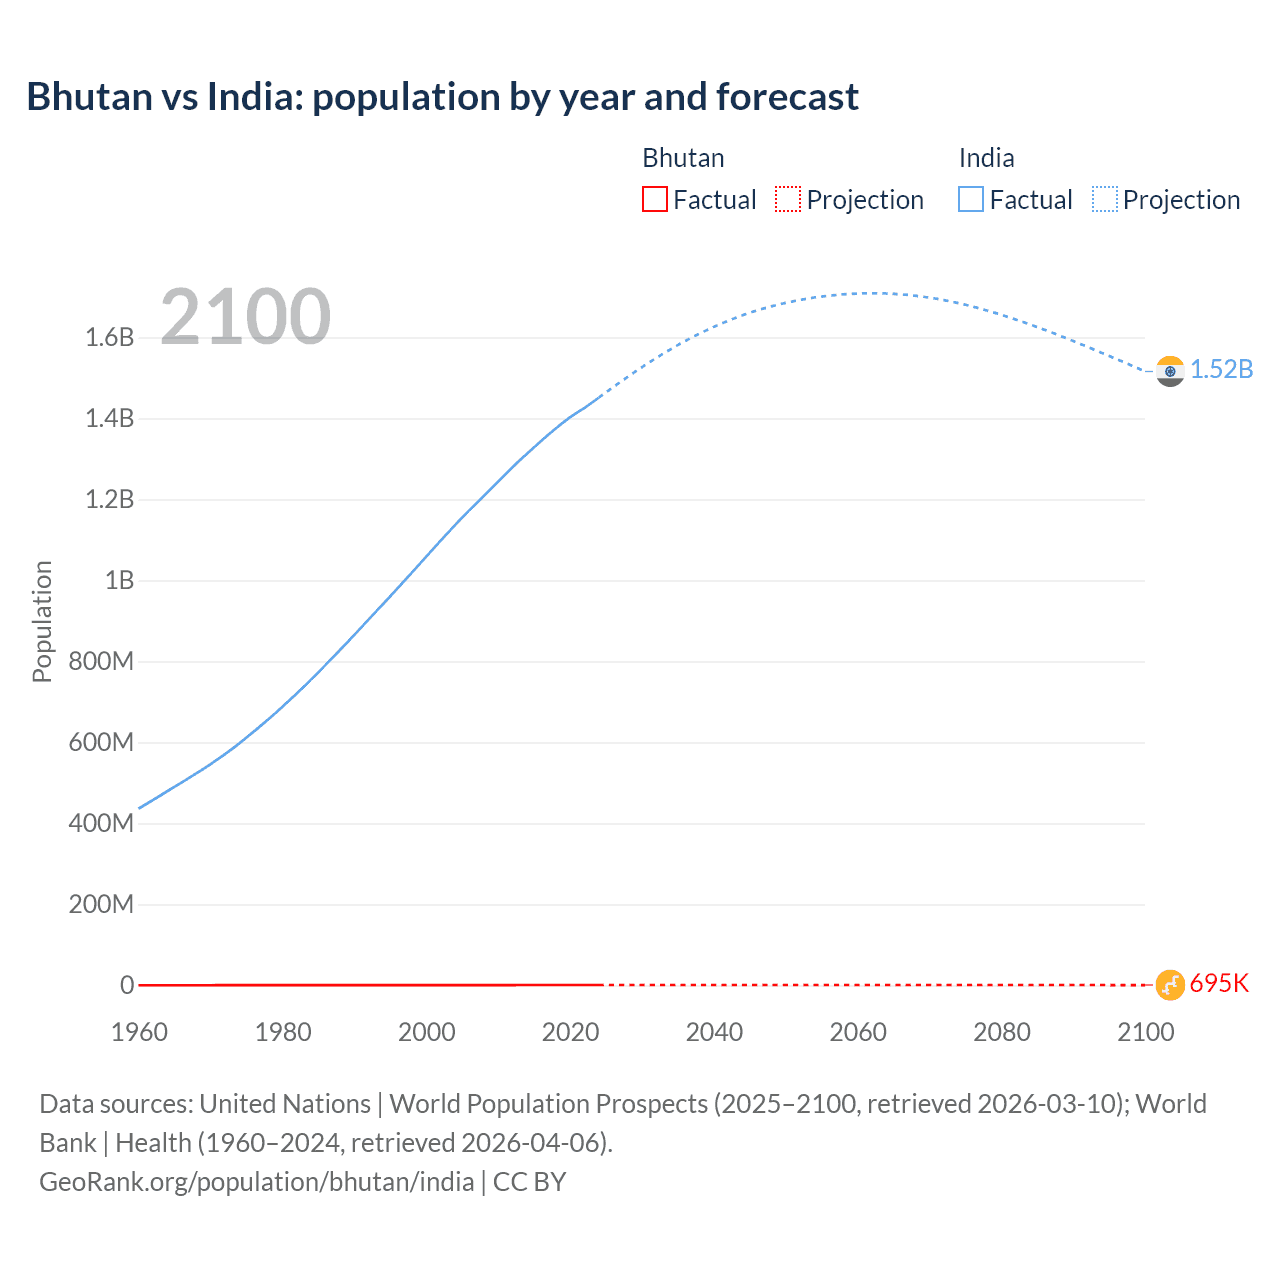
The latest officially reported population of Bhutan was 796,682 in 2025 vs 1,463,865,525 people in India in 2025. In 2026, based on the adjusted UN estimation, the current Bhutan's population is 805,057 people compared to 1,483,314,140 in India.
Population statistics:
- India's population is 1,842 times bigger than Bhutan's.
- Bhutan is ranked the 163rd most populous country in the world, while India is the 1st.
- The countries together account for 17.9% of the world: 0.01% for Bhutan vs 17.9% for India.
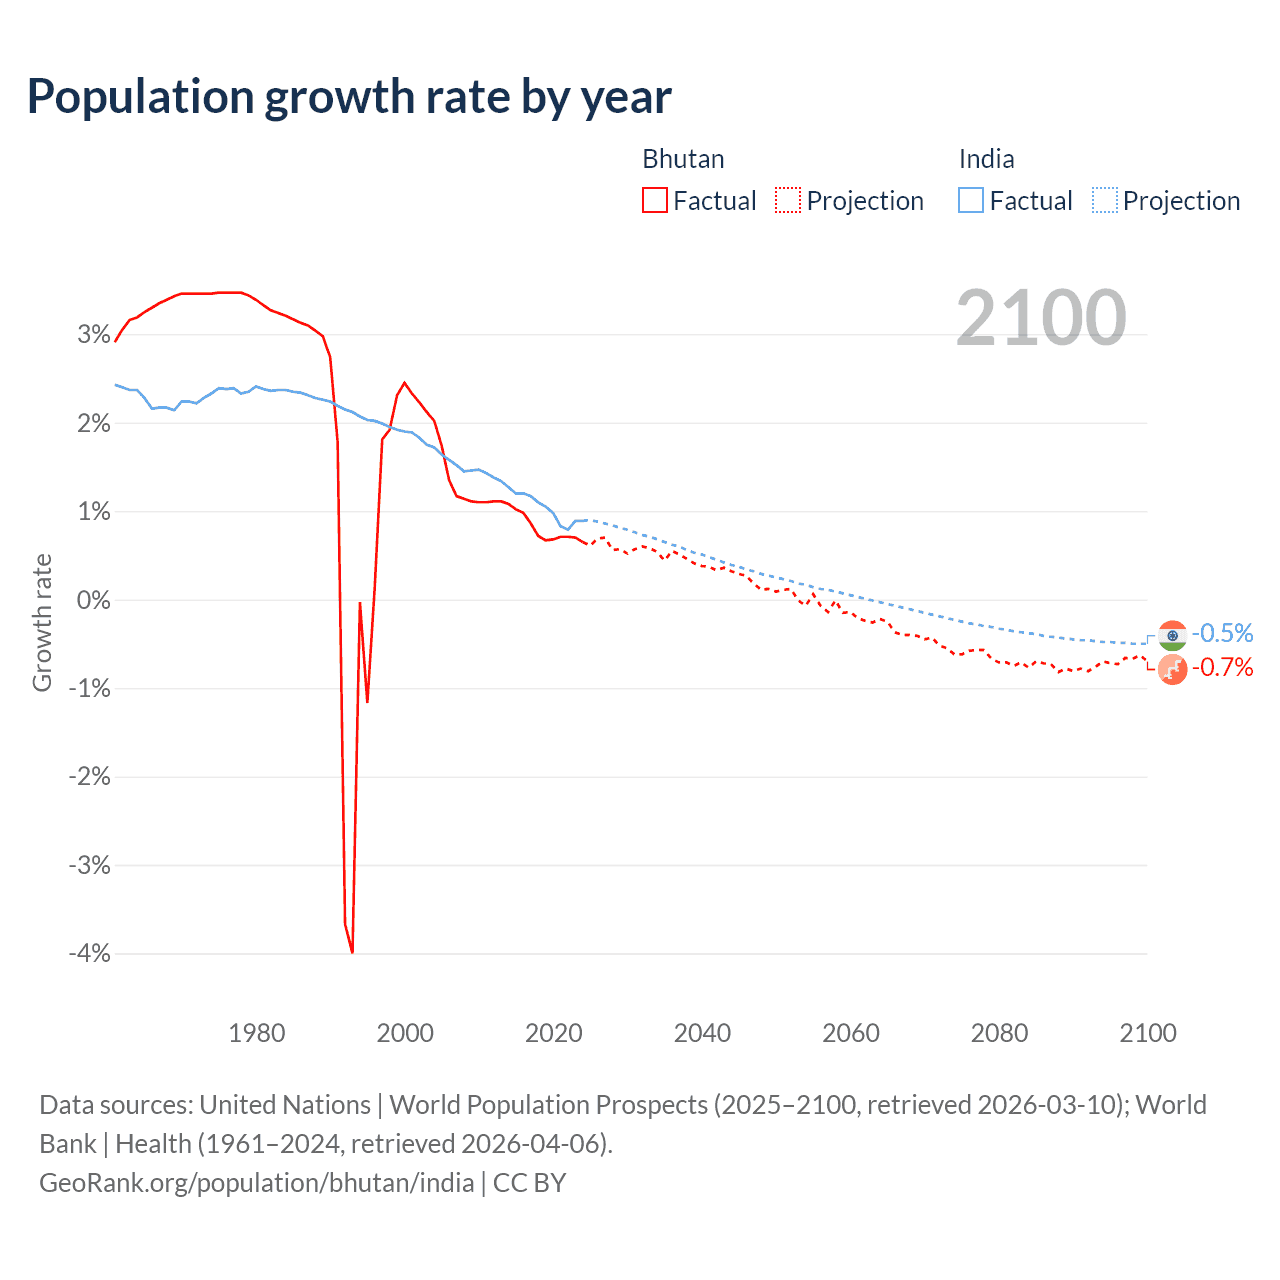
- For the last 10 years, Bhutan has had an average growth rate of +0.76% per year vs +1% in India.
- Since 2006, the population of Bhutan has increased from 671K people to 805K (20% growth), while India has grown from 1.17B to 1.48B (26.5% growth).
Bhutan vs India: population by year and forecast
| Year | Population | |
|---|---|---|
 Bhutan
|
 India
India
|
|
| 2100 | 695,373 | 1,515,764,791 |
| 2099 | 700,252 | 1,523,450,562 |
| 2098 | 704,725 | 1,531,147,367 |
| 2097 | 709,503 | 1,538,780,583 |
| 2096 | 714,205 | 1,546,380,447 |
| 2095 | 719,429 | 1,553,964,615 |
| 2094 | 724,680 | 1,561,496,245 |
| 2093 | 729,780 | 1,568,975,448 |
| 2092 | 735,358 | 1,576,332,553 |
| 2091 | 741,359 | 1,583,655,135 |
| 2090 | 747,224 | 1,590,899,630 |
| 2089 | 753,299 | 1,598,026,427 |
| 2088 | 759,229 | 1,605,029,461 |
| 2087 | 765,529 | 1,611,883,136 |
| 2086 | 771,180 | 1,618,654,560 |
| 2085 | 776,734 | 1,625,282,641 |
| 2084 | 782,193 | 1,631,712,094 |
| 2083 | 788,231 | 1,637,989,363 |
| 2082 | 793,848 | 1,644,062,886 |
| 2081 | 799,837 | 1,649,962,836 |
| 2080 | 805,584 | 1,655,654,966 |
| 2079 | 811,372 | 1,661,116,882 |
| 2078 | 816,844 | 1,666,332,415 |
| 2077 | 821,563 | 1,671,298,348 |
| 2076 | 826,295 | 1,676,004,895 |
| 2075 | 831,127 | 1,680,459,350 |
| 2074 | 836,339 | 1,684,595,952 |
| 2073 | 841,532 | 1,688,431,647 |
| 2072 | 846,187 | 1,691,990,872 |
| 2071 | 850,589 | 1,695,203,041 |
| 2070 | 854,258 | 1,698,107,519 |
| 2069 | 858,138 | 1,700,664,858 |
| 2068 | 861,658 | 1,702,876,723 |
| 2067 | 865,086 | 1,704,723,837 |
| 2066 | 868,594 | 1,706,198,000 |
| 2065 | 871,852 | 1,707,391,009 |
| 2064 | 874,071 | 1,708,212,818 |
| 2063 | 876,010 | 1,708,696,045 |
| 2062 | 878,276 | 1,708,862,369 |
| 2061 | 880,361 | 1,708,717,131 |
| 2060 | 882,252 | 1,708,195,453 |
| 2059 | 883,530 | 1,707,339,651 |
| 2058 | 884,855 | 1,706,165,210 |
| 2057 | 884,952 | 1,704,656,327 |
| 2056 | 886,162 | 1,702,865,262 |
| 2055 | 886,744 | 1,700,741,939 |
| 2054 | 886,243 | 1,698,325,374 |
| 2053 | 886,861 | 1,695,513,304 |
| 2052 | 886,981 | 1,692,384,182 |
| 2051 | 885,891 | 1,688,910,288 |
| 2050 | 884,875 | 1,685,088,884 |
| 2049 | 884,076 | 1,680,936,533 |
| 2048 | 882,979 | 1,676,430,514 |
| 2047 | 881,999 | 1,671,532,064 |
| 2046 | 880,375 | 1,666,226,180 |
| 2045 | 878,014 | 1,660,522,084 |
| 2044 | 875,491 | 1,654,412,346 |
| 2043 | 872,718 | 1,647,924,060 |
| 2042 | 869,582 | 1,640,993,579 |
| 2041 | 866,699 | 1,633,629,291 |
| 2040 | 863,505 | 1,625,848,393 |
| 2039 | 860,257 | 1,617,677,625 |
| 2038 | 856,758 | 1,609,097,629 |
| 2037 | 852,802 | 1,600,073,012 |
| 2036 | 848,448 | 1,590,593,050 |
| 2035 | 843,771 | 1,580,726,905 |
| 2034 | 840,103 | 1,570,491,868 |
| 2033 | 835,629 | 1,559,906,905 |
| 2032 | 830,792 | 1,548,963,391 |
| 2031 | 825,846 | 1,537,676,208 |
| 2030 | 821,204 | 1,526,059,268 |
| 2029 | 816,969 | 1,514,142,607 |
| 2028 | 812,314 | 1,501,971,477 |
| 2027 | 807,785 | 1,489,498,223 |
| 2026 | 802,177 | 1,476,782,637 |
| 2025 | 796,682 | 1,463,865,525 |
| 2024 | 791,524 | 1,450,935,791 |
| 2023 | 786,385 | 1,438,069,596 |
| 2022 | 780,914 | 1,425,423,212 |
| 2021 | 775,442 | 1,414,203,896 |
| 2020 | 770,006 | 1,402,617,695 |
| 2019 | 764,824 | 1,389,030,312 |
| 2018 | 759,759 | 1,374,659,064 |
| 2017 | 754,335 | 1,359,657,400 |
| 2016 | 747,866 | 1,343,944,296 |
| 2015 | 740,618 | 1,328,024,498 |
| 2014 | 733,139 | 1,312,277,191 |
| 2013 | 725,273 | 1,295,829,511 |
| 2012 | 717,279 | 1,278,674,502 |
| 2011 | 709,377 | 1,261,224,954 |
| 2010 | 701,632 | 1,243,481,564 |
| 2009 | 693,988 | 1,225,524,753 |
| 2008 | 686,351 | 1,207,930,964 |
| 2007 | 678,641 | 1,190,676,021 |
| 2006 | 670,799 | 1,172,878,890 |
| 2005 | 661,865 | 1,154,676,322 |
| 2004 | 650,544 | 1,135,991,513 |
| 2003 | 637,663 | 1,116,803,006 |
| 2002 | 624,409 | 1,097,600,380 |
| 2001 | 610,794 | 1,077,898,575 |
| 2000 | 596,863 | 1,057,922,733 |
| 1999 | 582,579 | 1,038,225,823 |
| 1998 | 569,435 | 1,018,665,080 |
| 1997 | 558,697 | 999,133,762 |
| 1996 | 548,784 | 979,678,458 |
| 1995 | 547,989 | 960,301,044 |
| 1994 | 554,497 | 941,163,767 |
| 1993 | 554,673 | 922,118,387 |
| 1992 | 577,774 | 902,957,070 |
| 1991 | 599,784 | 883,927,600 |
| 1990 | 589,287 | 864,972,221 |
| 1989 | 573,586 | 846,039,529 |
| 1988 | 556,986 | 827,342,990 |
| 1987 | 540,557 | 808,931,270 |
| 1986 | 524,324 | 790,689,978 |
| 1985 | 508,392 | 772,647,793 |
| 1984 | 492,784 | 754,875,449 |
| 1983 | 477,460 | 737,372,681 |
| 1982 | 462,485 | 720,313,473 |
| 1981 | 447,836 | 703,696,250 |
| 1980 | 433,404 | 687,354,025 |
| 1979 | 419,200 | 671,155,747 |
| 1978 | 405,243 | 655,728,229 |
| 1977 | 391,639 | 640,801,103 |
| 1976 | 378,490 | 625,861,883 |
| 1975 | 365,791 | 611,309,535 |
| 1974 | 353,538 | 597,041,391 |
| 1973 | 341,705 | 583,465,598 |
| 1972 | 330,264 | 570,482,142 |
| 1971 | 319,211 | 558,096,387 |
| 1970 | 308,528 | 545,864,268 |
| 1969 | 298,214 | 533,880,544 |
| 1968 | 288,311 | 522,716,889 |
| 1967 | 278,852 | 511,606,372 |
| 1966 | 269,820 | 500,740,247 |
| 1965 | 261,200 | 490,140,146 |
| 1964 | 252,987 | 479,229,598 |
| 1963 | 245,156 | 468,138,575 |
| 1962 | 237,636 | 457,283,090 |
| 1961 | 230,602 | 446,564,729 |
| 1960 | 224,084 | 435,990,338 |
Data sources: United Nations | World Population Prospects (2026–2100, retrieved 2026-07-08); World Bank | Health (1960–2025, retrieved 2026-07-08).
GeoRank.org/population/bhutan/india | CC BY 
From 2006 to 2016, the population of Bhutan increased by 77,067 people (a 11.5% growth), while India gained 171,065,406 people (a 14.6% growth).
For the next 10 years, from 2016 to 2026, Bhutan gained 57,191 people (a 7.65% growth), while India's population increased by 139,369,844 people (a 10.4% growth).
Bhutan was ranked 161st most populous country in 2006 and is 163rd in 2026. India was ranked 2nd in 2006 and ranked 1st now.
The UN's World Population Prospects forecasts that in 24 years (in 2050) Bhutan's population will grow by 9.91% to 884,875 people and will still be ranked 163rd. The population of India will increase by 13.6% to 1,685,088,884 people and will still be ranked 1st.
Bhutan is projected to reach its peak in 2052 at 887K people compared to the peak of 1.71B people in 2062 for India.
Population growth rate by year
| Year | Growth rate | |
|---|---|---|
|
Bhutan
|
India
|
|
| 2100 | -0.7% | -0.5% |
| 2099 | -0.63% | -0.5% |
| 2098 | -0.67% | -0.5% |
| 2097 | -0.66% | -0.49% |
| 2096 | -0.73% | -0.49% |
| 2095 | -0.72% | -0.48% |
| 2094 | -0.7% | -0.48% |
| 2093 | -0.76% | -0.47% |
| 2092 | -0.81% | -0.46% |
| 2091 | -0.78% | -0.46% |
| 2090 | -0.81% | -0.45% |
| 2089 | -0.78% | -0.44% |
| 2088 | -0.82% | -0.43% |
| 2087 | -0.73% | -0.42% |
| 2086 | -0.72% | -0.41% |
| 2085 | -0.7% | -0.39% |
| 2084 | -0.77% | -0.38% |
| 2083 | -0.71% | -0.37% |
| 2082 | -0.75% | -0.36% |
| 2081 | -0.71% | -0.34% |
| 2080 | -0.71% | -0.33% |
| 2079 | -0.67% | -0.31% |
| 2078 | -0.57% | -0.3% |
| 2077 | -0.57% | -0.28% |
| 2076 | -0.58% | -0.27% |
| 2075 | -0.62% | -0.25% |
| 2074 | -0.62% | -0.23% |
| 2073 | -0.55% | -0.21% |
| 2072 | -0.52% | -0.19% |
| 2071 | -0.43% | -0.17% |
| 2070 | -0.45% | -0.15% |
| 2069 | -0.41% | -0.13% |
| 2068 | -0.4% | -0.11% |
| 2067 | -0.4% | -0.09% |
| 2066 | -0.37% | -0.07% |
| 2065 | -0.25% | -0.05% |
| 2064 | -0.22% | -0.03% |
| 2063 | -0.26% | -0.01% |
| 2062 | -0.24% | 0.008% |
| 2061 | -0.21% | 0.03% |
| 2060 | -0.14% | 0.05% |
| 2059 | -0.15% | 0.07% |
| 2058 | -0.01% | 0.09% |
| 2057 | -0.14% | 0.11% |
| 2056 | -0.07% | 0.12% |
| 2055 | 0.06% | 0.14% |
| 2054 | -0.07% | 0.17% |
| 2053 | -0.01% | 0.18% |
| 2052 | 0.12% | 0.21% |
| 2051 | 0.11% | 0.23% |
| 2050 | 0.09% | 0.25% |
| 2049 | 0.12% | 0.27% |
| 2048 | 0.11% | 0.29% |
| 2047 | 0.18% | 0.32% |
| 2046 | 0.27% | 0.34% |
| 2045 | 0.29% | 0.37% |
| 2044 | 0.32% | 0.39% |
| 2043 | 0.36% | 0.42% |
| 2042 | 0.33% | 0.45% |
| 2041 | 0.37% | 0.48% |
| 2040 | 0.38% | 0.51% |
| 2039 | 0.41% | 0.53% |
| 2038 | 0.46% | 0.56% |
| 2037 | 0.51% | 0.6% |
| 2036 | 0.55% | 0.62% |
| 2035 | 0.44% | 0.65% |
| 2034 | 0.54% | 0.68% |
| 2033 | 0.58% | 0.71% |
| 2032 | 0.6% | 0.73% |
| 2031 | 0.57% | 0.76% |
| 2030 | 0.52% | 0.79% |
| 2029 | 0.57% | 0.81% |
| 2028 | 0.56% | 0.84% |
| 2027 | 0.7% | 0.86% |
| 2026 | 0.69% | 0.88% |
| 2025 | 0.65% | 0.89% |
| 2024 | 0.65% | 0.89% |
| 2023 | 0.7% | 0.89% |
| 2022 | 0.71% | 0.79% |
| 2021 | 0.71% | 0.83% |
| 2020 | 0.68% | 0.98% |
| 2019 | 0.67% | 1.05% |
| 2018 | 0.72% | 1.1% |
| 2017 | 0.86% | 1.17% |
| 2016 | 0.98% | 1.2% |
| 2015 | 1.02% | 1.2% |
| 2014 | 1.08% | 1.27% |
| 2013 | 1.11% | 1.34% |
| 2012 | 1.11% | 1.38% |
| 2011 | 1.1% | 1.43% |
| 2010 | 1.1% | 1.47% |
| 2009 | 1.11% | 1.46% |
| 2008 | 1.14% | 1.45% |
| 2007 | 1.17% | 1.52% |
| 2006 | 1.35% | 1.58% |
| 2005 | 1.74% | 1.64% |
| 2004 | 2.02% | 1.72% |
| 2003 | 2.12% | 1.75% |
| 2002 | 2.23% | 1.83% |
| 2001 | 2.33% | 1.89% |
| 2000 | 2.45% | 1.9% |
| 1999 | 2.31% | 1.92% |
| 1998 | 1.92% | 1.95% |
| 1997 | 1.81% | 1.99% |
| 1996 | 0.15% | 2.02% |
| 1995 | -1.17% | 2.03% |
| 1994 | -0.03% | 2.07% |
| 1993 | -4% | 2.12% |
| 1992 | -3.67% | 2.15% |
| 1991 | 1.78% | 2.19% |
| 1990 | 2.74% | 2.24% |
| 1989 | 2.98% | 2.26% |
| 1988 | 3.04% | 2.28% |
| 1987 | 3.1% | 2.31% |
| 1986 | 3.13% | 2.34% |
| 1985 | 3.17% | 2.35% |
| 1984 | 3.21% | 2.37% |
| 1983 | 3.24% | 2.37% |
| 1982 | 3.27% | 2.36% |
| 1981 | 3.33% | 2.38% |
| 1980 | 3.39% | 2.41% |
| 1979 | 3.44% | 2.35% |
| 1978 | 3.47% | 2.33% |
| 1977 | 3.47% | 2.39% |
| 1976 | 3.47% | 2.38% |
| 1975 | 3.47% | 2.39% |
| 1974 | 3.46% | 2.33% |
| 1973 | 3.46% | 2.28% |
| 1972 | 3.46% | 2.22% |
| 1971 | 3.46% | 2.24% |
| 1970 | 3.46% | 2.24% |
| 1969 | 3.43% | 2.14% |
| 1968 | 3.39% | 2.17% |
| 1967 | 3.35% | 2.17% |
| 1966 | 3.3% | 2.16% |
| 1965 | 3.25% | 2.28% |
| 1964 | 3.19% | 2.37% |
| 1963 | 3.16% | 2.37% |
| 1962 | 3.05% | 2.4% |
| 1961 | 2.91% | 2.43% |
Data sources: United Nations | World Population Prospects (2026–2100, retrieved 2026-07-08); World Bank | Health (1961–2025, retrieved 2026-07-08).
GeoRank.org/population/bhutan/india | CC BY
In 2025, the population of Bhutan grew by 0.65%, while India's population grew by 0.89%.
Live population counters
|
Bhutan
|
India
|
|
|---|---|---|
| Current population |
805057
|
1483314140
|
| Population rank | 163/197 | 1/197 |
| Percent of world population | 0.01% | 17.9% |
| One net population change |
1.7 hours
|
2.45 seconds
|
| One birth every |
53 minutes
|
1.36 seconds
|
| One death every |
1.83 hours
|
3.3 seconds
|
| Daily growth/decline | +14 | +35,424 |
| Annual growth/decline | +5,158 | +12,929,734 |
| Annual growth/decline rate | +0.65% | +0.89% |
| Population growth rate rank | 120/197 | 106/197 |
| One migration net change every |
19.3 hours
|
1.06 minutes
|
| Annual migration change | +455 | -495,753 |
| Net migration rank | 69/196 | 195/196 |
| Foreign-born residents | 55,705 | 4,796,255 |
| Foreign-born residents rank | 146/195 | 15/195 |
| Foreign-born share of population | 7% | 0.3% |
| Foreign-born share rank | 80/195 | 181/195 |
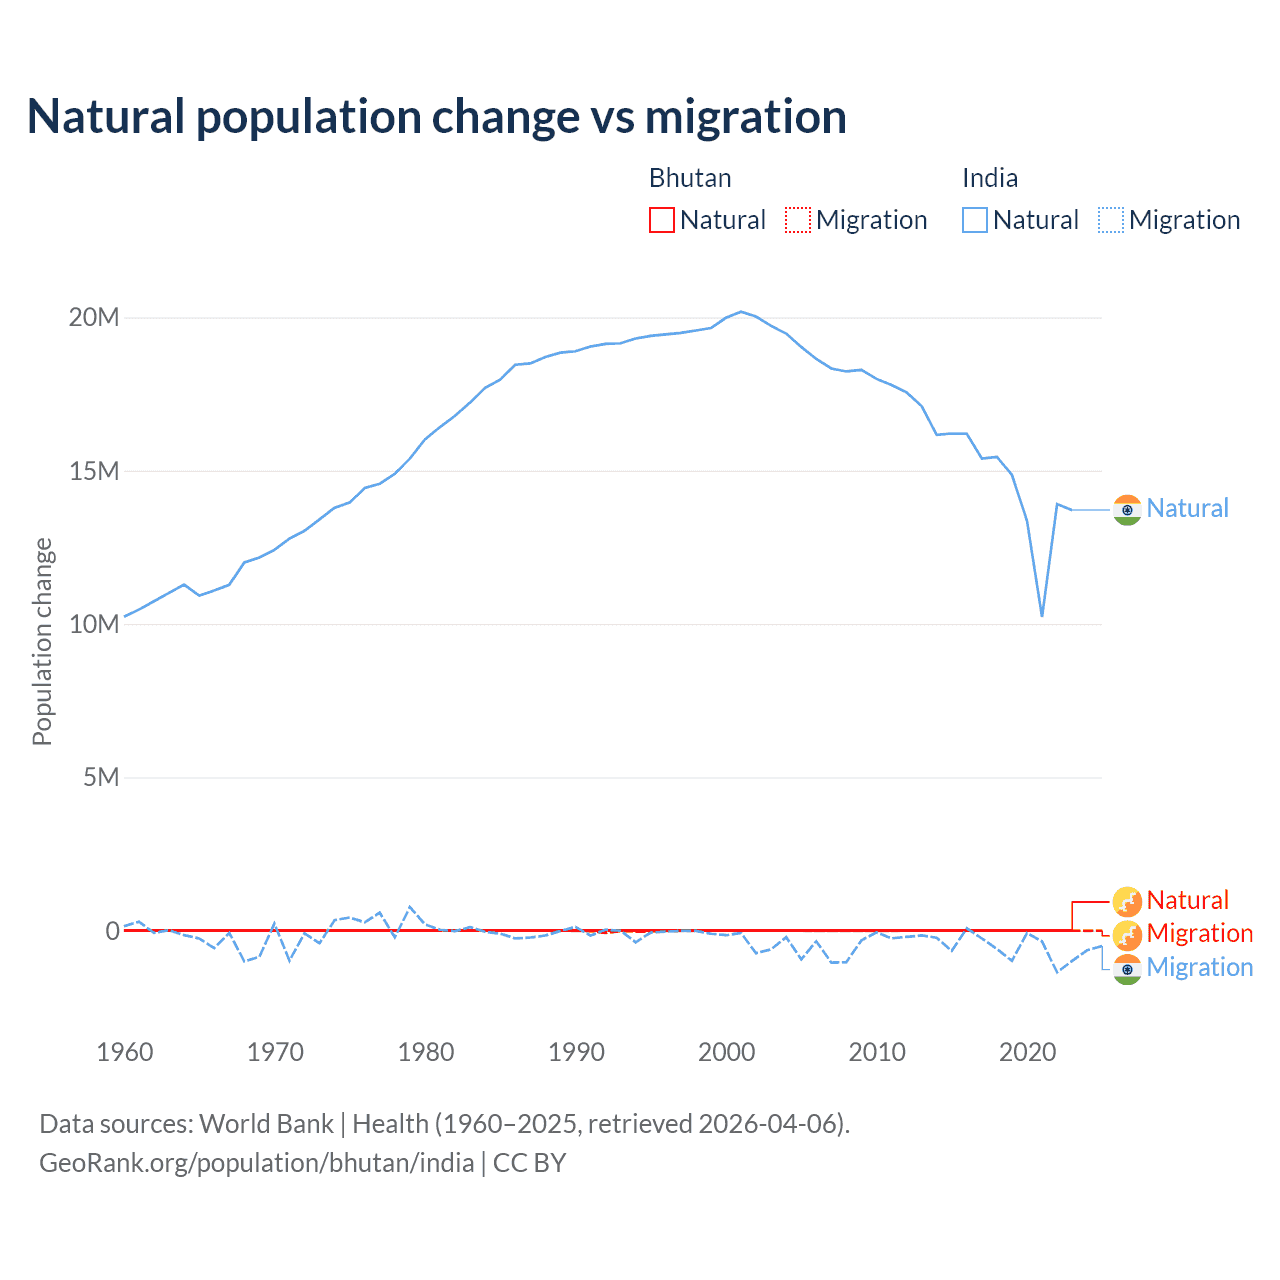
Natural population change vs migration
| Year | Population change | |||
|---|---|---|---|---|
|
Bhutan
|
India
|
|||
| Natural | Migration | Natural | Migration | |
| 2025 | - | 455 | - | -495,753 |
| 2024 | 5,113 | -277 | 13,630,090 | -630,830 |
| 2023 | 5,153 | 291 | 13,711,993 | -979,179 |
| 2022 | 5,204 | 291 | 13,912,130 | -1,353,478 |
| 2021 | 5,162 | 287 | 10,227,523 | -348,916 |
| 2020 | 5,142 | 287 | 13,366,946 | -73,806 |
| 2019 | 4,643 | 287 | 14,859,846 | -978,969 |
| 2018 | 4,909 | 287 | 15,451,168 | -589,794 |
| 2017 | 5,367 | 287 | 15,394,041 | -251,642 |
| 2016 | 6,164 | 1,116 | 16,202,593 | 81,248 |
| 2015 | 6,762 | 450 | 16,211,195 | -655,085 |
| 2014 | 7,290 | 452 | 16,165,943 | -227,263 |
| 2013 | 7,689 | 309 | 17,107,541 | -151,372 |
| 2012 | 7,967 | 20 | 17,552,365 | -198,935 |
| 2011 | 8,282 | -464 | 17,793,362 | -247,017 |
| 2010 | 8,598 | -922 | 17,991,935 | -50,905 |
| 2009 | 8,913 | -1,305 | 18,286,055 | -312,905 |
| 2008 | 9,200 | -1,538 | 18,234,926 | -1,020,047 |
| 2007 | 9,322 | -1,553 | 18,331,648 | -1,037,200 |
| 2006 | 9,197 | -1,283 | 18,641,737 | -342,177 |
| 2005 | 9,102 | 848 | 19,034,839 | -929,454 |
| 2004 | 9,056 | 3,642 | 19,469,758 | -206,660 |
| 2003 | 9,132 | 3,921 | 19,720,507 | -606,970 |
| 2002 | 9,464 | 3,996 | 20,024,621 | -732,419 |
| 2001 | 9,904 | 3,874 | 20,182,573 | -70,346 |
| 2000 | 10,142 | 3,940 | 19,984,160 | -143,960 |
| 1999 | 10,940 | 3,542 | 19,648,424 | -95,320 |
| 1998 | 11,320 | 486 | 19,569,575 | -1,049 |
| 1997 | 11,668 | -1,994 | 19,494,098 | 880 |
| 1996 | 12,153 | -1,998 | 19,442,699 | -26,388 |
| 1995 | 12,938 | -21,501 | 19,396,161 | -57,297 |
| 1994 | 13,536 | -17,997 | 19,310,798 | -375,253 |
| 1993 | 13,915 | -9,800 | 19,152,399 | 2,364 |
| 1992 | 15,594 | -65,900 | 19,132,757 | 35,155 |
| 1991 | 15,801 | -9,522 | 19,049,524 | -157,911 |
| 1990 | 15,704 | -1,000 | 18,893,588 | 125,514 |
| 1989 | 15,516 | 1,180 | 18,848,915 | -2,907 |
| 1988 | 15,212 | 1,286 | 18,702,916 | -155,676 |
| 1987 | 14,887 | 1,481 | 18,496,213 | -219,150 |
| 1986 | 14,516 | 1,586 | 18,455,495 | -249,545 |
| 1985 | 14,061 | 1,694 | 17,968,697 | -89,991 |
| 1984 | 13,688 | 1,779 | 17,698,810 | -32,313 |
| 1983 | 13,284 | 1,897 | 17,219,127 | 119,694 |
| 1982 | 12,872 | 1,897 | 16,790,507 | -10,687 |
| 1981 | 12,444 | 2,096 | 16,422,159 | 33,243 |
| 1980 | 12,016 | 2,307 | 16,018,786 | 210,914 |
| 1979 | 11,583 | 2,493 | 15,392,957 | 774,094 |
| 1978 | 11,133 | 2,700 | 14,898,145 | -210,444 |
| 1977 | 10,679 | 2,700 | 14,575,662 | 590,626 |
| 1976 | 10,228 | 2,700 | 14,435,504 | 275,984 |
| 1975 | 9,775 | 2,700 | 13,958,642 | 434,205 |
| 1974 | 9,324 | 2,700 | 13,795,836 | 347,869 |
| 1973 | 8,939 | 2,700 | 13,412,707 | -404,743 |
| 1972 | 8,549 | 2,700 | 13,041,792 | -82,816 |
| 1971 | 8,161 | 2,700 | 12,787,104 | -974,574 |
| 1970 | 7,791 | 2,700 | 12,417,866 | 233,782 |
| 1969 | 7,435 | 2,700 | 12,167,671 | -851,844 |
| 1968 | 7,085 | 2,593 | 12,006,807 | -995,416 |
| 1967 | 6,744 | 2,493 | 11,279,897 | -70,314 |
| 1966 | 6,418 | 2,407 | 11,089,894 | -566,982 |
| 1965 | 6,109 | 2,307 | 10,925,714 | -248,299 |
| 1964 | 5,818 | 2,196 | 11,285,378 | -141,916 |
| 1963 | 5,551 | 2,096 | 11,016,705 | 21,640 |
| 1962 | 5,297 | 2,096 | 10,743,409 | -70,514 |
| 1961 | 5,081 | 1,586 | 10,468,816 | 295,177 |
| 1960 | 4,888 | 1,481 | 10,237,489 | 146,955 |
Data sources: World Bank | Health (1960–2025, retrieved 2026-07-08).
GeoRank.org/population/bhutan/india | CC BY
Over the last 10 years, 94.2% of the population change in Bhutan is from natural causes (a gain of 53,619 people) and 5.81% is from migration (a gain of 3,306 people). In India 96.1% is from natural causes (a gain of 142,967,525 people) and 3.89% is from migration (a loss of 5,780,451 people).
As of 2024, 55,705 residents or 7% of the population were not native-born in Bhutan, compared to 4,796,255 people or 0.3% in India.
Biggest cities by population
Compare countries by 7 more topics
Population differences between Bhutan and India
|
Bhutan
|
India
|
|
|---|---|---|
| Life expectancy | 73.8 years | 72.7 years |
| Average age | 32.7 years | 32.1 years |
| Median age | 31.4 years | 29.8 years |
| Male:Female ratio | 53.4:46.6 | 51.6:48.4 |
| Fertility rate | 1.45 births per woman | 1.96 births per woman |
| Population density | 54.5 ppl/mi² | 1,286 ppl/mi² |
Population map with other countries
Data sources: World Bank | Health (1960–2025, retrieved 2026-07-08); United Nations | World Population Prospects (1960–2026, retrieved 2026-07-08); U.S. Census Bureau (1960–2025, retrieved 2026-07-08); Central Intelligence Agency (CIA) (2000–2019, retrieved 2026-07-08).
GeoRank.org/population/bhutan/india | CC BY
Help us show the world through your eyes
Share a photo of your city and help others discover what it looks like to live there. Your contribution makes our data come alive.
Data sources:
- World Bank | Health (1960–2025, retrieved 2026-07-08)
- United Nations | World Population Prospects (1960–2100, retrieved 2026-07-08)
- U.S. Census Bureau (1960–2025, retrieved 2026-07-08)
- Central Intelligence Agency (CIA) (2000–2019, retrieved 2026-07-08)
- Wikidata (2026, retrieved 2026-07-08)
Creative Commons Attribution (CC BY) — you’re free to copy, share, remix, adapt, and use even commercially as long as you give appropriate credit and clearly indicate if you made changes. Other sources may be subject to different license terms.