The latest officially reported population of San Marino was 34,109 in 2025 vs 21,756,000 people in Sri Lanka in 2025. In 2026, based on the adjusted UN estimation, the current San Marino's population is 34,159 people compared to 21,926,160 in Sri Lanka.
Population statistics:
- Sri Lanka's population is 642 times bigger than San Marino's.
- San Marino is ranked the 193rd most populous country in the world, while Sri Lanka is the 63rd.
- The countries together account for 0.26% of the world: 0.0004% for San Marino vs 0.26% for Sri Lanka.
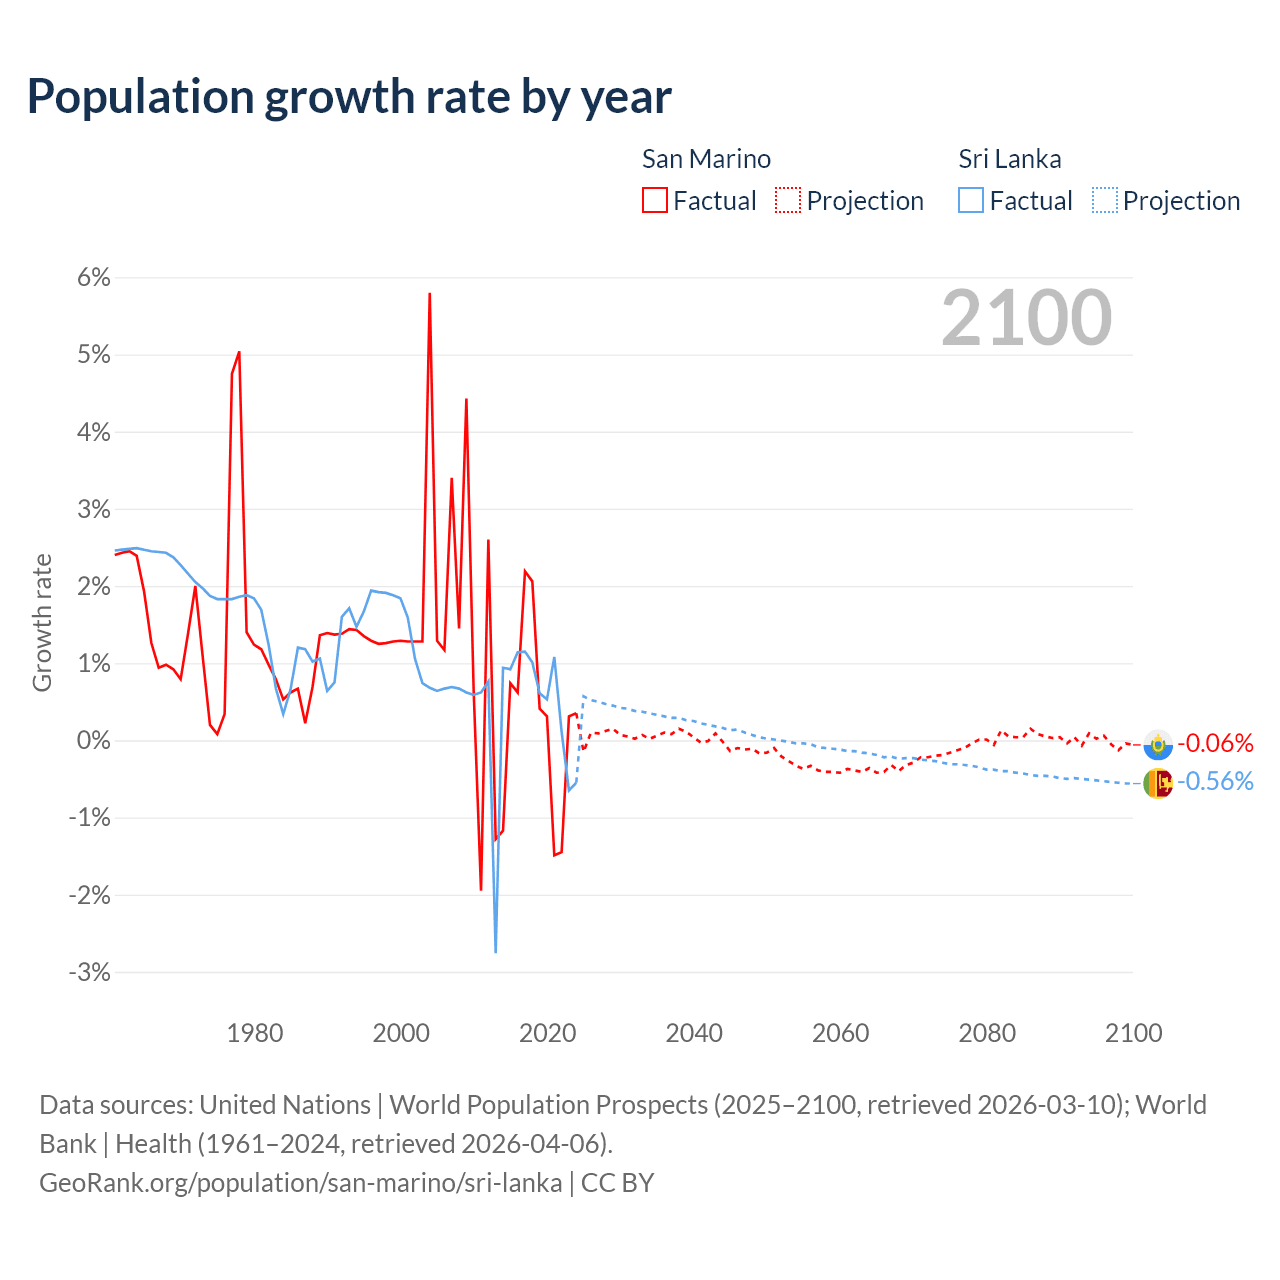
- For the last 10 years, San Marino has had an average growth rate of +0.4% per year vs +0.42% in Sri Lanka.
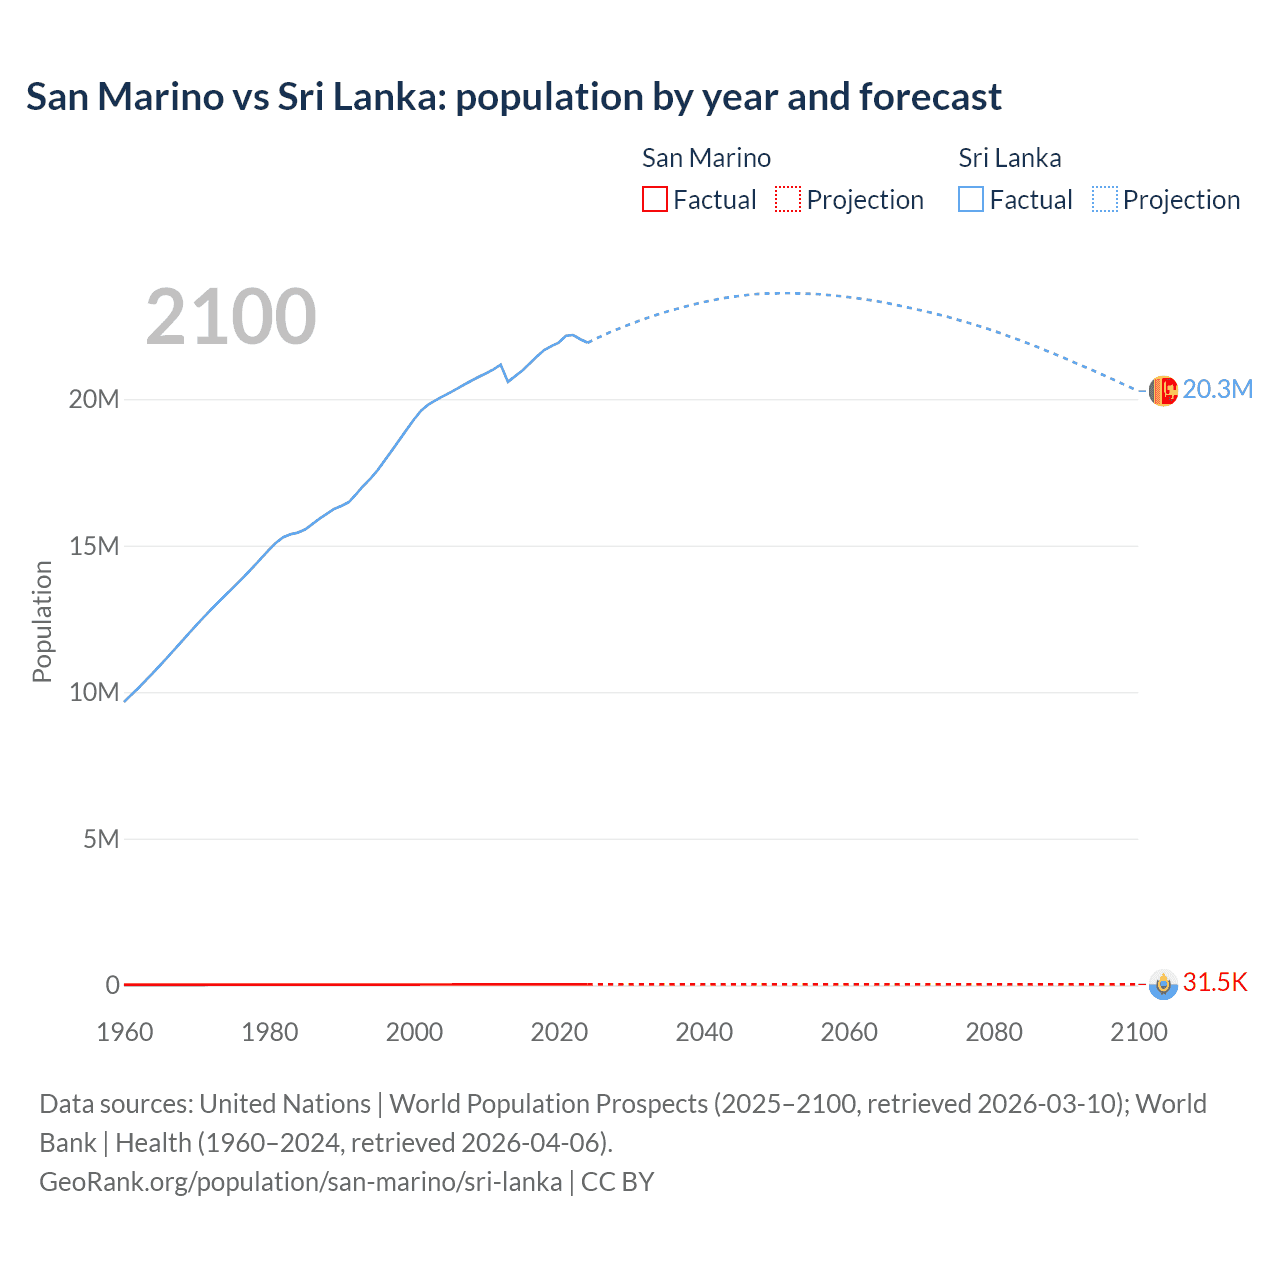
- Since 2006, the population of San Marino has increased from 30.2K people to 34.2K (13.2% growth), while Sri Lanka has grown from 20.4M to 21.9M (7.73% growth).
San Marino vs Sri Lanka: population by year and forecast
| Year | Population | |
|---|---|---|
 San Marino
|
 Sri Lanka
|
|
| 2100 | 31,687 | 20,009,380 |
| 2099 | 31,708 | 20,121,095 |
| 2098 | 31,720 | 20,234,513 |
| 2097 | 31,762 | 20,345,619 |
| 2096 | 31,780 | 20,456,607 |
| 2095 | 31,761 | 20,566,246 |
| 2094 | 31,755 | 20,674,019 |
| 2093 | 31,726 | 20,780,946 |
| 2092 | 31,748 | 20,886,274 |
| 2091 | 31,736 | 20,990,047 |
| 2090 | 31,747 | 21,095,968 |
| 2089 | 31,733 | 21,198,788 |
| 2088 | 31,725 | 21,299,229 |
| 2087 | 31,710 | 21,398,269 |
| 2086 | 31,683 | 21,496,892 |
| 2085 | 31,636 | 21,594,661 |
| 2084 | 31,623 | 21,687,323 |
| 2083 | 31,612 | 21,778,597 |
| 2082 | 31,596 | 21,866,395 |
| 2081 | 31,555 | 21,954,337 |
| 2080 | 31,573 | 22,038,953 |
| 2079 | 31,569 | 22,122,744 |
| 2078 | 31,566 | 22,200,069 |
| 2077 | 31,579 | 22,274,355 |
| 2076 | 31,612 | 22,345,857 |
| 2075 | 31,653 | 22,414,609 |
| 2074 | 31,703 | 22,485,066 |
| 2073 | 31,762 | 22,550,427 |
| 2072 | 31,825 | 22,610,645 |
| 2071 | 31,896 | 22,669,042 |
| 2070 | 31,965 | 22,725,948 |
| 2069 | 32,058 | 22,779,050 |
| 2068 | 32,160 | 22,831,596 |
| 2067 | 32,290 | 22,885,941 |
| 2066 | 32,395 | 22,935,123 |
| 2065 | 32,527 | 22,985,942 |
| 2064 | 32,664 | 23,030,844 |
| 2063 | 32,782 | 23,071,114 |
| 2062 | 32,918 | 23,107,970 |
| 2061 | 33,047 | 23,139,924 |
| 2060 | 33,170 | 23,171,649 |
| 2059 | 33,310 | 23,199,387 |
| 2058 | 33,447 | 23,224,997 |
| 2057 | 33,584 | 23,247,211 |
| 2056 | 33,717 | 23,267,292 |
| 2055 | 33,829 | 23,278,653 |
| 2054 | 33,954 | 23,287,520 |
| 2053 | 34,068 | 23,297,347 |
| 2052 | 34,161 | 23,301,287 |
| 2051 | 34,235 | 23,302,108 |
| 2050 | 34,268 | 23,299,282 |
| 2049 | 34,324 | 23,293,630 |
| 2048 | 34,382 | 23,283,465 |
| 2047 | 34,421 | 23,267,251 |
| 2046 | 34,463 | 23,244,081 |
| 2045 | 34,497 | 23,212,221 |
| 2044 | 34,546 | 23,181,041 |
| 2043 | 34,552 | 23,144,217 |
| 2042 | 34,521 | 23,103,489 |
| 2041 | 34,525 | 23,056,478 |
| 2040 | 34,534 | 23,005,928 |
| 2039 | 34,520 | 22,948,866 |
| 2038 | 34,483 | 22,888,821 |
| 2037 | 34,430 | 22,822,943 |
| 2036 | 34,403 | 22,756,462 |
| 2035 | 34,368 | 22,685,766 |
| 2034 | 34,347 | 22,611,514 |
| 2033 | 34,341 | 22,532,374 |
| 2032 | 34,316 | 22,449,310 |
| 2031 | 34,308 | 22,364,063 |
| 2030 | 34,289 | 22,273,377 |
| 2029 | 34,267 | 22,181,300 |
| 2028 | 34,215 | 22,082,826 |
| 2027 | 34,175 | 21,979,196 |
| 2026 | 34,144 | 21,870,145 |
| 2025 | 34,109 | 21,756,000 |
| 2024 | 33,977 | 21,916,000 |
| 2023 | 33,860 | 22,037,000 |
| 2022 | 33,755 | 22,181,000 |
| 2021 | 34,252 | 22,156,000 |
| 2020 | 34,770 | 21,919,000 |
| 2019 | 34,663 | 21,803,000 |
| 2018 | 34,522 | 21,670,000 |
| 2017 | 33,825 | 21,453,000 |
| 2016 | 33,101 | 21,209,000 |
| 2015 | 32,897 | 20,970,000 |
| 2014 | 32,655 | 20,778,000 |
| 2013 | 33,041 | 20,585,000 |
| 2012 | 33,469 | 21,169,458 |
| 2011 | 32,620 | 21,009,048 |
| 2010 | 33,270 | 20,879,089 |
| 2009 | 33,066 | 20,756,435 |
| 2008 | 31,662 | 20,629,378 |
| 2007 | 31,211 | 20,492,545 |
| 2006 | 30,184 | 20,352,411 |
| 2005 | 29,836 | 20,216,524 |
| 2004 | 29,457 | 20,087,605 |
| 2003 | 27,843 | 19,951,521 |
| 2002 | 27,491 | 19,805,752 |
| 2001 | 27,143 | 19,600,362 |
| 2000 | 26,799 | 19,293,054 |
| 1999 | 26,459 | 18,944,731 |
| 1998 | 26,125 | 18,596,003 |
| 1997 | 25,800 | 18,248,200 |
| 1996 | 25,482 | 17,905,018 |
| 1995 | 25,158 | 17,564,068 |
| 1994 | 24,823 | 17,275,773 |
| 1993 | 24,472 | 17,025,918 |
| 1992 | 24,125 | 16,739,284 |
| 1991 | 23,797 | 16,475,354 |
| 1990 | 23,475 | 16,352,458 |
| 1989 | 23,154 | 16,248,557 |
| 1988 | 22,843 | 16,078,621 |
| 1987 | 22,686 | 15,916,576 |
| 1986 | 22,636 | 15,731,256 |
| 1985 | 22,485 | 15,544,154 |
| 1984 | 22,346 | 15,441,860 |
| 1983 | 22,229 | 15,388,794 |
| 1982 | 22,055 | 15,286,567 |
| 1981 | 21,840 | 15,099,414 |
| 1980 | 21,585 | 14,847,974 |
| 1979 | 21,320 | 14,579,614 |
| 1978 | 21,026 | 14,310,128 |
| 1977 | 20,017 | 14,049,371 |
| 1976 | 19,110 | 13,796,770 |
| 1975 | 19,046 | 13,548,984 |
| 1974 | 19,030 | 13,305,693 |
| 1973 | 18,992 | 13,060,916 |
| 1972 | 18,787 | 12,809,205 |
| 1971 | 18,419 | 12,551,910 |
| 1970 | 18,168 | 12,287,110 |
| 1969 | 18,026 | 12,013,858 |
| 1968 | 17,861 | 11,736,088 |
| 1967 | 17,688 | 11,457,328 |
| 1966 | 17,523 | 11,183,928 |
| 1965 | 17,305 | 10,916,965 |
| 1964 | 16,977 | 10,653,397 |
| 1963 | 16,580 | 10,395,040 |
| 1962 | 16,183 | 10,143,754 |
| 1961 | 15,799 | 9,899,372 |
| 1960 | 15,428 | 9,661,389 |
Data sources: United Nations | World Population Prospects (2026–2100, retrieved 2026-07-08); World Bank | Health (1960–2025, retrieved 2026-07-08).
GeoRank.org/population/san-marino/sri-lanka | CC BY 
From 2006 to 2016, the population of San Marino increased by 2,917 people (a 9.66% growth), while Sri Lanka gained 856,589 people (a 4.21% growth).
For the next 10 years, from 2016 to 2026, San Marino gained 1,058 people (a 3.2% growth), while Sri Lanka's population increased by 717,160 people (a 3.38% growth).
San Marino was ranked 193rd most populous country in 2006 and is still 193rd in 2026. Sri Lanka was ranked 55th in 2006 and ranked 63rd now.
The UN's World Population Prospects forecasts that in 24 years (in 2050) San Marino's population will grow by 0.32% to 34,268 people with a rank change from 193rd to 192nd. The population of Sri Lanka will increase by 6.26% to 23,299,282 people and rank change from 63rd to 71st.
Sri Lanka is projected to reach its peak in 2051 at 23.3M people, while San Marino's population already peaked in 2020 at 34.8K people and is projected to decrease to 31.7K people by 2100.
Population growth rate by year
| Year | Growth rate | |
|---|---|---|
|
San Marino
|
Sri Lanka
|
|
| 2100 | -0.06% | -0.56% |
| 2099 | -0.04% | -0.56% |
| 2098 | -0.13% | -0.55% |
| 2097 | -0.05% | -0.54% |
| 2096 | 0.06% | -0.53% |
| 2095 | 0.02% | -0.52% |
| 2094 | 0.09% | -0.51% |
| 2093 | -0.07% | -0.5% |
| 2092 | 0.04% | -0.49% |
| 2091 | -0.04% | -0.5% |
| 2090 | 0.04% | -0.49% |
| 2089 | 0.03% | -0.47% |
| 2088 | 0.05% | -0.46% |
| 2087 | 0.08% | -0.46% |
| 2086 | 0.15% | -0.45% |
| 2085 | 0.04% | -0.43% |
| 2084 | 0.04% | -0.42% |
| 2083 | 0.05% | -0.4% |
| 2082 | 0.13% | -0.4% |
| 2081 | -0.06% | -0.38% |
| 2080 | 0.01% | -0.38% |
| 2079 | 0.01% | -0.35% |
| 2078 | -0.04% | -0.33% |
| 2077 | -0.1% | -0.32% |
| 2076 | -0.13% | -0.31% |
| 2075 | -0.16% | -0.31% |
| 2074 | -0.19% | -0.29% |
| 2073 | -0.2% | -0.27% |
| 2072 | -0.22% | -0.26% |
| 2071 | -0.22% | -0.25% |
| 2070 | -0.29% | -0.23% |
| 2069 | -0.32% | -0.23% |
| 2068 | -0.4% | -0.24% |
| 2067 | -0.32% | -0.21% |
| 2066 | -0.41% | -0.22% |
| 2065 | -0.42% | -0.19% |
| 2064 | -0.36% | -0.17% |
| 2063 | -0.41% | -0.16% |
| 2062 | -0.39% | -0.14% |
| 2061 | -0.37% | -0.14% |
| 2060 | -0.42% | -0.12% |
| 2059 | -0.41% | -0.11% |
| 2058 | -0.41% | -0.1% |
| 2057 | -0.39% | -0.09% |
| 2056 | -0.33% | -0.05% |
| 2055 | -0.37% | -0.04% |
| 2054 | -0.33% | -0.04% |
| 2053 | -0.27% | -0.02% |
| 2052 | -0.21% | -0.004% |
| 2051 | -0.1% | 0.01% |
| 2050 | -0.16% | 0.02% |
| 2049 | -0.17% | 0.04% |
| 2048 | -0.11% | 0.07% |
| 2047 | -0.12% | 0.1% |
| 2046 | -0.1% | 0.14% |
| 2045 | -0.14% | 0.13% |
| 2044 | -0.02% | 0.16% |
| 2043 | 0.09% | 0.18% |
| 2042 | -0.01% | 0.2% |
| 2041 | -0.03% | 0.22% |
| 2040 | 0.04% | 0.25% |
| 2039 | 0.11% | 0.26% |
| 2038 | 0.15% | 0.29% |
| 2037 | 0.08% | 0.29% |
| 2036 | 0.1% | 0.31% |
| 2035 | 0.06% | 0.33% |
| 2034 | 0.02% | 0.35% |
| 2033 | 0.07% | 0.37% |
| 2032 | 0.02% | 0.38% |
| 2031 | 0.05% | 0.41% |
| 2030 | 0.07% | 0.42% |
| 2029 | 0.15% | 0.45% |
| 2028 | 0.12% | 0.47% |
| 2027 | 0.09% | 0.5% |
| 2026 | 0.1% | 0.52% |
| 2025 | 0.39% | -0.73% |
| 2024 | 0.35% | -0.55% |
| 2023 | 0.31% | -0.65% |
| 2022 | -1.45% | 0.11% |
| 2021 | -1.49% | 1.08% |
| 2020 | 0.31% | 0.53% |
| 2019 | 0.41% | 0.61% |
| 2018 | 2.06% | 1.01% |
| 2017 | 2.19% | 1.15% |
| 2016 | 0.62% | 1.14% |
| 2015 | 0.74% | 0.92% |
| 2014 | -1.17% | 0.94% |
| 2013 | -1.28% | -2.76% |
| 2012 | 2.6% | 0.76% |
| 2011 | -1.95% | 0.62% |
| 2010 | 0.62% | 0.59% |
| 2009 | 4.43% | 0.62% |
| 2008 | 1.45% | 0.67% |
| 2007 | 3.4% | 0.69% |
| 2006 | 1.17% | 0.67% |
| 2005 | 1.29% | 0.64% |
| 2004 | 5.8% | 0.68% |
| 2003 | 1.28% | 0.74% |
| 2002 | 1.28% | 1.05% |
| 2001 | 1.28% | 1.59% |
| 2000 | 1.29% | 1.84% |
| 1999 | 1.28% | 1.88% |
| 1998 | 1.26% | 1.91% |
| 1997 | 1.25% | 1.92% |
| 1996 | 1.29% | 1.94% |
| 1995 | 1.35% | 1.67% |
| 1994 | 1.43% | 1.47% |
| 1993 | 1.44% | 1.71% |
| 1992 | 1.38% | 1.6% |
| 1991 | 1.37% | 0.75% |
| 1990 | 1.39% | 0.64% |
| 1989 | 1.36% | 1.06% |
| 1988 | 0.69% | 1.02% |
| 1987 | 0.22% | 1.18% |
| 1986 | 0.67% | 1.2% |
| 1985 | 0.62% | 0.66% |
| 1984 | 0.53% | 0.34% |
| 1983 | 0.79% | 0.67% |
| 1982 | 0.98% | 1.24% |
| 1981 | 1.18% | 1.69% |
| 1980 | 1.24% | 1.84% |
| 1979 | 1.4% | 1.88% |
| 1978 | 5.04% | 1.86% |
| 1977 | 4.75% | 1.83% |
| 1976 | 0.34% | 1.83% |
| 1975 | 0.08% | 1.83% |
| 1974 | 0.2% | 1.87% |
| 1973 | 1.09% | 1.97% |
| 1972 | 2% | 2.05% |
| 1971 | 1.38% | 2.16% |
| 1970 | 0.79% | 2.27% |
| 1969 | 0.92% | 2.37% |
| 1968 | 0.98% | 2.43% |
| 1967 | 0.94% | 2.44% |
| 1966 | 1.26% | 2.45% |
| 1965 | 1.93% | 2.47% |
| 1964 | 2.39% | 2.49% |
| 1963 | 2.45% | 2.48% |
| 1962 | 2.43% | 2.47% |
| 1961 | 2.4% | 2.46% |
Data sources: United Nations | World Population Prospects (2026–2100, retrieved 2026-07-08); World Bank | Health (1961–2025, retrieved 2026-07-08).
GeoRank.org/population/san-marino/sri-lanka | CC BY
In 2025, the population of San Marino grew by 0.39%, while Sri Lanka's population declined by 0.73%.
Live population counters
|
San Marino
|
Sri Lanka
|
|
|---|---|---|
| Current population |
34159
|
21926160
|
| Population rank | 193/197 | 63/197 |
| Percent of world population | 0.0004% | 0.26% |
| One net population change |
2.77 days
|
3.29 minutes
|
| One birth every |
2.57 days
|
2.37 minutes
|
| One death every |
1.44 days
|
3.07 minutes
|
| Daily growth/decline | +0 | -438 |
| Annual growth/decline | +132 | -160,000 |
| Annual growth/decline rate | +0.39% | -0.73% |
| Population growth rate rank | 140/197 | 190/197 |
| One migration net change every |
3 days
|
17.2 minutes
|
| Annual migration change | +122 | -30,724 |
| Net migration rank | 72/196 | 165/196 |
| Foreign-born residents | 5,838 | 40,698 |
| Foreign-born residents rank | 183/195 | 156/195 |
| Foreign-born share of population | 17.4% | 0.2% |
| Foreign-born share rank | 35/195 | 190/195 |
Natural population change vs migration
| Year | Population change | |||
|---|---|---|---|---|
|
San Marino
|
Sri Lanka
|
|||
| Natural | Migration | Natural | Migration | |
| 2025 | - | 122 | - | -30,724 |
| 2024 | -112 | 37 | 50,407 | -27,245 |
| 2023 | -92 | -190 | 66,111 | -28,011 |
| 2022 | -58 | -403 | 95,378 | -27,435 |
| 2021 | -99 | -368 | 121,858 | -29,586 |
| 2020 | -122 | 247 | 170,968 | -29,875 |
| 2019 | -17 | 187 | 172,243 | -28,426 |
| 2018 | -11 | 172 | 183,610 | -28,607 |
| 2017 | -51 | 234 | 187,993 | -22,324 |
| 2016 | 10 | 291 | 194,232 | -18,388 |
| 2015 | 36 | 273 | 201,815 | -29,797 |
| 2014 | 46 | 74 | 211,541 | -33,672 |
| 2013 | 73 | 57 | 221,021 | -37,754 |
| 2012 | 54 | 143 | 229,138 | -41,955 |
| 2011 | 105 | 2,325 | 224,461 | -90,839 |
| 2010 | 126 | 592 | 224,325 | -98,060 |
| 2009 | 145 | 311 | 200,175 | -81,130 |
| 2008 | 159 | 268 | 232,225 | -97,144 |
| 2007 | 69 | 314 | 248,287 | -109,695 |
| 2006 | 75 | 310 | 248,706 | -107,045 |
| 2005 | 66 | 314 | 248,683 | -118,594 |
| 2004 | 121 | 285 | 212,527 | -84,795 |
| 2003 | 79 | 277 | 252,008 | -107,573 |
| 2002 | 112 | 241 | 252,840 | -105,718 |
| 2001 | 132 | 215 | 244,377 | 19,273 |
| 2000 | 107 | 233 | 227,060 | 123,894 |
| 1999 | 80 | 256 | 206,876 | 138,799 |
| 1998 | 74 | 257 | 201,059 | 150,724 |
| 1997 | 71 | 255 | 208,193 | 135,636 |
| 1996 | 63 | 257 | 215,290 | 127,236 |
| 1995 | 51 | 262 | 221,957 | 117,416 |
| 1994 | 43 | 300 | 228,904 | 8,323 |
| 1993 | 38 | 325 | 226,257 | 36,232 |
| 1992 | 42 | 285 | 222,230 | 88,542 |
| 1991 | 45 | 278 | 218,117 | -1,047 |
| 1990 | 41 | 289 | 224,454 | -195,736 |
| 1989 | 36 | 285 | 212,401 | -33,305 |
| 1988 | 34 | 268 | 219,184 | -58,415 |
| 1987 | 31 | -20 | 226,414 | -63,105 |
| 1986 | 40 | 44 | 233,782 | -26,460 |
| 1985 | 44 | 166 | 247,836 | -80,950 |
| 1984 | 46 | 32 | 263,175 | -225,450 |
| 1983 | 54 | 115 | 277,768 | -209,362 |
| 1982 | 61 | 117 | 300,030 | -163,987 |
| 1981 | 76 | 169 | 328,096 | -89,824 |
| 1980 | 90 | 169 | 328,155 | -63,541 |
| 1979 | 104 | 164 | 329,791 | -57,683 |
| 1978 | 121 | 199 | 317,055 | -50,189 |
| 1977 | 117 | 1,577 | 300,038 | -45,383 |
| 1976 | 126 | 0 | 291,816 | -41,258 |
| 1975 | 141 | -133 | 282,496 | -37,475 |
| 1974 | 153 | -131 | 275,521 | -33,979 |
| 1973 | 167 | -124 | 278,577 | -30,582 |
| 1972 | 173 | 191 | 282,494 | -27,071 |
| 1971 | 174 | 201 | 281,200 | -22,021 |
| 1970 | 173 | -39 | 286,719 | -16,299 |
| 1969 | 173 | -29 | 286,218 | -10,152 |
| 1968 | 171 | 8 | 286,642 | -7,163 |
| 1967 | 171 | -3 | 284,738 | -6,696 |
| 1966 | 173 | -9 | 275,549 | -6,794 |
| 1965 | 169 | 99 | 272,422 | -7,249 |
| 1964 | 163 | 233 | 269,584 | -7,614 |
| 1963 | 158 | 242 | 262,880 | -8,118 |
| 1962 | 155 | 238 | 256,719 | -8,909 |
| 1961 | 174 | 206 | 251,087 | -10,144 |
| 1960 | 139 | 229 | 247,631 | -12,610 |
Data sources: World Bank | Health (1960–2025, retrieved 2026-07-08).
GeoRank.org/population/san-marino/sri-lanka | CC BY
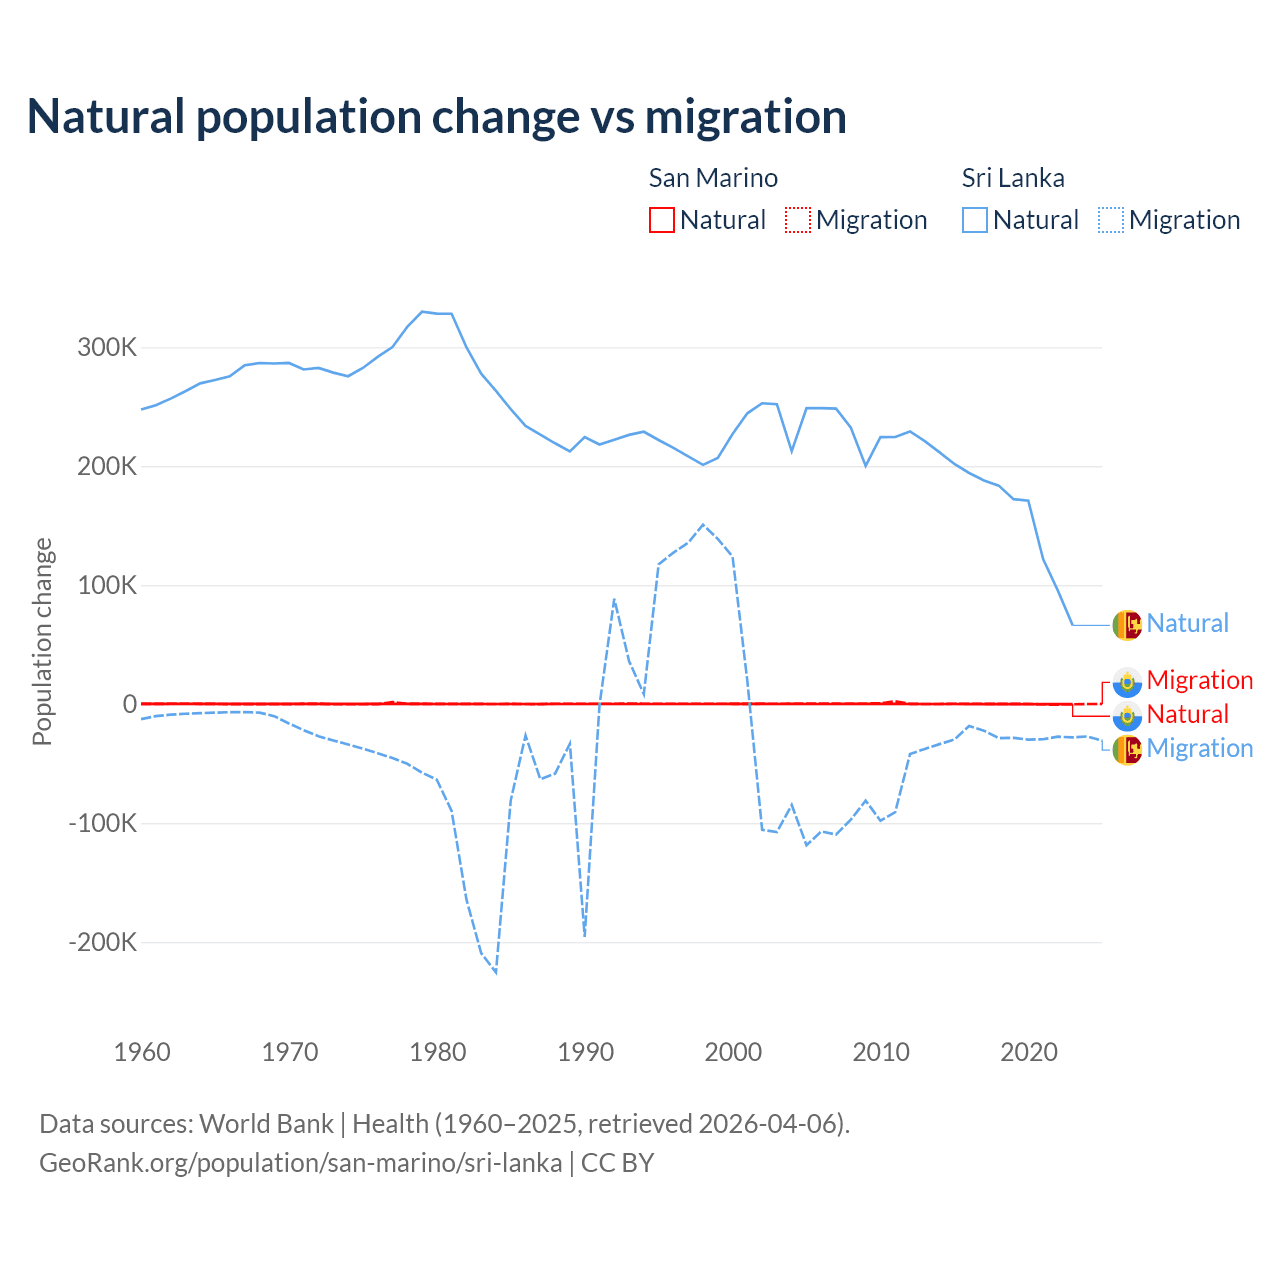
Over the last 10 years, 51.8% of the population change in San Marino is from natural causes (a loss of 516 people) and 48.2% is from migration (a gain of 480 people). In Sri Lanka 84.3% is from natural causes (a gain of 1,444,615 people) and 15.7% is from migration (a loss of 269,694 people).
As of 2024, 5,838 residents or 17.4% of the population were not native-born in San Marino, compared to 40,698 people or 0.2% in Sri Lanka.
Biggest cities by population
|
San Marino
|
|
|---|---|
| City | Population |
| Dogana | 7K |
| San Marino | 4.04K |
|
Sri Lanka
|
|
|---|---|
| City | Population |
| Colombo | 648K |
| Gampaha | 191K |
| Beruwala | 165K |
| Negombo | 142K |
| Kandy | 120K |
| Sri Jayawardenepura Kotte | 116K |
| Trincomalee | 99.1K |
| Galle | 93.1K |
| Matara | 68.2K |
| Anuradhapura | 63.2K |
Compare countries by 7 more topics
Population differences between San Marino and Sri Lanka
|
San Marino
|
Sri Lanka
|
|
|---|---|---|
| Life expectancy | 86 years | 78 years |
| Average age | 46.4 years | 36 years |
| Median age | 49.5 years | 34.4 years |
| Male:Female ratio | 49.2:50.8 | 48.4:51.6 |
| Fertility rate | 1.16 births per woman | 1.95 births per woman |
| Population density | 1,474 ppl/mi² | 916 ppl/mi² |
Population map with other countries
Data sources: World Bank | Health (1960–2025, retrieved 2026-07-08); United Nations | World Population Prospects (1960–2026, retrieved 2026-07-08); U.S. Census Bureau (1960–2025, retrieved 2026-07-08); Central Intelligence Agency (CIA) (2000–2019, retrieved 2026-07-08).
GeoRank.org/population/san-marino/sri-lanka | CC BY
Help us show the world through your eyes
Share a photo of your city and help others discover what it looks like to live there. Your contribution makes our data come alive.
Data sources:
- World Bank | Health (1960–2025, retrieved 2026-07-08)
- United Nations | World Population Prospects (1960–2100, retrieved 2026-07-08)
- U.S. Census Bureau (1960–2025, retrieved 2026-07-08)
- Central Intelligence Agency (CIA) (2000–2019, retrieved 2026-07-08)
- Wikidata (2026, retrieved 2026-07-08)
Creative Commons Attribution (CC BY) — you’re free to copy, share, remix, adapt, and use even commercially as long as you give appropriate credit and clearly indicate if you made changes. Other sources may be subject to different license terms.