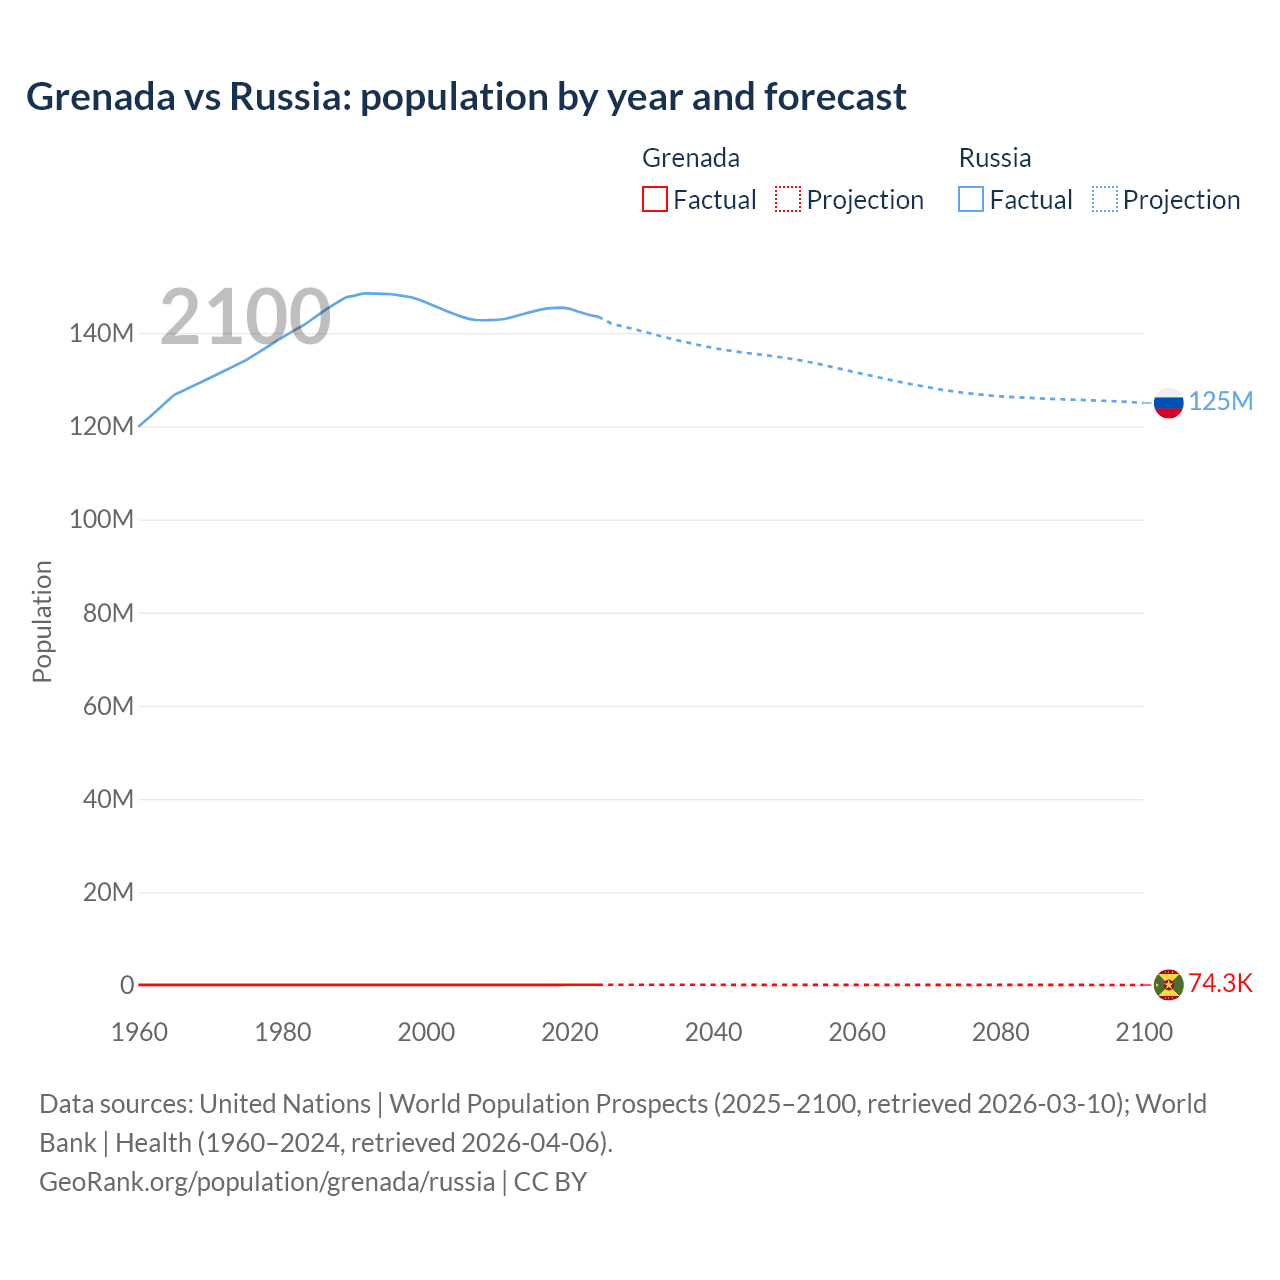
The latest officially reported population of Grenada was 117,303 in 2025 vs 143,513,328 people in Russia in 2025. In 2026, based on the adjusted UN estimation, the current Grenada's population is 117,405 people compared to 142,643,173 in Russia.
Population statistics:
- Russia's population is 1,215 times bigger than Grenada's.
- Grenada is ranked the 182nd most populous country in the world, while Russia is the 9th.
- The countries together account for 1.72% of the world: 0.001% for Grenada vs 1.72% for Russia.
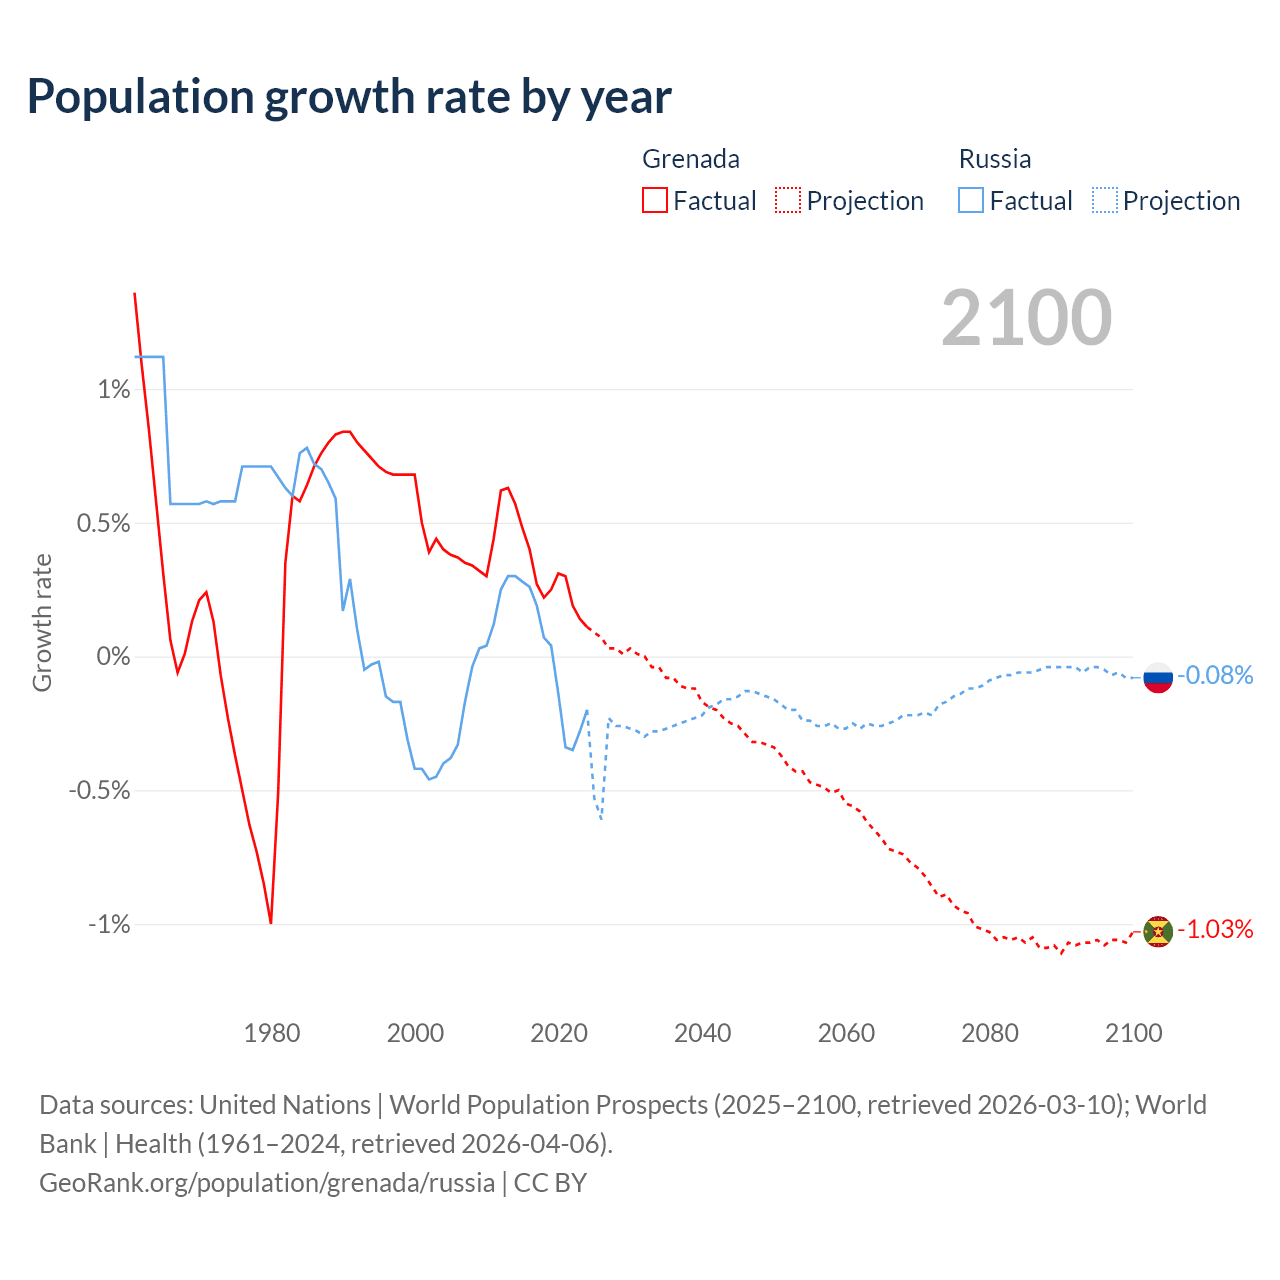
- For the last 10 years, Grenada has had an average growth rate of +0.25% per year vs -0.05% in Russia.
- Since 2006, the population of Grenada has increased from 110K people to 117K (6.6% growth), while Russia has declined from 143M to 143M (0.28% decline).
Grenada vs Russia: population by year and forecast
| Year | Population | |
|---|---|---|
 Grenada
|
 Russia
|
|
| 2100 | 74,296 | 125,631,984 |
| 2099 | 75,070 | 125,735,285 |
| 2098 | 75,885 | 125,835,990 |
| 2097 | 76,696 | 125,914,480 |
| 2096 | 77,516 | 126,004,709 |
| 2095 | 78,359 | 126,072,890 |
| 2094 | 79,197 | 126,125,529 |
| 2093 | 80,051 | 126,181,074 |
| 2092 | 80,918 | 126,256,091 |
| 2091 | 81,804 | 126,304,823 |
| 2090 | 82,687 | 126,360,262 |
| 2089 | 83,611 | 126,412,664 |
| 2088 | 84,521 | 126,463,022 |
| 2087 | 85,451 | 126,511,263 |
| 2086 | 86,394 | 126,579,534 |
| 2085 | 87,312 | 126,655,806 |
| 2084 | 88,256 | 126,730,694 |
| 2083 | 89,193 | 126,805,713 |
| 2082 | 90,150 | 126,889,471 |
| 2081 | 91,105 | 126,973,300 |
| 2080 | 92,085 | 127,070,546 |
| 2079 | 93,048 | 127,191,346 |
| 2078 | 94,007 | 127,331,975 |
| 2077 | 94,970 | 127,489,152 |
| 2076 | 95,891 | 127,641,749 |
| 2075 | 96,806 | 127,825,235 |
| 2074 | 97,711 | 128,023,096 |
| 2073 | 98,588 | 128,238,922 |
| 2072 | 99,480 | 128,465,870 |
| 2071 | 100,339 | 128,745,681 |
| 2070 | 101,165 | 129,020,076 |
| 2069 | 101,968 | 129,309,803 |
| 2068 | 102,762 | 129,589,275 |
| 2067 | 103,527 | 129,873,991 |
| 2066 | 104,294 | 130,184,092 |
| 2065 | 105,046 | 130,515,828 |
| 2064 | 105,762 | 130,852,649 |
| 2063 | 106,451 | 131,199,458 |
| 2062 | 107,117 | 131,530,725 |
| 2061 | 107,740 | 131,881,030 |
| 2060 | 108,346 | 132,209,377 |
| 2059 | 108,946 | 132,568,882 |
| 2058 | 109,497 | 132,933,515 |
| 2057 | 110,054 | 133,272,997 |
| 2056 | 110,591 | 133,615,325 |
| 2055 | 111,120 | 133,963,055 |
| 2054 | 111,645 | 134,288,366 |
| 2053 | 112,128 | 134,609,198 |
| 2052 | 112,610 | 134,876,558 |
| 2051 | 113,074 | 135,141,211 |
| 2050 | 113,495 | 135,386,454 |
| 2049 | 113,882 | 135,609,441 |
| 2048 | 114,261 | 135,818,840 |
| 2047 | 114,630 | 136,013,698 |
| 2046 | 114,997 | 136,185,098 |
| 2045 | 115,333 | 136,368,416 |
| 2044 | 115,628 | 136,568,234 |
| 2043 | 115,920 | 136,791,498 |
| 2042 | 116,189 | 137,015,033 |
| 2041 | 116,424 | 137,266,491 |
| 2040 | 116,647 | 137,531,851 |
| 2039 | 116,841 | 137,833,822 |
| 2038 | 116,976 | 138,146,863 |
| 2037 | 117,111 | 138,485,780 |
| 2036 | 117,242 | 138,835,731 |
| 2035 | 117,331 | 139,197,452 |
| 2034 | 117,425 | 139,573,272 |
| 2033 | 117,474 | 139,960,175 |
| 2032 | 117,516 | 140,359,785 |
| 2031 | 117,515 | 140,785,026 |
| 2030 | 117,504 | 141,182,418 |
| 2029 | 117,472 | 141,571,268 |
| 2028 | 117,461 | 141,946,979 |
| 2027 | 117,420 | 142,315,155 |
| 2026 | 117,390 | 142,643,173 |
| 2025 | 117,303 | 143,513,328 |
| 2024 | 117,207 | 143,669,648 |
| 2023 | 117,081 | 143,826,130 |
| 2022 | 116,913 | 144,236,933 |
| 2021 | 116,688 | 144,746,762 |
| 2020 | 116,341 | 145,245,148 |
| 2019 | 115,981 | 145,453,291 |
| 2018 | 115,691 | 145,398,106 |
| 2017 | 115,438 | 145,293,260 |
| 2016 | 115,130 | 145,015,460 |
| 2015 | 114,676 | 144,640,716 |
| 2014 | 114,132 | 144,237,223 |
| 2013 | 113,487 | 143,805,638 |
| 2012 | 112,775 | 143,378,447 |
| 2011 | 112,079 | 143,018,195 |
| 2010 | 111,586 | 142,849,468 |
| 2009 | 111,254 | 142,785,348 |
| 2008 | 110,896 | 142,742,366 |
| 2007 | 110,522 | 142,805,114 |
| 2006 | 110,135 | 143,049,637 |
| 2005 | 109,734 | 143,518,814 |
| 2004 | 109,323 | 144,067,316 |
| 2003 | 108,884 | 144,648,618 |
| 2002 | 108,404 | 145,306,497 |
| 2001 | 107,987 | 145,976,482 |
| 2000 | 107,451 | 146,596,869 |
| 1999 | 106,727 | 147,214,776 |
| 1998 | 106,009 | 147,670,784 |
| 1997 | 105,293 | 147,915,361 |
| 1996 | 104,584 | 148,160,129 |
| 1995 | 103,869 | 148,375,787 |
| 1994 | 103,138 | 148,407,912 |
| 1993 | 102,382 | 148,458,777 |
| 1992 | 101,602 | 148,538,197 |
| 1991 | 100,793 | 148,394,216 |
| 1990 | 99,957 | 147,969,406 |
| 1989 | 99,121 | 147,721,000 |
| 1988 | 98,308 | 146,857,000 |
| 1987 | 97,526 | 145,908,000 |
| 1986 | 96,790 | 144,894,000 |
| 1985 | 96,111 | 143,858,000 |
| 1984 | 95,498 | 142,745,000 |
| 1983 | 94,948 | 141,668,000 |
| 1982 | 94,383 | 140,823,000 |
| 1981 | 94,052 | 139,941,000 |
| 1980 | 94,538 | 139,010,000 |
| 1979 | 95,490 | 138,027,000 |
| 1978 | 96,305 | 137,060,000 |
| 1977 | 97,017 | 136,100,000 |
| 1976 | 97,632 | 135,147,000 |
| 1975 | 98,126 | 134,200,000 |
| 1974 | 98,486 | 133,432,000 |
| 1973 | 98,709 | 132,669,000 |
| 1972 | 98,777 | 131,909,000 |
| 1971 | 98,648 | 131,155,000 |
| 1970 | 98,414 | 130,404,000 |
| 1969 | 98,204 | 129,664,000 |
| 1968 | 98,078 | 128,928,000 |
| 1967 | 98,066 | 128,196,000 |
| 1966 | 98,121 | 127,468,000 |
| 1965 | 98,067 | 126,745,000 |
| 1964 | 97,760 | 125,345,000 |
| 1963 | 97,195 | 123,960,000 |
| 1962 | 96,375 | 122,591,000 |
| 1961 | 95,335 | 121,236,000 |
| 1960 | 94,058 | 119,897,000 |
Data sources: United Nations | World Population Prospects (2026–2100, retrieved 2026-07-08); World Bank | Health (1960–2025, retrieved 2026-07-08).
GeoRank.org/population/grenada/russia | CC BY 
From 2006 to 2016, the population of Grenada increased by 4,995 people (a 4.54% growth), while Russia gained 1,965,823 people (a 1.37% growth).
For the next 10 years, from 2016 to 2026, Grenada gained 2,275 people (a 1.98% growth), while Russia's population decreased by 2,372,287 people (a 1.64% decline).
Grenada was ranked 181st most populous country in 2006 and is 182nd in 2026. Russia was ranked 9th in 2006 and still ranked 9th now.
The UN's World Population Prospects forecasts that in 24 years (in 2050) Grenada's population will shrink by 3.33% to 113,495 people and will still be ranked 182nd. The population of Russia will decrease by 5.09% to 135,386,454 people and rank change from 9th to 13th.
Grenada is projected to reach its peak in 2032 at 118K people, while Russia's population already peaked in 1992 at 149M people and is projected to decrease to 126M people by 2100.
Population growth rate by year
| Year | Growth rate | |
|---|---|---|
|
Grenada
|
Russia
|
|
| 2100 | -1.03% | -0.08% |
| 2099 | -1.07% | -0.08% |
| 2098 | -1.06% | -0.06% |
| 2097 | -1.06% | -0.07% |
| 2096 | -1.08% | -0.05% |
| 2095 | -1.06% | -0.04% |
| 2094 | -1.07% | -0.04% |
| 2093 | -1.07% | -0.06% |
| 2092 | -1.08% | -0.04% |
| 2091 | -1.07% | -0.04% |
| 2090 | -1.11% | -0.04% |
| 2089 | -1.08% | -0.04% |
| 2088 | -1.09% | -0.04% |
| 2087 | -1.09% | -0.05% |
| 2086 | -1.05% | -0.06% |
| 2085 | -1.07% | -0.06% |
| 2084 | -1.05% | -0.06% |
| 2083 | -1.06% | -0.07% |
| 2082 | -1.05% | -0.07% |
| 2081 | -1.06% | -0.08% |
| 2080 | -1.03% | -0.09% |
| 2079 | -1.02% | -0.11% |
| 2078 | -1.01% | -0.12% |
| 2077 | -0.96% | -0.12% |
| 2076 | -0.95% | -0.14% |
| 2075 | -0.93% | -0.15% |
| 2074 | -0.89% | -0.17% |
| 2073 | -0.9% | -0.18% |
| 2072 | -0.86% | -0.22% |
| 2071 | -0.82% | -0.21% |
| 2070 | -0.79% | -0.22% |
| 2069 | -0.77% | -0.22% |
| 2068 | -0.74% | -0.22% |
| 2067 | -0.73% | -0.24% |
| 2066 | -0.72% | -0.25% |
| 2065 | -0.68% | -0.26% |
| 2064 | -0.65% | -0.26% |
| 2063 | -0.62% | -0.25% |
| 2062 | -0.58% | -0.27% |
| 2061 | -0.56% | -0.25% |
| 2060 | -0.55% | -0.27% |
| 2059 | -0.5% | -0.27% |
| 2058 | -0.51% | -0.25% |
| 2057 | -0.49% | -0.26% |
| 2056 | -0.48% | -0.26% |
| 2055 | -0.47% | -0.24% |
| 2054 | -0.43% | -0.24% |
| 2053 | -0.43% | -0.2% |
| 2052 | -0.41% | -0.2% |
| 2051 | -0.37% | -0.18% |
| 2050 | -0.34% | -0.16% |
| 2049 | -0.33% | -0.15% |
| 2048 | -0.32% | -0.14% |
| 2047 | -0.32% | -0.13% |
| 2046 | -0.29% | -0.13% |
| 2045 | -0.26% | -0.15% |
| 2044 | -0.25% | -0.16% |
| 2043 | -0.23% | -0.16% |
| 2042 | -0.2% | -0.18% |
| 2041 | -0.19% | -0.19% |
| 2040 | -0.17% | -0.22% |
| 2039 | -0.12% | -0.23% |
| 2038 | -0.12% | -0.24% |
| 2037 | -0.11% | -0.25% |
| 2036 | -0.08% | -0.26% |
| 2035 | -0.08% | -0.27% |
| 2034 | -0.04% | -0.28% |
| 2033 | -0.04% | -0.28% |
| 2032 | 0.001% | -0.3% |
| 2031 | 0.009% | -0.28% |
| 2030 | 0.03% | -0.27% |
| 2029 | 0.009% | -0.26% |
| 2028 | 0.03% | -0.26% |
| 2027 | 0.03% | -0.23% |
| 2026 | 0.07% | -0.61% |
| 2025 | 0.08% | -0.11% |
| 2024 | 0.11% | -0.11% |
| 2023 | 0.14% | -0.28% |
| 2022 | 0.19% | -0.35% |
| 2021 | 0.3% | -0.34% |
| 2020 | 0.31% | -0.14% |
| 2019 | 0.25% | 0.04% |
| 2018 | 0.22% | 0.07% |
| 2017 | 0.27% | 0.19% |
| 2016 | 0.4% | 0.26% |
| 2015 | 0.48% | 0.28% |
| 2014 | 0.57% | 0.3% |
| 2013 | 0.63% | 0.3% |
| 2012 | 0.62% | 0.25% |
| 2011 | 0.44% | 0.12% |
| 2010 | 0.3% | 0.04% |
| 2009 | 0.32% | 0.03% |
| 2008 | 0.34% | -0.04% |
| 2007 | 0.35% | -0.17% |
| 2006 | 0.37% | -0.33% |
| 2005 | 0.38% | -0.38% |
| 2004 | 0.4% | -0.4% |
| 2003 | 0.44% | -0.45% |
| 2002 | 0.39% | -0.46% |
| 2001 | 0.5% | -0.42% |
| 2000 | 0.68% | -0.42% |
| 1999 | 0.68% | -0.31% |
| 1998 | 0.68% | -0.17% |
| 1997 | 0.68% | -0.17% |
| 1996 | 0.69% | -0.15% |
| 1995 | 0.71% | -0.02% |
| 1994 | 0.74% | -0.03% |
| 1993 | 0.77% | -0.05% |
| 1992 | 0.8% | 0.1% |
| 1991 | 0.84% | 0.29% |
| 1990 | 0.84% | 0.17% |
| 1989 | 0.83% | 0.59% |
| 1988 | 0.8% | 0.65% |
| 1987 | 0.76% | 0.7% |
| 1986 | 0.71% | 0.72% |
| 1985 | 0.64% | 0.78% |
| 1984 | 0.58% | 0.76% |
| 1983 | 0.6% | 0.6% |
| 1982 | 0.35% | 0.63% |
| 1981 | -0.51% | 0.67% |
| 1980 | -1% | 0.71% |
| 1979 | -0.85% | 0.71% |
| 1978 | -0.73% | 0.71% |
| 1977 | -0.63% | 0.71% |
| 1976 | -0.5% | 0.71% |
| 1975 | -0.37% | 0.58% |
| 1974 | -0.23% | 0.58% |
| 1973 | -0.07% | 0.58% |
| 1972 | 0.13% | 0.57% |
| 1971 | 0.24% | 0.58% |
| 1970 | 0.21% | 0.57% |
| 1969 | 0.13% | 0.57% |
| 1968 | 0.01% | 0.57% |
| 1967 | -0.06% | 0.57% |
| 1966 | 0.06% | 0.57% |
| 1965 | 0.31% | 1.12% |
| 1964 | 0.58% | 1.12% |
| 1963 | 0.85% | 1.12% |
| 1962 | 1.09% | 1.12% |
| 1961 | 1.36% | 1.12% |
Data sources: United Nations | World Population Prospects (2026–2100, retrieved 2026-07-08); World Bank | Health (1961–2025, retrieved 2026-07-08).
GeoRank.org/population/grenada/russia | CC BY
In 2025, the population of Grenada grew by 0.08%, while Russia's population declined by 0.11%.
Live population counters
|
Grenada
|
Russia
|
|
|---|---|---|
| Current population |
117405
|
142643173
|
| Population rank | 182/197 | 9/197 |
| Percent of world population | 0.001% | 1.72% |
| One net population change |
3.81 days
|
3.37 minutes
|
| One birth every |
6.51 hours
|
26.1 seconds
|
| One death every |
8.38 hours
|
17.7 seconds
|
| Daily growth/decline | +0 | -428 |
| Annual growth/decline | +96 | -156,320 |
| Annual growth/decline rate | +0.08% | -0.11% |
| Population growth rate rank | 155/197 | 166/197 |
| One migration net change every |
1.98 days
|
2.09 minutes
|
| Annual migration change | -185 | -251,822 |
| Net migration rank | 84/196 | 187/196 |
| Foreign-born residents | 7,340 | 7,605,774 |
| Foreign-born residents rank | 182/195 | 10/195 |
| Foreign-born share of population | 6.3% | 5.3% |
| Foreign-born share rank | 84/195 | 91/195 |
Natural population change vs migration
| Year | Population change | |||
|---|---|---|---|---|
|
Grenada
|
Russia
|
|||
| Natural | Migration | Natural | Migration | |
| 2025 | - | -185 | - | -251,822 |
| 2024 | 300 | -192 | -574,678 | -178,042 |
| 2023 | 334 | -190 | -503,392 | 27,807 |
| 2022 | 371 | -190 | -576,948 | 765,629 |
| 2021 | 343 | -69 | -1,027,702 | 314,112 |
| 2020 | 433 | 0 | -697,177 | 334,094 |
| 2019 | 462 | -181 | -319,997 | 336,494 |
| 2018 | 470 | -181 | -232,637 | 339,972 |
| 2017 | 402 | -181 | -130,764 | 396,619 |
| 2016 | 579 | -181 | 0 | 447,645 |
| 2015 | 684 | -181 | 43,392 | 384,756 |
| 2014 | 772 | -181 | 28,848 | 264,698 |
| 2013 | 878 | -181 | 28,761 | 289,872 |
| 2012 | 925 | -197 | 0 | 285,977 |
| 2011 | 954 | -285 | -128,716 | 309,377 |
| 2010 | 989 | -665 | -242,844 | 307,555 |
| 2009 | 1,024 | -675 | -257,014 | 350,206 |
| 2008 | 1,046 | -683 | -356,856 | 360,840 |
| 2007 | 1,059 | -681 | -471,257 | 365,717 |
| 2006 | 1,068 | -672 | -686,638 | 308,370 |
| 2005 | 1,075 | -672 | -846,761 | 263,541 |
| 2004 | 1,034 | -621 | -792,370 | 261,519 |
| 2003 | 1,074 | -605 | -896,822 | 256,804 |
| 2002 | 1,077 | -587 | -944,492 | 1,358,944 |
| 2001 | 1,082 | -737 | -963,445 | 259,614 |
| 2000 | 1,105 | -376 | -967,540 | 550,401 |
| 1999 | 1,092 | -374 | -927,453 | 375,468 |
| 1998 | 1,204 | -490 | -694,053 | 528,135 |
| 1997 | 1,480 | -772 | -769,159 | 541,387 |
| 1996 | 1,559 | -845 | -785,248 | 587,171 |
| 1995 | 1,580 | -856 | -845,742 | 723,875 |
| 1994 | 1,596 | -853 | -920,129 | 1,271,417 |
| 1993 | 1,641 | -878 | -757,140 | 507,229 |
| 1992 | 1,811 | -1,015 | -222,808 | -1,129,589 |
| 1991 | 1,953 | -1,130 | 103,876 | 125,505 |
| 1990 | 1,931 | -1,088 | 325,533 | 299,863 |
| 1989 | 2,084 | -1,254 | 576,112 | 89,400 |
| 1988 | 2,044 | -1,243 | 778,343 | 269,862 |
| 1987 | 2,345 | -1,587 | 977,583 | 275,611 |
| 1986 | 2,324 | -1,616 | 985,279 | 283,553 |
| 1985 | 2,215 | -1,555 | 762,447 | 280,614 |
| 1984 | 1,975 | -1,416 | 756,548 | 247,026 |
| 1983 | 1,817 | -1,274 | 906,676 | 200,159 |
| 1982 | 1,798 | -1,201 | 830,855 | 107,520 |
| 1981 | 1,625 | -1,571 | 713,700 | 36,686 |
| 1980 | 1,840 | -2,864 | 681,149 | 10,440 |
| 1979 | 1,871 | -2,743 | 690,135 | -5,791 |
| 1978 | 1,882 | -2,647 | 812,766 | 108,882 |
| 1977 | 1,974 | -2,642 | 832,932 | 122,316 |
| 1976 | 2,092 | -2,645 | 852,237 | 113,851 |
| 1975 | 2,224 | -2,651 | 843,850 | 80,069 |
| 1974 | 2,360 | -2,654 | 883,186 | -51,759 |
| 1973 | 2,464 | -2,615 | 846,561 | -107,568 |
| 1972 | 2,578 | -2,562 | 872,050 | -111,168 |
| 1971 | 2,705 | -2,463 | 854,999 | -134,968 |
| 1970 | 2,793 | -2,566 | 785,554 | -264,464 |
| 1969 | 2,948 | -2,759 | 753,088 | -64,643 |
| 1968 | 3,040 | -2,973 | 787,621 | -83,221 |
| 1967 | 3,158 | -3,201 | 854,554 | -116,029 |
| 1966 | 3,278 | -3,350 | 989,279 | -111,360 |
| 1965 | 3,399 | -3,221 | 1,059,335 | -138,078 |
| 1964 | 3,508 | -3,071 | 1,233,520 | -148,595 |
| 1963 | 3,601 | -2,906 | 1,436,077 | -168,649 |
| 1962 | 3,674 | -2,735 | 1,573,701 | -177,358 |
| 1961 | 3,703 | -2,565 | 1,810,538 | -204,349 |
| 1960 | 3,678 | -2,255 | 1,962,834 | -234,895 |
Data sources: World Bank | Health (1960–2025, retrieved 2026-07-08).
GeoRank.org/population/grenada/russia | CC BY
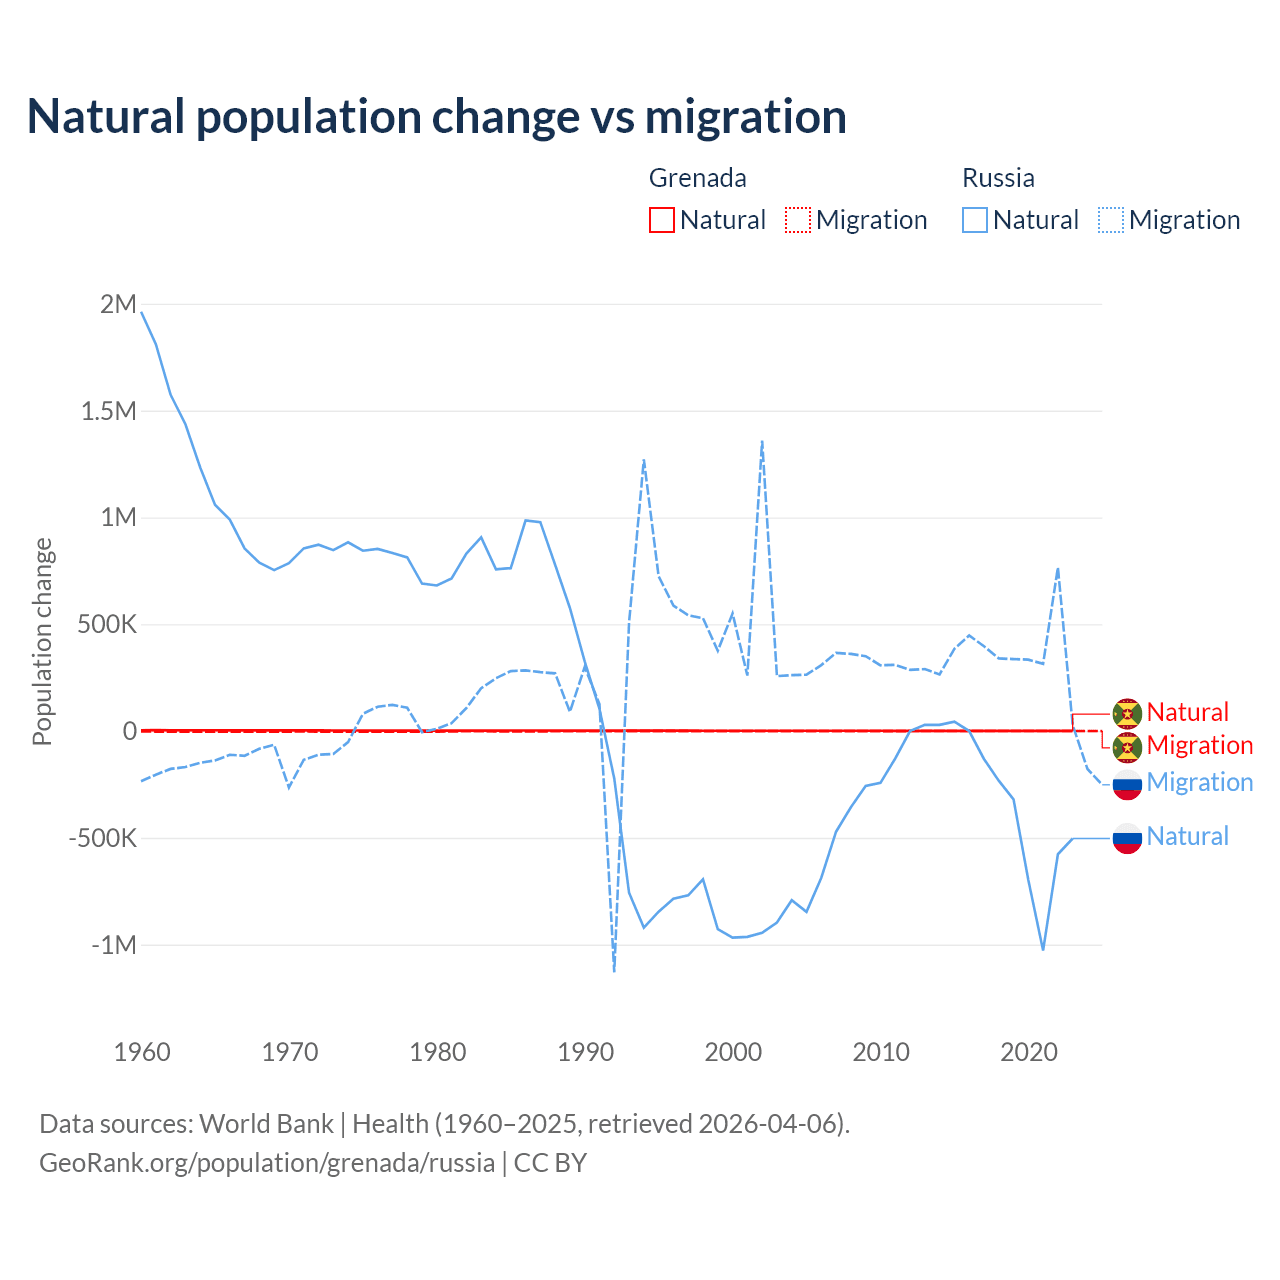
Over the last 10 years, 73.9% of the population change in Grenada is from natural causes (a gain of 4,378 people) and 26.1% is from migration (a loss of 1,546 people). In Russia 55.9% is from natural causes (a loss of 4,019,903 people) and 44.1% is from migration (a gain of 3,169,086 people).
As of 2024, 7,340 residents or 6.3% of the population were not native-born in Grenada, compared to 7,605,774 people or 5.3% in Russia.
Biggest cities by population
Compare countries by 7 more topics
Population differences between Grenada and Russia
|
Grenada
|
Russia
|
|
|---|---|---|
| Life expectancy | 75.7 years | 73.7 years |
| Average age | 36.8 years | 41.1 years |
| Median age | 35.4 years | 41.4 years |
| Male:Female ratio | 50.1:49.9 | 46.4:53.6 |
| Fertility rate | 1.47 births per woman | 1.42 births per woman |
| Population density | 894 ppl/mi² | 22.6 ppl/mi² |
Population map with other countries
Data sources: World Bank | Health (1960–2025, retrieved 2026-07-08); United Nations | World Population Prospects (1960–2026, retrieved 2026-07-08); U.S. Census Bureau (1960–2025, retrieved 2026-07-08); Central Intelligence Agency (CIA) (2000–2019, retrieved 2026-07-08).
GeoRank.org/population/grenada/russia | CC BY
Help us show the world through your eyes
Share a photo of your city and help others discover what it looks like to live there. Your contribution makes our data come alive.
Data sources:
- World Bank | Health (1960–2025, retrieved 2026-07-08)
- United Nations | World Population Prospects (1960–2100, retrieved 2026-07-08)
- U.S. Census Bureau (1960–2025, retrieved 2026-07-08)
- Central Intelligence Agency (CIA) (2000–2019, retrieved 2026-07-08)
- Wikidata (2026, retrieved 2026-07-08)
Creative Commons Attribution (CC BY) — you’re free to copy, share, remix, adapt, and use even commercially as long as you give appropriate credit and clearly indicate if you made changes. Other sources may be subject to different license terms.