The latest officially reported population of Brunei was 466,330 in 2025 vs 9,092,436 people in Switzerland in 2025. In 2026, based on the adjusted UN estimation, the current Brunei's population is 471,596 people compared to 9,155,878 in Switzerland.
Population statistics:
- Switzerland's population is 19.4 times bigger than Brunei's.
- Brunei is ranked the 170th most populous country in the world, while Switzerland is the 99th.
- The countries together account for 0.12% of the world: 0.006% for Brunei vs 0.11% for Switzerland.
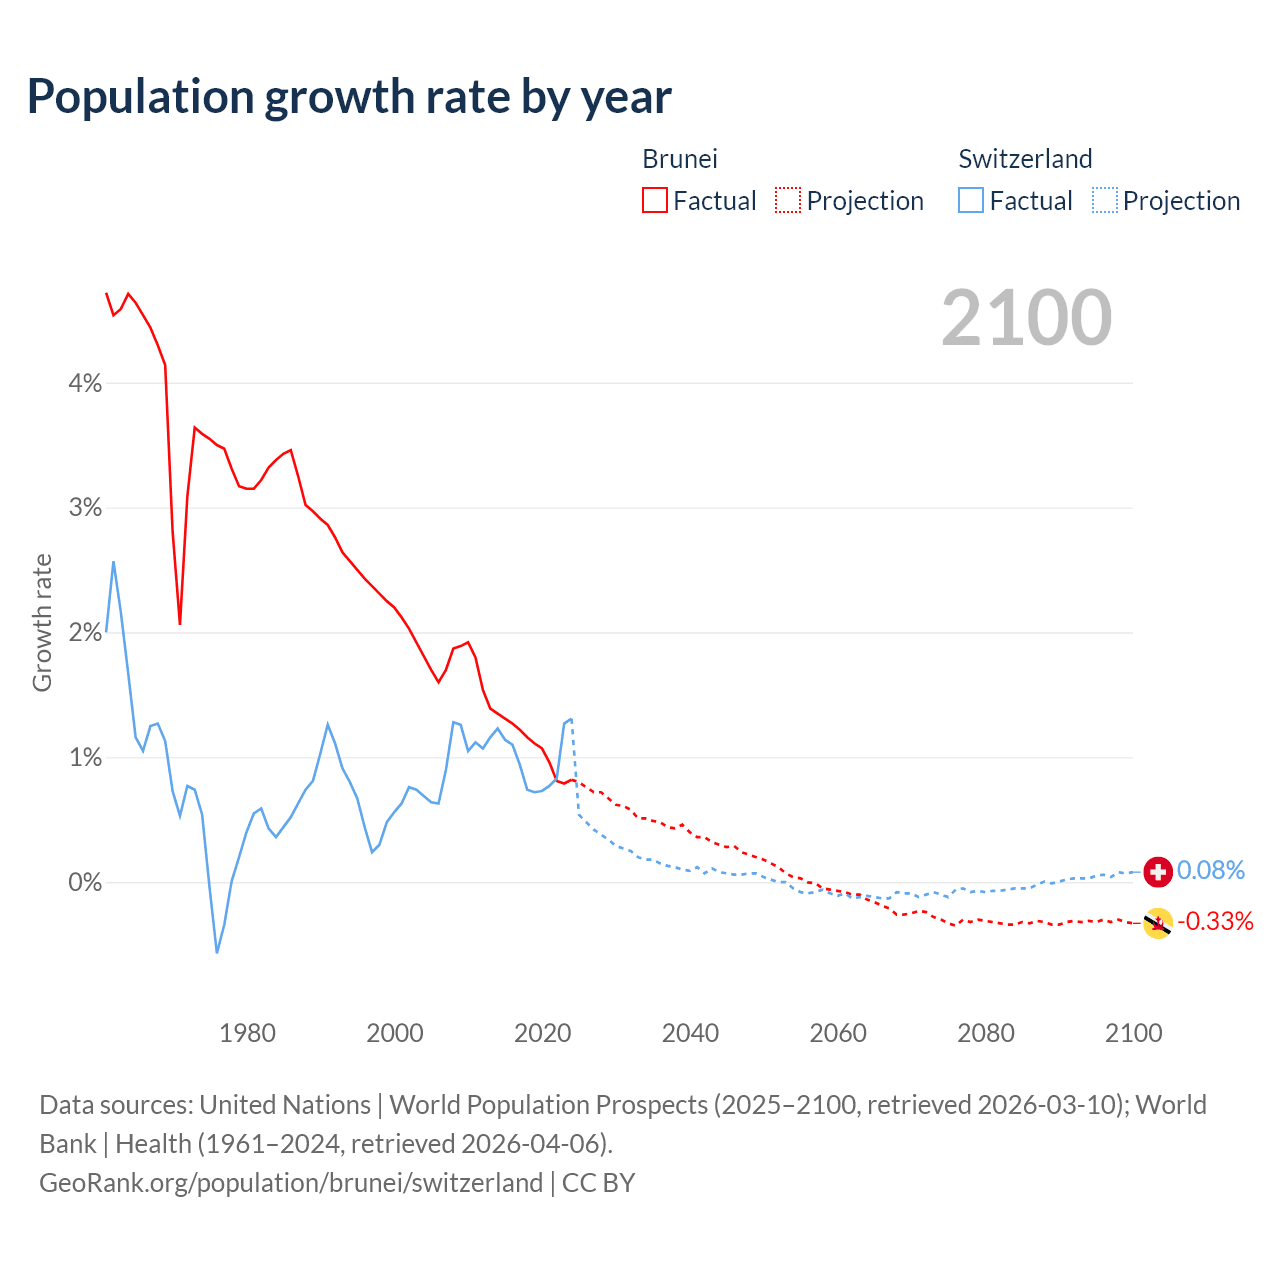
- For the last 10 years, Brunei has had an average growth rate of +1.03% per year vs +0.96% in Switzerland.
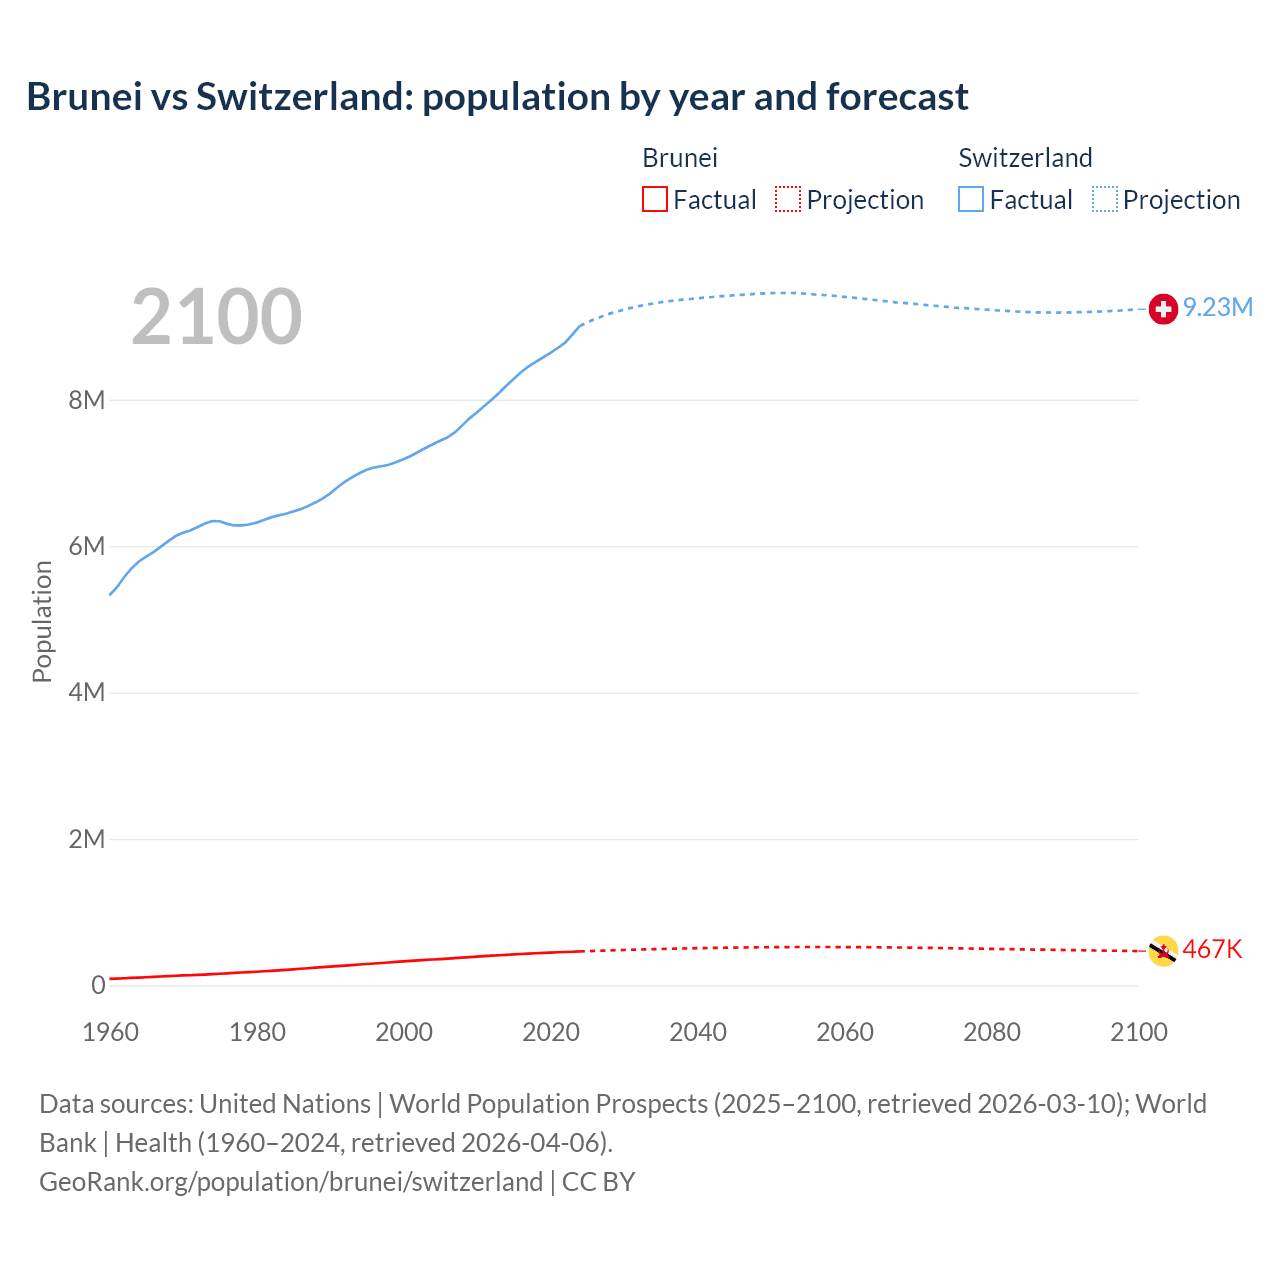
- Since 2006, the population of Brunei has increased from 365K people to 472K (29.3% growth), while Switzerland has grown from 7.48M to 9.16M (22.3% growth).
Brunei vs Switzerland: population by year and forecast
| Year | Population | |
|---|---|---|
 Brunei
|
 Switzerland
|
|
| 2100 | 467,305 | 9,273,514 |
| 2099 | 468,844 | 9,265,656 |
| 2098 | 470,362 | 9,259,266 |
| 2097 | 471,774 | 9,251,854 |
| 2096 | 473,274 | 9,248,107 |
| 2095 | 474,709 | 9,242,564 |
| 2094 | 476,211 | 9,238,163 |
| 2093 | 477,690 | 9,235,730 |
| 2092 | 479,206 | 9,233,129 |
| 2091 | 480,680 | 9,230,180 |
| 2090 | 482,205 | 9,228,148 |
| 2089 | 483,829 | 9,227,779 |
| 2088 | 485,465 | 9,229,133 |
| 2087 | 487,012 | 9,228,792 |
| 2086 | 488,509 | 9,230,530 |
| 2085 | 490,142 | 9,234,782 |
| 2084 | 491,731 | 9,239,056 |
| 2083 | 493,405 | 9,244,001 |
| 2082 | 495,083 | 9,249,813 |
| 2081 | 496,722 | 9,256,210 |
| 2080 | 498,316 | 9,262,647 |
| 2079 | 499,888 | 9,270,123 |
| 2078 | 501,377 | 9,276,881 |
| 2077 | 502,966 | 9,284,565 |
| 2076 | 504,477 | 9,289,534 |
| 2075 | 506,274 | 9,295,062 |
| 2074 | 507,959 | 9,305,809 |
| 2073 | 509,492 | 9,314,832 |
| 2072 | 510,925 | 9,322,610 |
| 2071 | 512,139 | 9,332,380 |
| 2070 | 513,323 | 9,343,357 |
| 2069 | 514,593 | 9,351,483 |
| 2068 | 515,914 | 9,359,919 |
| 2067 | 517,235 | 9,367,355 |
| 2066 | 518,340 | 9,379,120 |
| 2065 | 519,319 | 9,391,197 |
| 2064 | 520,157 | 9,402,175 |
| 2063 | 520,866 | 9,412,246 |
| 2062 | 521,364 | 9,423,109 |
| 2061 | 521,880 | 9,434,937 |
| 2060 | 522,301 | 9,443,858 |
| 2059 | 522,678 | 9,454,223 |
| 2058 | 523,011 | 9,462,577 |
| 2057 | 523,253 | 9,468,254 |
| 2056 | 523,298 | 9,475,514 |
| 2055 | 523,308 | 9,483,998 |
| 2054 | 523,127 | 9,491,408 |
| 2053 | 522,924 | 9,496,551 |
| 2052 | 522,555 | 9,496,579 |
| 2051 | 521,910 | 9,496,556 |
| 2050 | 521,119 | 9,494,698 |
| 2049 | 520,183 | 9,491,222 |
| 2048 | 519,132 | 9,484,200 |
| 2047 | 517,984 | 9,477,140 |
| 2046 | 516,748 | 9,471,007 |
| 2045 | 515,241 | 9,465,183 |
| 2044 | 513,822 | 9,458,151 |
| 2043 | 512,299 | 9,450,730 |
| 2042 | 510,642 | 9,440,733 |
| 2041 | 508,802 | 9,433,753 |
| 2040 | 506,973 | 9,422,510 |
| 2039 | 504,969 | 9,413,795 |
| 2038 | 502,664 | 9,404,803 |
| 2037 | 500,520 | 9,393,982 |
| 2036 | 498,350 | 9,382,127 |
| 2035 | 495,973 | 9,368,526 |
| 2034 | 493,539 | 9,351,603 |
| 2033 | 491,041 | 9,334,357 |
| 2032 | 488,550 | 9,315,617 |
| 2031 | 485,750 | 9,292,331 |
| 2030 | 482,789 | 9,267,380 |
| 2029 | 479,823 | 9,240,823 |
| 2028 | 476,642 | 9,209,567 |
| 2027 | 473,245 | 9,174,540 |
| 2026 | 469,856 | 9,136,169 |
| 2025 | 466,330 | 9,092,436 |
| 2024 | 462,721 | 9,005,582 |
| 2023 | 458,949 | 8,888,822 |
| 2022 | 455,370 | 8,777,088 |
| 2021 | 451,721 | 8,704,546 |
| 2020 | 447,404 | 8,638,167 |
| 2019 | 442,680 | 8,575,280 |
| 2018 | 437,810 | 8,514,329 |
| 2017 | 432,772 | 8,451,840 |
| 2016 | 427,564 | 8,373,338 |
| 2015 | 422,212 | 8,282,396 |
| 2014 | 416,750 | 8,188,649 |
| 2013 | 411,202 | 8,089,346 |
| 2012 | 405,557 | 7,996,861 |
| 2011 | 399,389 | 7,912,398 |
| 2010 | 392,332 | 7,824,909 |
| 2009 | 384,952 | 7,743,831 |
| 2008 | 377,793 | 7,647,675 |
| 2007 | 370,873 | 7,551,117 |
| 2006 | 364,663 | 7,483,934 |
| 2005 | 358,916 | 7,437,115 |
| 2004 | 352,911 | 7,389,625 |
| 2003 | 346,637 | 7,339,001 |
| 2002 | 340,099 | 7,284,753 |
| 2001 | 333,345 | 7,229,854 |
| 2000 | 326,424 | 7,184,250 |
| 1999 | 319,411 | 7,143,991 |
| 1998 | 312,385 | 7,110,001 |
| 1997 | 305,341 | 7,088,906 |
| 1996 | 298,276 | 7,071,850 |
| 1995 | 291,195 | 7,040,687 |
| 1994 | 284,091 | 6,993,795 |
| 1993 | 276,971 | 6,938,265 |
| 1992 | 269,839 | 6,875,364 |
| 1991 | 262,596 | 6,799,978 |
| 1990 | 255,292 | 6,715,519 |
| 1989 | 248,064 | 6,646,912 |
| 1988 | 240,913 | 6,593,386 |
| 1987 | 233,860 | 6,545,106 |
| 1986 | 226,495 | 6,504,124 |
| 1985 | 218,919 | 6,470,365 |
| 1984 | 211,661 | 6,441,865 |
| 1983 | 204,741 | 6,418,773 |
| 1982 | 198,165 | 6,391,309 |
| 1981 | 191,977 | 6,354,074 |
| 1980 | 186,111 | 6,319,408 |
| 1979 | 180,422 | 6,294,365 |
| 1978 | 174,884 | 6,281,738 |
| 1977 | 169,277 | 6,281,174 |
| 1976 | 163,607 | 6,302,504 |
| 1975 | 158,070 | 6,338,632 |
| 1974 | 152,656 | 6,341,405 |
| 1973 | 147,369 | 6,307,347 |
| 1972 | 142,189 | 6,260,956 |
| 1971 | 137,921 | 6,213,399 |
| 1970 | 135,138 | 6,180,877 |
| 1969 | 131,446 | 6,136,387 |
| 1968 | 126,222 | 6,067,714 |
| 1967 | 121,017 | 5,991,785 |
| 1966 | 115,874 | 5,918,002 |
| 1965 | 110,838 | 5,856,472 |
| 1964 | 105,922 | 5,789,228 |
| 1963 | 101,159 | 5,694,247 |
| 1962 | 96,719 | 5,573,815 |
| 1961 | 92,517 | 5,434,294 |
| 1960 | 88,347 | 5,327,827 |
Data sources: United Nations | World Population Prospects (2026–2100, retrieved 2026-07-08); World Bank | Health (1960–2025, retrieved 2026-07-08).
GeoRank.org/population/brunei/switzerland | CC BY 
From 2006 to 2016, the population of Brunei increased by 62,901 people (a 17.2% growth), while Switzerland gained 889,404 people (a 11.9% growth).
For the next 10 years, from 2016 to 2026, Brunei gained 44,032 people (a 10.3% growth), while Switzerland's population increased by 782,540 people (a 9.35% growth).
Brunei was ranked 169th most populous country in 2006 and is 170th in 2026. Switzerland was ranked 96th in 2006 and ranked 99th now.
The UN's World Population Prospects forecasts that in 24 years (in 2050) Brunei's population will grow by 10.5% to 521,119 people with a rank change from 170th to 171st. The population of Switzerland will increase by 3.7% to 9,494,698 people and rank change from 99th to 102nd.
Brunei is projected to reach its peak in 2055 at 523K people compared to the peak of 9.5M people in 2052 for Switzerland.
Population growth rate by year
| Year | Growth rate | |
|---|---|---|
|
Brunei
|
Switzerland
|
|
| 2100 | -0.33% | 0.08% |
| 2099 | -0.32% | 0.07% |
| 2098 | -0.3% | 0.08% |
| 2097 | -0.32% | 0.04% |
| 2096 | -0.3% | 0.06% |
| 2095 | -0.32% | 0.05% |
| 2094 | -0.31% | 0.03% |
| 2093 | -0.32% | 0.03% |
| 2092 | -0.31% | 0.03% |
| 2091 | -0.32% | 0.02% |
| 2090 | -0.34% | 0.004% |
| 2089 | -0.34% | -0.01% |
| 2088 | -0.32% | 0.004% |
| 2087 | -0.31% | -0.02% |
| 2086 | -0.33% | -0.05% |
| 2085 | -0.32% | -0.05% |
| 2084 | -0.34% | -0.05% |
| 2083 | -0.34% | -0.06% |
| 2082 | -0.33% | -0.07% |
| 2081 | -0.32% | -0.07% |
| 2080 | -0.31% | -0.08% |
| 2079 | -0.3% | -0.07% |
| 2078 | -0.32% | -0.08% |
| 2077 | -0.3% | -0.05% |
| 2076 | -0.35% | -0.06% |
| 2075 | -0.33% | -0.12% |
| 2074 | -0.3% | -0.1% |
| 2073 | -0.28% | -0.08% |
| 2072 | -0.24% | -0.1% |
| 2071 | -0.23% | -0.12% |
| 2070 | -0.25% | -0.09% |
| 2069 | -0.26% | -0.09% |
| 2068 | -0.26% | -0.08% |
| 2067 | -0.21% | -0.13% |
| 2066 | -0.19% | -0.13% |
| 2065 | -0.16% | -0.12% |
| 2064 | -0.14% | -0.11% |
| 2063 | -0.1% | -0.12% |
| 2062 | -0.1% | -0.13% |
| 2061 | -0.08% | -0.09% |
| 2060 | -0.07% | -0.11% |
| 2059 | -0.06% | -0.09% |
| 2058 | -0.05% | -0.06% |
| 2057 | -0.009% | -0.08% |
| 2056 | -0.002% | -0.09% |
| 2055 | 0.03% | -0.08% |
| 2054 | 0.04% | -0.05% |
| 2053 | 0.07% | -0% |
| 2052 | 0.12% | 0% |
| 2051 | 0.15% | 0.02% |
| 2050 | 0.18% | 0.04% |
| 2049 | 0.2% | 0.07% |
| 2048 | 0.22% | 0.07% |
| 2047 | 0.24% | 0.06% |
| 2046 | 0.29% | 0.06% |
| 2045 | 0.28% | 0.07% |
| 2044 | 0.3% | 0.08% |
| 2043 | 0.32% | 0.11% |
| 2042 | 0.36% | 0.07% |
| 2041 | 0.36% | 0.12% |
| 2040 | 0.4% | 0.09% |
| 2039 | 0.46% | 0.1% |
| 2038 | 0.43% | 0.12% |
| 2037 | 0.44% | 0.13% |
| 2036 | 0.48% | 0.15% |
| 2035 | 0.49% | 0.18% |
| 2034 | 0.51% | 0.18% |
| 2033 | 0.51% | 0.2% |
| 2032 | 0.58% | 0.25% |
| 2031 | 0.61% | 0.27% |
| 2030 | 0.62% | 0.29% |
| 2029 | 0.67% | 0.34% |
| 2028 | 0.72% | 0.38% |
| 2027 | 0.72% | 0.42% |
| 2026 | 0.76% | 0.48% |
| 2025 | 0.78% | 0.96% |
| 2024 | 0.82% | 1.31% |
| 2023 | 0.79% | 1.27% |
| 2022 | 0.81% | 0.83% |
| 2021 | 0.96% | 0.77% |
| 2020 | 1.07% | 0.73% |
| 2019 | 1.11% | 0.72% |
| 2018 | 1.16% | 0.74% |
| 2017 | 1.22% | 0.94% |
| 2016 | 1.27% | 1.1% |
| 2015 | 1.31% | 1.14% |
| 2014 | 1.35% | 1.23% |
| 2013 | 1.39% | 1.16% |
| 2012 | 1.54% | 1.07% |
| 2011 | 1.8% | 1.12% |
| 2010 | 1.92% | 1.05% |
| 2009 | 1.89% | 1.26% |
| 2008 | 1.87% | 1.28% |
| 2007 | 1.7% | 0.9% |
| 2006 | 1.6% | 0.63% |
| 2005 | 1.7% | 0.64% |
| 2004 | 1.81% | 0.69% |
| 2003 | 1.92% | 0.74% |
| 2002 | 2.03% | 0.76% |
| 2001 | 2.12% | 0.63% |
| 2000 | 2.2% | 0.56% |
| 1999 | 2.25% | 0.48% |
| 1998 | 2.31% | 0.3% |
| 1997 | 2.37% | 0.24% |
| 1996 | 2.43% | 0.44% |
| 1995 | 2.5% | 0.67% |
| 1994 | 2.57% | 0.8% |
| 1993 | 2.64% | 0.91% |
| 1992 | 2.76% | 1.11% |
| 1991 | 2.86% | 1.26% |
| 1990 | 2.91% | 1.03% |
| 1989 | 2.97% | 0.81% |
| 1988 | 3.02% | 0.74% |
| 1987 | 3.25% | 0.63% |
| 1986 | 3.46% | 0.52% |
| 1985 | 3.43% | 0.44% |
| 1984 | 3.38% | 0.36% |
| 1983 | 3.32% | 0.43% |
| 1982 | 3.22% | 0.59% |
| 1981 | 3.15% | 0.55% |
| 1980 | 3.15% | 0.4% |
| 1979 | 3.17% | 0.2% |
| 1978 | 3.31% | 0.009% |
| 1977 | 3.47% | -0.34% |
| 1976 | 3.5% | -0.57% |
| 1975 | 3.55% | -0.04% |
| 1974 | 3.59% | 0.54% |
| 1973 | 3.64% | 0.74% |
| 1972 | 3.09% | 0.77% |
| 1971 | 2.06% | 0.53% |
| 1970 | 2.81% | 0.73% |
| 1969 | 4.14% | 1.13% |
| 1968 | 4.3% | 1.27% |
| 1967 | 4.44% | 1.25% |
| 1966 | 4.54% | 1.05% |
| 1965 | 4.64% | 1.16% |
| 1964 | 4.71% | 1.67% |
| 1963 | 4.59% | 2.16% |
| 1962 | 4.54% | 2.57% |
| 1961 | 4.72% | 2% |
Data sources: United Nations | World Population Prospects (2026–2100, retrieved 2026-07-08); World Bank | Health (1961–2025, retrieved 2026-07-08).
GeoRank.org/population/brunei/switzerland | CC BY
In 2025, the population of Brunei grew by 0.78%, while Switzerland's population grew by 0.96%.
Live population counters
|
Brunei
|
Switzerland
|
|
|---|---|---|
| Current population |
471596
|
9155878
|
| Population rank | 170/197 | 99/197 |
| Percent of world population | 0.006% | 0.11% |
| One net population change |
2.43 hours
|
6.07 minutes
|
| One birth every |
1.42 hours
|
6.71 minutes
|
| One death every |
3.55 hours
|
7.3 minutes
|
| Daily growth/decline | +10 | +238 |
| Annual growth/decline | +3,609 | +86,854 |
| Annual growth/decline rate | +0.78% | +0.96% |
| Population growth rate rank | 113/197 | 101/197 |
| One migration net change every |
1.08 years
|
14.1 minutes
|
| Annual migration change | +0 | +37,253 |
| Net migration rank | 77/196 | 25/196 |
| Foreign-born residents | 119,933 | 2,773,840 |
| Foreign-born residents rank | 124/195 | 27/195 |
| Foreign-born share of population | 25.9% | 31.1% |
| Foreign-born share rank | 21/195 | 17/195 |
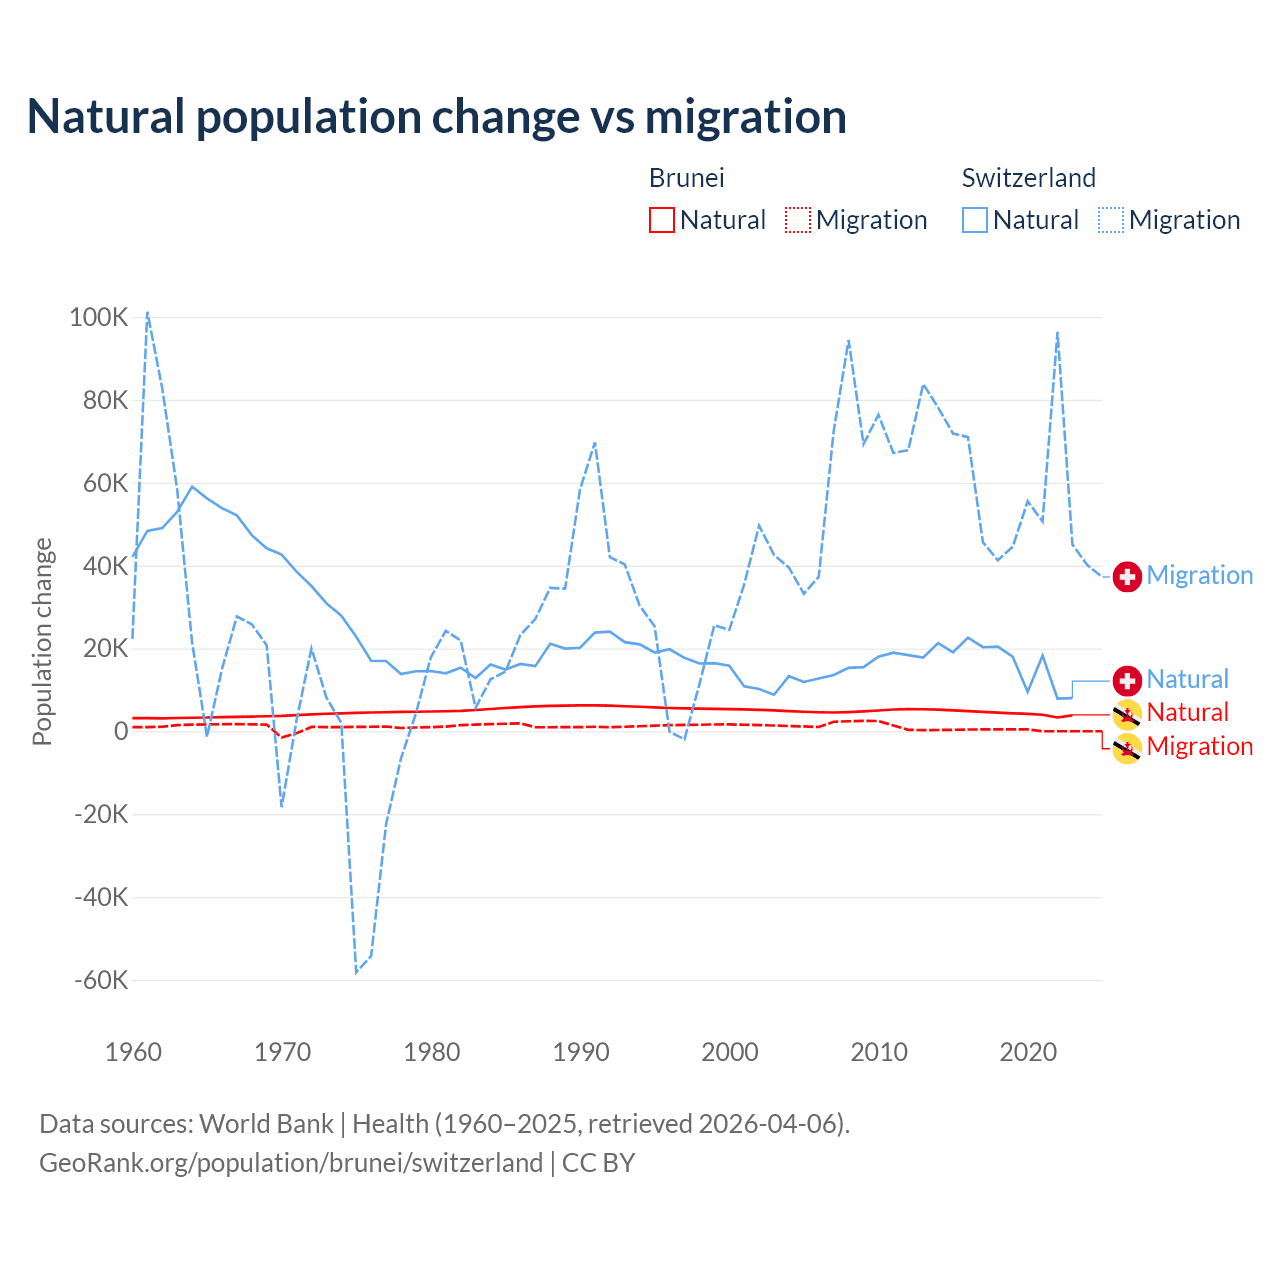
Natural population change vs migration
| Year | Population change | |||
|---|---|---|---|---|
|
Brunei
|
Switzerland
|
|||
| Natural | Migration | Natural | Migration | |
| 2025 | - | 0 | - | 37,253 |
| 2024 | 3,699 | 0 | 6,304 | 40,099 |
| 2023 | 3,837 | 0 | 8,000 | 45,098 |
| 2022 | 3,319 | 0 | 7,899 | 96,424 |
| 2021 | 3,985 | 0 | 18,279 | 50,665 |
| 2020 | 4,188 | 462 | 9,502 | 55,523 |
| 2019 | 4,335 | 456 | 18,008 | 44,517 |
| 2018 | 4,502 | 450 | 20,434 | 41,253 |
| 2017 | 4,685 | 440 | 20,284 | 45,658 |
| 2016 | 4,876 | 415 | 22,608 | 71,009 |
| 2015 | 5,060 | 356 | 19,050 | 71,876 |
| 2014 | 5,206 | 303 | 21,290 | 78,122 |
| 2013 | 5,302 | 285 | 17,797 | 83,823 |
| 2012 | 5,349 | 346 | 18,393 | 67,840 |
| 2011 | 5,242 | 1,399 | 18,990 | 67,194 |
| 2010 | 5,003 | 2,479 | 17,997 | 76,388 |
| 2009 | 4,789 | 2,489 | 15,487 | 69,324 |
| 2008 | 4,624 | 2,409 | 15,295 | 94,430 |
| 2007 | 4,521 | 2,291 | 13,592 | 72,475 |
| 2006 | 4,590 | 1,030 | 12,723 | 37,308 |
| 2005 | 4,703 | 1,163 | 11,899 | 33,203 |
| 2004 | 4,874 | 1,261 | 13,302 | 39,484 |
| 2003 | 5,034 | 1,383 | 8,807 | 42,567 |
| 2002 | 5,169 | 1,499 | 10,199 | 49,650 |
| 2001 | 5,275 | 1,569 | 10,845 | 35,420 |
| 2000 | 5,331 | 1,660 | 15,806 | 24,463 |
| 1999 | 5,388 | 1,639 | 16,431 | 25,599 |
| 1998 | 5,466 | 1,566 | 16,353 | 11,325 |
| 1997 | 5,518 | 1,533 | 17,722 | -1,939 |
| 1996 | 5,606 | 1,464 | 19,801 | -131 |
| 1995 | 5,750 | 1,348 | 19,010 | 25,343 |
| 1994 | 5,907 | 1,206 | 20,982 | 30,274 |
| 1993 | 6,045 | 1,082 | 21,509 | 40,267 |
| 1992 | 6,169 | 969 | 24,064 | 42,014 |
| 1991 | 6,259 | 1,087 | 23,800 | 69,738 |
| 1990 | 6,265 | 992 | 20,146 | 58,428 |
| 1989 | 6,202 | 1,002 | 19,941 | 34,432 |
| 1988 | 6,135 | 962 | 21,099 | 34,602 |
| 1987 | 6,017 | 994 | 15,708 | 27,081 |
| 1986 | 5,826 | 1,897 | 16,261 | 23,242 |
| 1985 | 5,620 | 1,808 | 14,882 | 14,402 |
| 1984 | 5,373 | 1,722 | 16,105 | 12,532 |
| 1983 | 5,138 | 1,602 | 12,837 | 5,663 |
| 1982 | 4,931 | 1,475 | 15,339 | 21,929 |
| 1981 | 4,839 | 1,124 | 13,979 | 24,229 |
| 1980 | 4,775 | 995 | 14,535 | 17,841 |
| 1979 | 4,717 | 899 | 14,477 | 4,262 |
| 1978 | 4,668 | 791 | 13,820 | -6,552 |
| 1977 | 4,594 | 1,157 | 16,959 | -22,516 |
| 1976 | 4,518 | 1,080 | 17,017 | -54,255 |
| 1975 | 4,431 | 1,047 | 22,820 | -58,187 |
| 1974 | 4,334 | 1,011 | 27,902 | 2,008 |
| 1973 | 4,216 | 1,007 | 30,906 | 8,158 |
| 1972 | 4,085 | 1,053 | 35,061 | 19,991 |
| 1971 | 3,880 | -476 | 38,523 | 2,636 |
| 1970 | 3,694 | -1,538 | 42,648 | -18,326 |
| 1969 | 3,618 | 1,608 | 44,182 | 20,754 |
| 1968 | 3,551 | 1,677 | 47,328 | 25,828 |
| 1967 | 3,477 | 1,703 | 52,128 | 27,697 |
| 1966 | 3,403 | 1,697 | 53,854 | 14,979 |
| 1965 | 3,326 | 1,655 | 56,222 | -1,351 |
| 1964 | 3,264 | 1,595 | 59,050 | 21,455 |
| 1963 | 3,195 | 1,469 | 52,956 | 58,415 |
| 1962 | 3,128 | 1,088 | 49,050 | 82,798 |
| 1961 | 3,175 | 1,014 | 48,365 | 101,278 |
| 1960 | 3,168 | 982 | 42,090 | 22,313 |
Data sources: World Bank | Health (1960–2025, retrieved 2026-07-08).
GeoRank.org/population/brunei/switzerland | CC BY
Over the last 10 years, 94.3% of the population change in Brunei is from natural causes (a gain of 42,486 people) and 5.72% is from migration (a gain of 2,579 people). In Switzerland 21.1% is from natural causes (a gain of 150,368 people) and 78.9% is from migration (a gain of 562,122 people).
As of 2024, 119,933 residents or 25.9% of the population were not native-born in Brunei, compared to 2,773,840 people or 31.1% in Switzerland.
Biggest cities by population
|
Brunei
|
|
|---|---|
| City | Population |
| Kuala Belait | 70K |
| Bandar Seri Begawan | 50K |
| Seria | 2.66K |
|
Switzerland
|
|
|---|---|
| City | Population |
| Zurich | 452K |
| Geneva | 209K |
| Basel | 176K |
| Bern | 146K |
| Lausanne | 145K |
| Winterthur | 120K |
| Lucerne | 86.2K |
| St. Gallen | 78.9K |
| Lugano | 63.5K |
| Biel/Bienne | 55.9K |
Compare countries by 7 more topics
Population differences between Brunei and Switzerland
|
Brunei
|
Switzerland
|
|
|---|---|---|
| Life expectancy | 75.8 years | 84.4 years |
| Average age | 34.3 years | 43.4 years |
| Median age | 33.7 years | 43.9 years |
| Male:Female ratio | 53.1:46.9 | 49.7:50.3 |
| Fertility rate | 1.73 births per woman | 1.29 births per woman |
| Population density | 230.9 ppl/mi² | 599 ppl/mi² |
Population map with other countries
Data sources: World Bank | Health (1960–2025, retrieved 2026-07-08); United Nations | World Population Prospects (1960–2026, retrieved 2026-07-08); U.S. Census Bureau (1960–2025, retrieved 2026-07-08); Central Intelligence Agency (CIA) (2000–2019, retrieved 2026-07-08).
GeoRank.org/population/brunei/switzerland | CC BY
Help us show the world through your eyes
Share a photo of your city and help others discover what it looks like to live there. Your contribution makes our data come alive.
Data sources:
- World Bank | Health (1960–2025, retrieved 2026-07-08)
- United Nations | World Population Prospects (1960–2100, retrieved 2026-07-08)
- U.S. Census Bureau (1960–2025, retrieved 2026-07-08)
- Central Intelligence Agency (CIA) (2000–2019, retrieved 2026-07-08)
- Wikidata (2026, retrieved 2026-07-08)
Creative Commons Attribution (CC BY) — you’re free to copy, share, remix, adapt, and use even commercially as long as you give appropriate credit and clearly indicate if you made changes. Other sources may be subject to different license terms.