The latest officially reported population of the Marshall Islands was 36,282 in 2025 vs 3,092,816 people in Namibia in 2025. In 2026, based on the adjusted UN estimation, the current Marshall Islands' population is 35,039 people compared to 3,185,686 in Namibia.
Population statistics:
- Namibia's population is 90.9 times bigger than the Marshall Islands'.
- The Marshall Islands is ranked the 192nd most populous country in the world, while Namibia is the 134th.
- The countries together account for 0.04% of the world: 0.0004% for the Marshall Islands vs 0.04% for Namibia.
- For the last 10 years, the Marshall Islands has had an average growth rate of -2.84% per year vs +2.68% in Namibia.
- Since 2006, the population of the Marshall Islands has decreased from 52K people to 35K (32.6% decline), while Namibia has grown from 1.99M to 3.19M (59.9% growth).
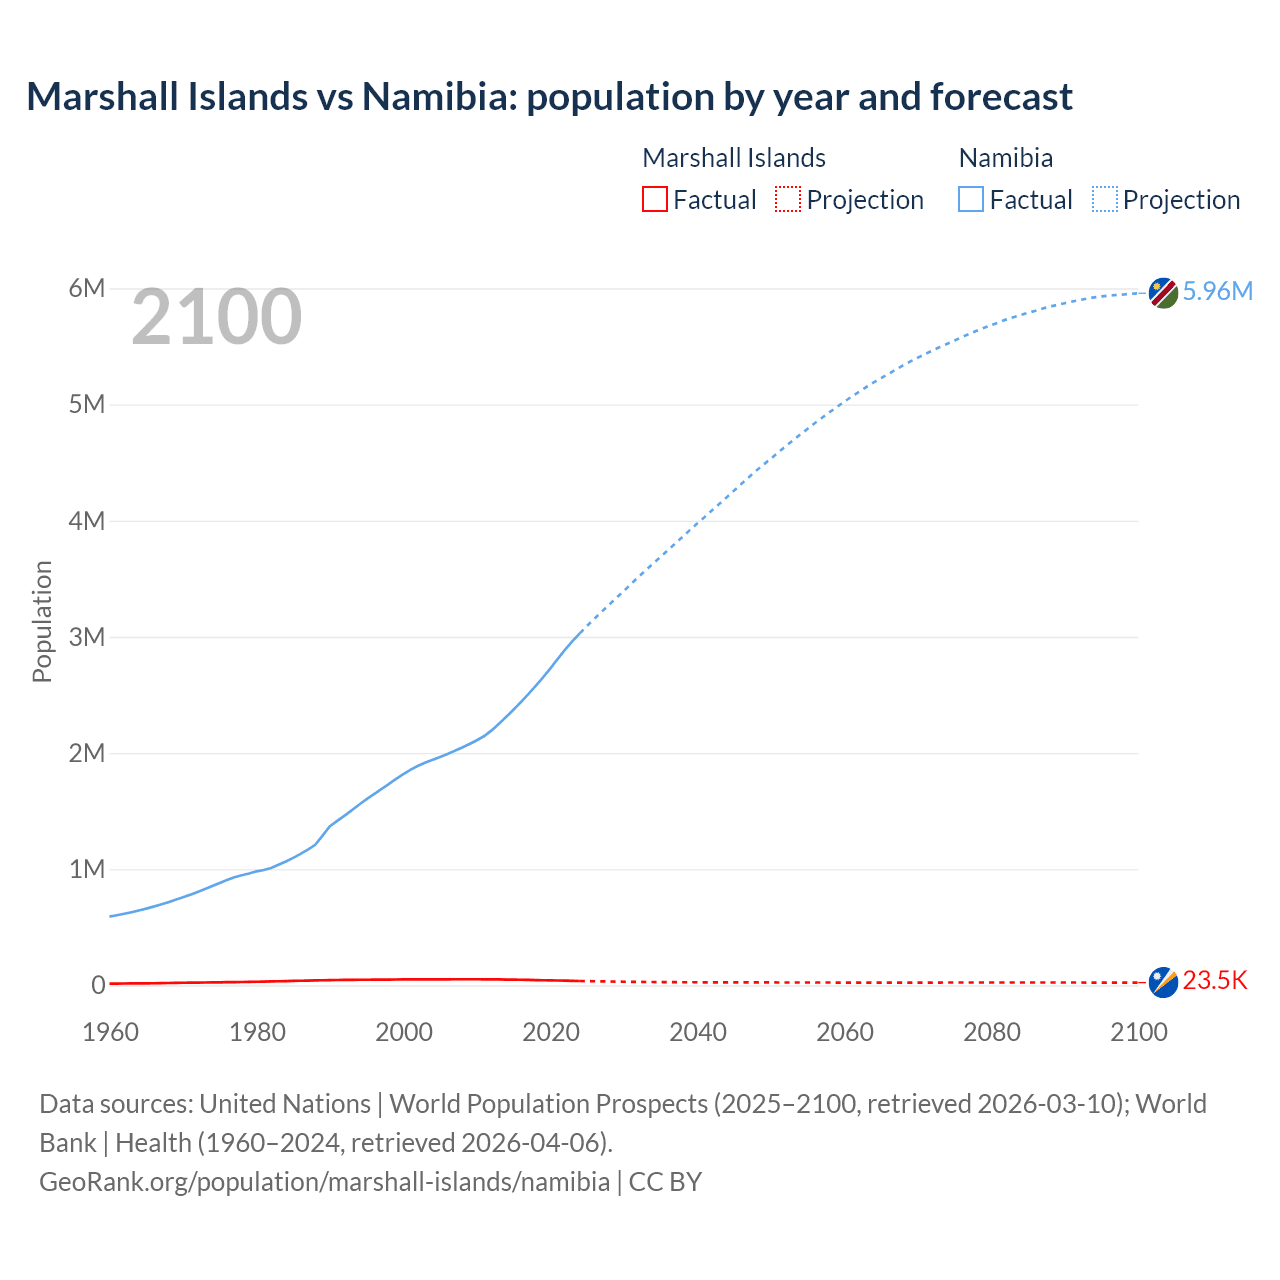
Marshall Islands vs Namibia: population by year and forecast
| Year | Population | |
|---|---|---|
 Marshall Islands
|
 Namibia
|
|
| 2100 | 23,445 | 5,954,393 |
| 2099 | 23,524 | 5,948,866 |
| 2098 | 23,613 | 5,943,388 |
| 2097 | 23,708 | 5,938,535 |
| 2096 | 23,784 | 5,934,414 |
| 2095 | 23,867 | 5,926,652 |
| 2094 | 23,935 | 5,918,510 |
| 2093 | 24,009 | 5,907,504 |
| 2092 | 24,079 | 5,895,303 |
| 2091 | 24,137 | 5,882,775 |
| 2090 | 24,185 | 5,868,232 |
| 2089 | 24,240 | 5,854,537 |
| 2088 | 24,272 | 5,839,032 |
| 2087 | 24,301 | 5,822,179 |
| 2086 | 24,316 | 5,802,978 |
| 2085 | 24,335 | 5,785,593 |
| 2084 | 24,342 | 5,767,408 |
| 2083 | 24,331 | 5,747,980 |
| 2082 | 24,315 | 5,727,031 |
| 2081 | 24,304 | 5,703,874 |
| 2080 | 24,278 | 5,679,256 |
| 2079 | 24,256 | 5,656,126 |
| 2078 | 24,214 | 5,630,757 |
| 2077 | 24,172 | 5,604,556 |
| 2076 | 24,138 | 5,577,307 |
| 2075 | 24,083 | 5,547,604 |
| 2074 | 24,049 | 5,518,540 |
| 2073 | 24,000 | 5,490,713 |
| 2072 | 23,969 | 5,461,300 |
| 2071 | 23,931 | 5,431,031 |
| 2070 | 23,889 | 5,400,411 |
| 2069 | 23,857 | 5,368,127 |
| 2068 | 23,815 | 5,333,582 |
| 2067 | 23,795 | 5,297,361 |
| 2066 | 23,763 | 5,259,869 |
| 2065 | 23,762 | 5,224,047 |
| 2064 | 23,766 | 5,187,047 |
| 2063 | 23,778 | 5,147,329 |
| 2062 | 23,818 | 5,106,535 |
| 2061 | 23,869 | 5,065,279 |
| 2060 | 23,917 | 5,020,417 |
| 2059 | 23,981 | 4,976,448 |
| 2058 | 24,028 | 4,930,850 |
| 2057 | 24,106 | 4,884,900 |
| 2056 | 24,194 | 4,837,482 |
| 2055 | 24,305 | 4,787,824 |
| 2054 | 24,411 | 4,738,949 |
| 2053 | 24,502 | 4,688,219 |
| 2052 | 24,602 | 4,636,907 |
| 2051 | 24,714 | 4,584,458 |
| 2050 | 24,811 | 4,530,641 |
| 2049 | 24,935 | 4,479,821 |
| 2048 | 25,047 | 4,427,513 |
| 2047 | 25,155 | 4,370,836 |
| 2046 | 25,267 | 4,315,325 |
| 2045 | 25,394 | 4,256,478 |
| 2044 | 25,531 | 4,199,686 |
| 2043 | 25,687 | 4,142,276 |
| 2042 | 25,846 | 4,086,133 |
| 2041 | 26,033 | 4,029,802 |
| 2040 | 26,249 | 3,974,477 |
| 2039 | 26,493 | 3,918,246 |
| 2038 | 26,759 | 3,859,577 |
| 2037 | 27,090 | 3,802,081 |
| 2036 | 27,446 | 3,744,707 |
| 2035 | 27,874 | 3,686,835 |
| 2034 | 28,364 | 3,629,445 |
| 2033 | 28,919 | 3,572,743 |
| 2032 | 29,543 | 3,514,091 |
| 2031 | 30,251 | 3,454,083 |
| 2030 | 31,054 | 3,393,821 |
| 2029 | 31,943 | 3,334,592 |
| 2028 | 32,879 | 3,275,360 |
| 2027 | 33,909 | 3,214,886 |
| 2026 | 35,039 | 3,154,846 |
| 2025 | 36,282 | 3,092,816 |
| 2024 | 37,548 | 3,030,131 |
| 2023 | 38,827 | 2,963,095 |
| 2022 | 40,077 | 2,889,662 |
| 2021 | 41,367 | 2,810,548 |
| 2020 | 42,706 | 2,728,762 |
| 2019 | 44,007 | 2,650,494 |
| 2018 | 45,285 | 2,577,327 |
| 2017 | 46,529 | 2,506,853 |
| 2016 | 47,709 | 2,439,213 |
| 2015 | 48,800 | 2,374,300 |
| 2014 | 49,796 | 2,312,139 |
| 2013 | 50,681 | 2,252,508 |
| 2012 | 51,419 | 2,194,654 |
| 2011 | 51,907 | 2,146,325 |
| 2010 | 52,044 | 2,109,811 |
| 2009 | 52,019 | 2,077,394 |
| 2008 | 52,030 | 2,047,056 |
| 2007 | 52,035 | 2,018,600 |
| 2006 | 51,992 | 1,991,888 |
| 2005 | 51,906 | 1,966,582 |
| 2004 | 51,791 | 1,942,082 |
| 2003 | 51,639 | 1,917,464 |
| 2002 | 51,425 | 1,889,970 |
| 2001 | 51,123 | 1,857,048 |
| 2000 | 50,706 | 1,818,647 |
| 1999 | 50,202 | 1,776,368 |
| 1998 | 49,717 | 1,732,745 |
| 1997 | 49,259 | 1,689,264 |
| 1996 | 48,775 | 1,646,103 |
| 1995 | 48,266 | 1,602,170 |
| 1994 | 47,712 | 1,556,304 |
| 1993 | 47,093 | 1,508,697 |
| 1992 | 46,388 | 1,461,322 |
| 1991 | 45,568 | 1,415,684 |
| 1990 | 44,629 | 1,369,303 |
| 1989 | 43,586 | 1,288,947 |
| 1988 | 42,321 | 1,209,696 |
| 1987 | 40,828 | 1,167,889 |
| 1986 | 39,286 | 1,131,081 |
| 1985 | 37,761 | 1,096,890 |
| 1984 | 36,264 | 1,065,989 |
| 1983 | 34,811 | 1,037,511 |
| 1982 | 33,397 | 1,010,308 |
| 1981 | 32,017 | 992,500 |
| 1980 | 30,774 | 981,434 |
| 1979 | 29,738 | 962,825 |
| 1978 | 28,809 | 947,269 |
| 1977 | 27,906 | 931,104 |
| 1976 | 27,021 | 906,566 |
| 1975 | 26,154 | 881,032 |
| 1974 | 25,296 | 854,320 |
| 1973 | 24,581 | 828,928 |
| 1972 | 23,992 | 804,399 |
| 1971 | 23,366 | 780,584 |
| 1970 | 22,530 | 757,868 |
| 1969 | 21,305 | 736,120 |
| 1968 | 19,862 | 715,542 |
| 1967 | 18,655 | 696,045 |
| 1966 | 17,927 | 677,655 |
| 1965 | 17,402 | 660,558 |
| 1964 | 16,852 | 644,530 |
| 1963 | 16,302 | 629,589 |
| 1962 | 15,755 | 615,759 |
| 1961 | 15,219 | 603,067 |
| 1960 | 14,703 | 591,465 |
Data sources: United Nations | World Population Prospects (2026–2100, retrieved 2026-07-08); World Bank | Health (1960–2025, retrieved 2026-07-08).
GeoRank.org/population/marshall-islands/namibia | CC BY 
From 2006 to 2016, the population of the Marshall Islands decreased by 4,283 people (a 8.24% decline), while Namibia gained 447,325 people (a 22.5% growth).
For the next 10 years, from 2016 to 2026, the Marshall Islands lost 12,670 people (a 26.6% decline), while Namibia's population increased by 746,473 people (a 30.6% growth).
The Marshall Islands was ranked 188th most populous country in 2006 and is 192nd in 2026. Namibia was ranked 143rd in 2006 and ranked 134th now.
The UN's World Population Prospects forecasts that in 24 years (in 2050) the Marshall Islands' population will shrink by 29.2% to 24,811 people with a rank change from 192nd to 193rd. The population of Namibia will increase by 42.2% to 4,530,641 people and rank change from 134th to 131st.
Namibia is projected to reach its peak in 2100 at 5.95M people, while the Marshall Islands' population already peaked in 2010 at 52K people and is projected to decrease to 23.4K people by 2100.
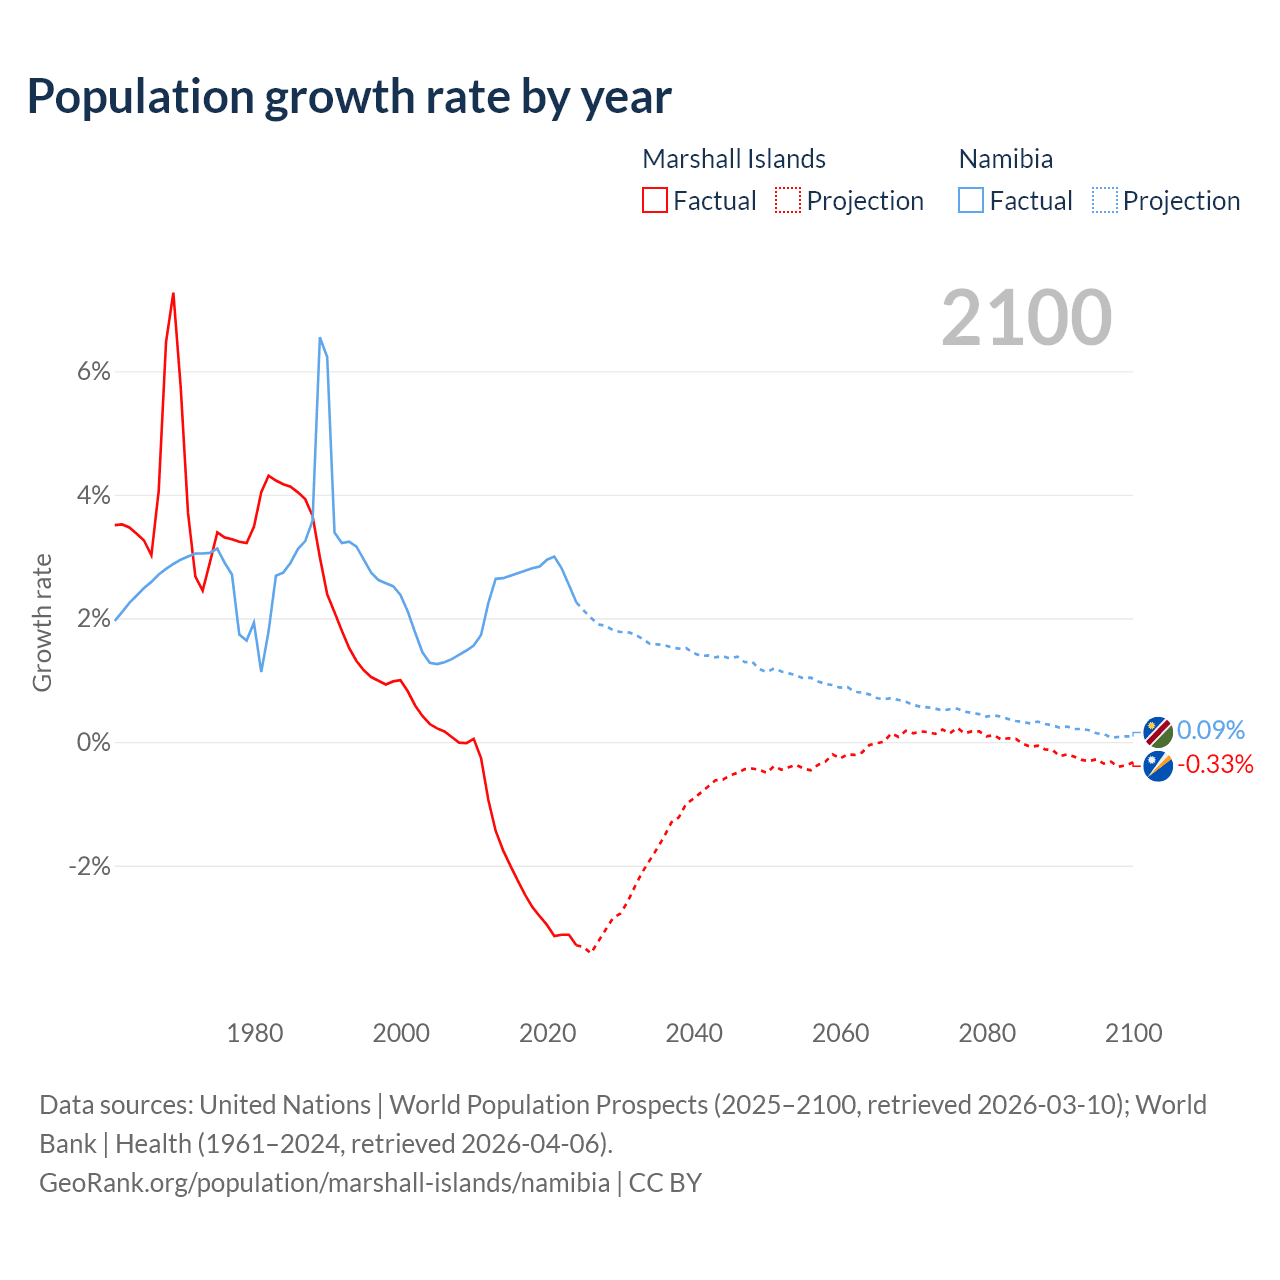
Population growth rate by year
| Year | Growth rate | |
|---|---|---|
|
Marshall Islands
|
Namibia
|
|
| 2100 | -0.33% | 0.09% |
| 2099 | -0.38% | 0.09% |
| 2098 | -0.4% | 0.08% |
| 2097 | -0.32% | 0.07% |
| 2096 | -0.35% | 0.13% |
| 2095 | -0.28% | 0.14% |
| 2094 | -0.31% | 0.19% |
| 2093 | -0.29% | 0.21% |
| 2092 | -0.24% | 0.21% |
| 2091 | -0.2% | 0.25% |
| 2090 | -0.23% | 0.23% |
| 2089 | -0.13% | 0.27% |
| 2088 | -0.12% | 0.29% |
| 2087 | -0.06% | 0.33% |
| 2086 | -0.08% | 0.3% |
| 2085 | -0.03% | 0.32% |
| 2084 | 0.05% | 0.34% |
| 2083 | 0.06% | 0.37% |
| 2082 | 0.04% | 0.41% |
| 2081 | 0.11% | 0.43% |
| 2080 | 0.09% | 0.41% |
| 2079 | 0.17% | 0.45% |
| 2078 | 0.17% | 0.47% |
| 2077 | 0.14% | 0.49% |
| 2076 | 0.23% | 0.54% |
| 2075 | 0.14% | 0.53% |
| 2074 | 0.2% | 0.51% |
| 2073 | 0.13% | 0.54% |
| 2072 | 0.16% | 0.56% |
| 2071 | 0.17% | 0.57% |
| 2070 | 0.14% | 0.6% |
| 2069 | 0.18% | 0.65% |
| 2068 | 0.08% | 0.68% |
| 2067 | 0.14% | 0.71% |
| 2066 | 0.004% | 0.69% |
| 2065 | -0.02% | 0.71% |
| 2064 | -0.05% | 0.77% |
| 2063 | -0.17% | 0.8% |
| 2062 | -0.21% | 0.81% |
| 2061 | -0.2% | 0.89% |
| 2060 | -0.27% | 0.88% |
| 2059 | -0.2% | 0.92% |
| 2058 | -0.32% | 0.94% |
| 2057 | -0.37% | 0.98% |
| 2056 | -0.46% | 1.04% |
| 2055 | -0.43% | 1.03% |
| 2054 | -0.37% | 1.08% |
| 2053 | -0.41% | 1.11% |
| 2052 | -0.45% | 1.14% |
| 2051 | -0.39% | 1.19% |
| 2050 | -0.5% | 1.13% |
| 2049 | -0.45% | 1.18% |
| 2048 | -0.43% | 1.3% |
| 2047 | -0.44% | 1.29% |
| 2046 | -0.5% | 1.38% |
| 2045 | -0.54% | 1.35% |
| 2044 | -0.61% | 1.39% |
| 2043 | -0.62% | 1.37% |
| 2042 | -0.72% | 1.4% |
| 2041 | -0.82% | 1.39% |
| 2040 | -0.92% | 1.44% |
| 2039 | -1% | 1.52% |
| 2038 | -1.22% | 1.51% |
| 2037 | -1.3% | 1.53% |
| 2036 | -1.53% | 1.57% |
| 2035 | -1.73% | 1.58% |
| 2034 | -1.92% | 1.59% |
| 2033 | -2.11% | 1.67% |
| 2032 | -2.34% | 1.74% |
| 2031 | -2.59% | 1.78% |
| 2030 | -2.78% | 1.78% |
| 2029 | -2.85% | 1.81% |
| 2028 | -3.04% | 1.88% |
| 2027 | -3.23% | 1.9% |
| 2026 | -3.42% | 2.01% |
| 2025 | -3.37% | 2.07% |
| 2024 | -3.29% | 2.26% |
| 2023 | -3.12% | 2.54% |
| 2022 | -3.12% | 2.81% |
| 2021 | -3.14% | 3% |
| 2020 | -2.96% | 2.95% |
| 2019 | -2.82% | 2.84% |
| 2018 | -2.67% | 2.81% |
| 2017 | -2.47% | 2.77% |
| 2016 | -2.24% | 2.73% |
| 2015 | -2% | 2.69% |
| 2014 | -1.75% | 2.65% |
| 2013 | -1.44% | 2.64% |
| 2012 | -0.94% | 2.25% |
| 2011 | -0.26% | 1.73% |
| 2010 | 0.05% | 1.56% |
| 2009 | -0.02% | 1.48% |
| 2008 | -0.01% | 1.41% |
| 2007 | 0.08% | 1.34% |
| 2006 | 0.17% | 1.29% |
| 2005 | 0.22% | 1.26% |
| 2004 | 0.29% | 1.28% |
| 2003 | 0.42% | 1.45% |
| 2002 | 0.59% | 1.77% |
| 2001 | 0.82% | 2.11% |
| 2000 | 1% | 2.38% |
| 1999 | 0.98% | 2.52% |
| 1998 | 0.93% | 2.57% |
| 1997 | 0.99% | 2.62% |
| 1996 | 1.05% | 2.74% |
| 1995 | 1.16% | 2.95% |
| 1994 | 1.31% | 3.16% |
| 1993 | 1.52% | 3.24% |
| 1992 | 1.8% | 3.22% |
| 1991 | 2.1% | 3.39% |
| 1990 | 2.39% | 6.23% |
| 1989 | 2.99% | 6.55% |
| 1988 | 3.66% | 3.58% |
| 1987 | 3.93% | 3.25% |
| 1986 | 4.04% | 3.12% |
| 1985 | 4.13% | 2.9% |
| 1984 | 4.17% | 2.74% |
| 1983 | 4.23% | 2.69% |
| 1982 | 4.31% | 1.79% |
| 1981 | 4.04% | 1.13% |
| 1980 | 3.48% | 1.93% |
| 1979 | 3.22% | 1.64% |
| 1978 | 3.24% | 1.74% |
| 1977 | 3.28% | 2.71% |
| 1976 | 3.31% | 2.9% |
| 1975 | 3.39% | 3.13% |
| 1974 | 2.91% | 3.06% |
| 1973 | 2.45% | 3.05% |
| 1972 | 2.68% | 3.05% |
| 1971 | 3.71% | 3% |
| 1970 | 5.75% | 2.95% |
| 1969 | 7.27% | 2.88% |
| 1968 | 6.47% | 2.8% |
| 1967 | 4.06% | 2.71% |
| 1966 | 3.02% | 2.59% |
| 1965 | 3.26% | 2.49% |
| 1964 | 3.37% | 2.37% |
| 1963 | 3.47% | 2.25% |
| 1962 | 3.52% | 2.1% |
| 1961 | 3.51% | 1.96% |
Data sources: United Nations | World Population Prospects (2026–2100, retrieved 2026-07-08); World Bank | Health (1961–2025, retrieved 2026-07-08).
GeoRank.org/population/marshall-islands/namibia | CC BY
In 2025, the population of the Marshall Islands declined by 3.37%, while Namibia's population grew by 2.07%.
Live population counters
|
Marshall Islands
|
Namibia
|
|
|---|---|---|
| Current population |
35039
|
3185686
|
| Population rank | 192/197 | 134/197 |
| Percent of world population | 0.0004% | 0.04% |
| One net population change |
6.94 hours
|
8.41 minutes
|
| One birth every |
11.6 hours
|
6.7 minutes
|
| One death every |
1.37 days
|
28.1 minutes
|
| Daily growth/decline | -3 | +172 |
| Annual growth/decline | -1,266 | +62,685 |
| Annual growth/decline rate | -3.37% | +2.07% |
| Population growth rate rank | 197/197 | 46/197 |
| One migration net change every |
5.17 hours
|
4.71 hours
|
| Annual migration change | -1,698 | +1,866 |
| Net migration rank | 97/196 | 57/196 |
| Foreign-born residents | 3,309 | 116,035 |
| Foreign-born residents rank | 189/195 | 127/195 |
| Foreign-born share of population | 8.8% | 3.8% |
| Foreign-born share rank | 71/195 | 108/195 |
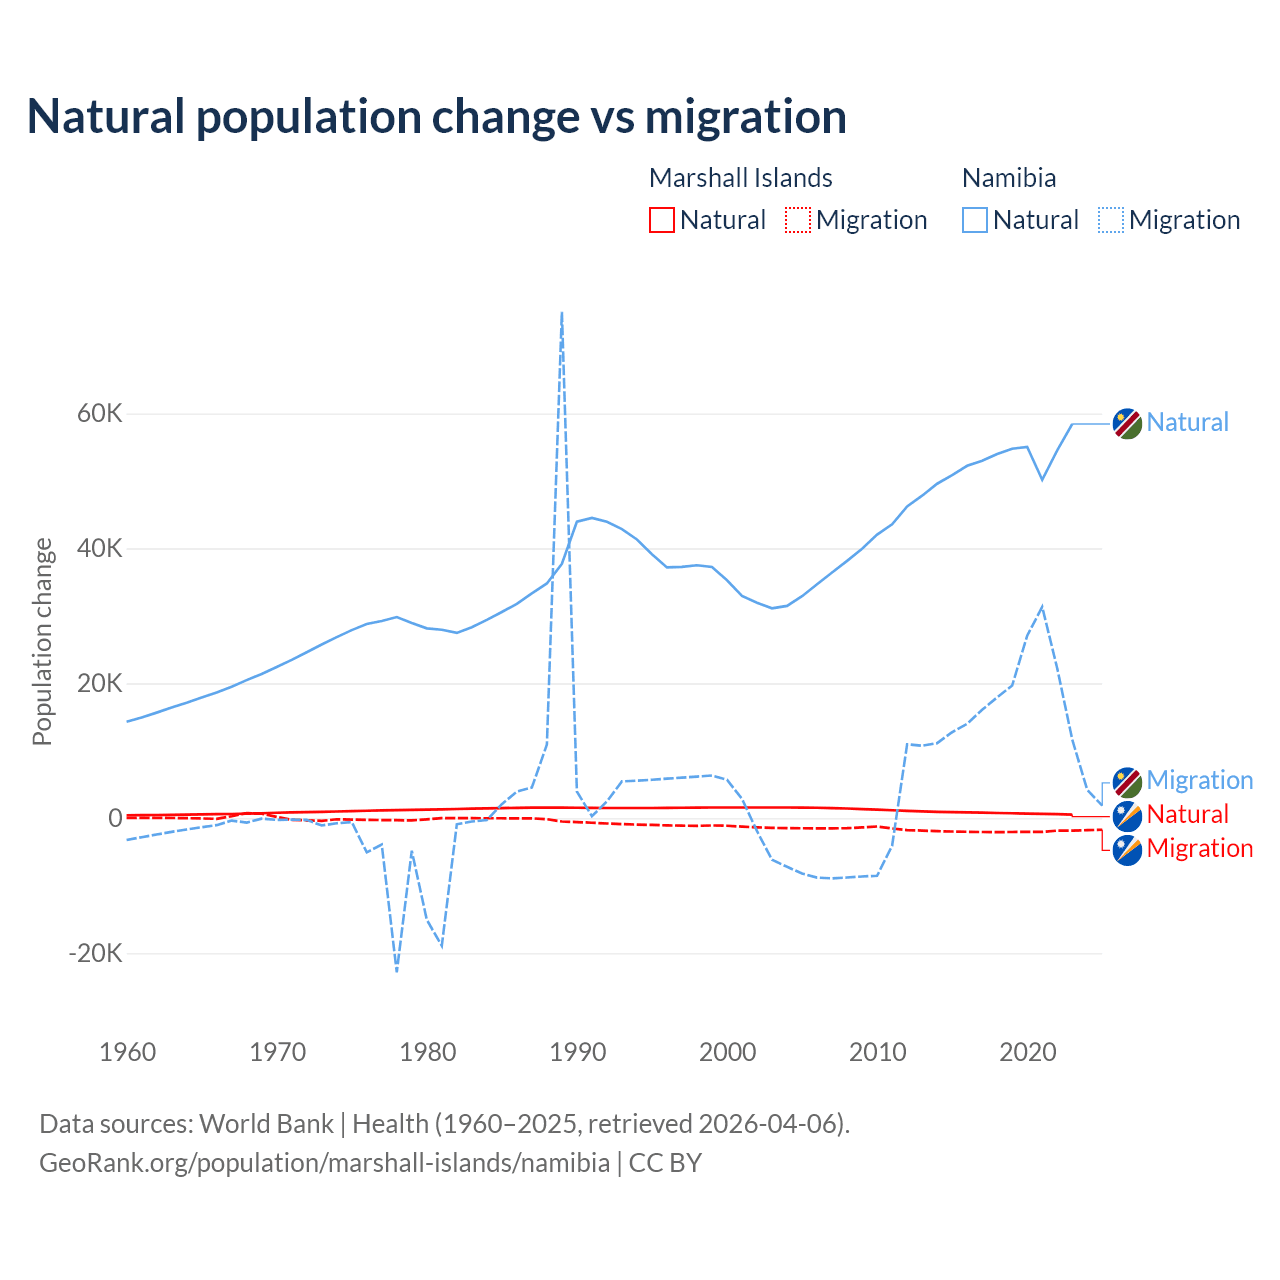
Natural population change vs migration
| Year | Population change | |||
|---|---|---|---|---|
|
Marshall Islands
|
Namibia
|
|||
| Natural | Migration | Natural | Migration | |
| 2025 | - | -1,698 | - | 1,866 |
| 2024 | 487 | -1,765 | 59,739 | 4,211 |
| 2023 | 550 | -1,832 | 58,435 | 11,675 |
| 2022 | 606 | -1,829 | 54,534 | 22,212 |
| 2021 | 653 | -2,016 | 50,160 | 31,327 |
| 2020 | 689 | -2,004 | 55,034 | 27,056 |
| 2019 | 746 | -2,030 | 54,769 | 19,676 |
| 2018 | 785 | -2,058 | 53,970 | 17,920 |
| 2017 | 826 | -2,040 | 52,975 | 16,080 |
| 2016 | 866 | -2,003 | 52,228 | 14,002 |
| 2015 | 912 | -1,964 | 50,846 | 12,755 |
| 2014 | 959 | -1,906 | 49,581 | 11,134 |
| 2013 | 1,014 | -1,825 | 47,801 | 10,748 |
| 2012 | 1,097 | -1,759 | 46,204 | 10,957 |
| 2011 | 1,185 | -1,512 | 43,557 | -4,067 |
| 2010 | 1,273 | -1,221 | 42,046 | -8,518 |
| 2009 | 1,365 | -1,361 | 39,942 | -8,626 |
| 2008 | 1,443 | -1,467 | 38,147 | -8,775 |
| 2007 | 1,507 | -1,491 | 36,430 | -8,905 |
| 2006 | 1,556 | -1,491 | 34,690 | -8,792 |
| 2005 | 1,586 | -1,482 | 32,909 | -8,195 |
| 2004 | 1,595 | -1,466 | 31,478 | -7,192 |
| 2003 | 1,600 | -1,427 | 31,115 | -6,153 |
| 2002 | 1,594 | -1,345 | 31,947 | -1,913 |
| 2001 | 1,596 | -1,237 | 32,942 | 2,869 |
| 2000 | 1,592 | -1,110 | 35,280 | 5,709 |
| 1999 | 1,590 | -1,068 | 37,233 | 6,333 |
| 1998 | 1,576 | -1,124 | 37,500 | 6,180 |
| 1997 | 1,564 | -1,097 | 37,256 | 6,023 |
| 1996 | 1,542 | -1,050 | 37,177 | 5,866 |
| 1995 | 1,522 | -991 | 39,119 | 5,712 |
| 1994 | 1,524 | -942 | 41,316 | 5,578 |
| 1993 | 1,524 | -869 | 42,861 | 5,464 |
| 1992 | 1,525 | -769 | 43,945 | 2,487 |
| 1991 | 1,540 | -661 | 44,523 | 309 |
| 1990 | 1,556 | -562 | 43,956 | 3,969 |
| 1989 | 1,574 | -479 | 37,715 | 75,072 |
| 1988 | 1,575 | -140 | 34,798 | 10,916 |
| 1987 | 1,566 | -16 | 33,340 | 4,559 |
| 1986 | 1,544 | -8 | 31,764 | 3,953 |
| 1985 | 1,511 | -1 | 30,575 | 2,090 |
| 1984 | 1,470 | 6 | 29,395 | -267 |
| 1983 | 1,422 | 12 | 28,307 | -481 |
| 1982 | 1,375 | 23 | 27,474 | -889 |
| 1981 | 1,328 | 31 | 27,938 | -18,901 |
| 1980 | 1,287 | -155 | 28,142 | -15,041 |
| 1979 | 1,250 | -316 | 28,930 | -4,818 |
| 1978 | 1,207 | -286 | 29,821 | -22,827 |
| 1977 | 1,160 | -264 | 29,241 | -3,907 |
| 1976 | 1,109 | -233 | 28,785 | -5,048 |
| 1975 | 1,055 | -193 | 27,882 | -553 |
| 1974 | 1,000 | -145 | 26,844 | -744 |
| 1973 | 954 | -383 | 25,754 | -1,066 |
| 1972 | 913 | -306 | 24,606 | -236 |
| 1971 | 877 | -232 | 23,467 | -208 |
| 1970 | 819 | 201 | 22,414 | -244 |
| 1969 | 747 | 690 | 21,387 | -57 |
| 1968 | 685 | 769 | 20,470 | -636 |
| 1967 | 636 | 308 | 19,498 | -339 |
| 1966 | 603 | -89 | 18,635 | -1,023 |
| 1965 | 566 | -22 | 17,902 | -1,327 |
| 1964 | 536 | 16 | 17,134 | -1,660 |
| 1963 | 509 | 42 | 16,430 | -2,016 |
| 1962 | 488 | 54 | 15,656 | -2,403 |
| 1961 | 469 | 56 | 14,936 | -2,807 |
| 1960 | 452 | 63 | 14,307 | -3,227 |
Data sources: World Bank | Health (1960–2025, retrieved 2026-07-08).
GeoRank.org/population/marshall-islands/namibia | CC BY
Over the last 10 years, 26.7% of the population change in the Marshall Islands is from natural causes (a gain of 7,120 people) and 73.3% is from migration (a loss of 19,541 people). In Namibia 75.4% is from natural causes (a gain of 542,690 people) and 24.6% is from migration (a gain of 176,914 people).
As of 2024, 3,309 residents or 8.8% of the population were not native-born in the Marshall Islands, compared to 116,035 people or 3.8% in Namibia.
Biggest cities by population
|
Marshall Islands
|
|
|---|---|
| City | Population |
| Majuro | 30K |
| Djarrit | 7.1K |
|
Namibia
|
|
|---|---|
| City | Population |
| Windhoek | 486K |
| Walvis Bay | 103K |
| Swakopmund | 75.9K |
| Otjiwarongo | 49K |
| Rehoboth | 40.8K |
| Tsumeb | 35K |
| Gobabis | 33.4K |
| Mariental | 18.5K |
| Omaruru | 10.8K |
Compare countries by 7 more topics
Population differences between the Marshall Islands and Namibia
|
Marshall Islands
|
Namibia
|
|
|---|---|---|
| Life expectancy | 67.3 years | 67.8 years |
| Average age | 27.8 years | 25.7 years |
| Median age | 21.8 years | 22.4 years |
| Male:Female ratio | 51.2:48.8 | 48.8:51.2 |
| Fertility rate | 2.86 births per woman | 3.21 births per woman |
| Population density | 504 ppl/mi² | 9.92 ppl/mi² |
Population map with other countries
Data sources: World Bank | Health (1960–2025, retrieved 2026-07-08); United Nations | World Population Prospects (1960–2026, retrieved 2026-07-08); U.S. Census Bureau (1960–2025, retrieved 2026-07-08); Central Intelligence Agency (CIA) (2000–2019, retrieved 2026-07-08).
GeoRank.org/population/marshall-islands/namibia | CC BY
Help us show the world through your eyes
Share a photo of your city and help others discover what it looks like to live there. Your contribution makes our data come alive.
Data sources:
- World Bank | Health (1960–2025, retrieved 2026-07-08)
- United Nations | World Population Prospects (1960–2100, retrieved 2026-07-08)
- U.S. Census Bureau (1960–2025, retrieved 2026-07-08)
- Central Intelligence Agency (CIA) (2000–2019, retrieved 2026-07-08)
- Wikidata (2026, retrieved 2026-07-08)
Creative Commons Attribution (CC BY) — you’re free to copy, share, remix, adapt, and use even commercially as long as you give appropriate credit and clearly indicate if you made changes. Other sources may be subject to different license terms.