The latest officially reported population of Jordan was 11,520,684 in 2025 vs 3,092,816 people in Namibia in 2025. In 2026, based on the adjusted UN estimation, the current Jordan's population is 11,538,682 people compared to 3,185,686 in Namibia.
Population statistics:
- Jordan's population is 3.62 times bigger than Namibia's.
- Jordan is ranked the 86th most populous country in the world, while Namibia is the 134th.
- The countries together account for 0.18% of the world: 0.14% for Jordan vs 0.04% for Namibia.
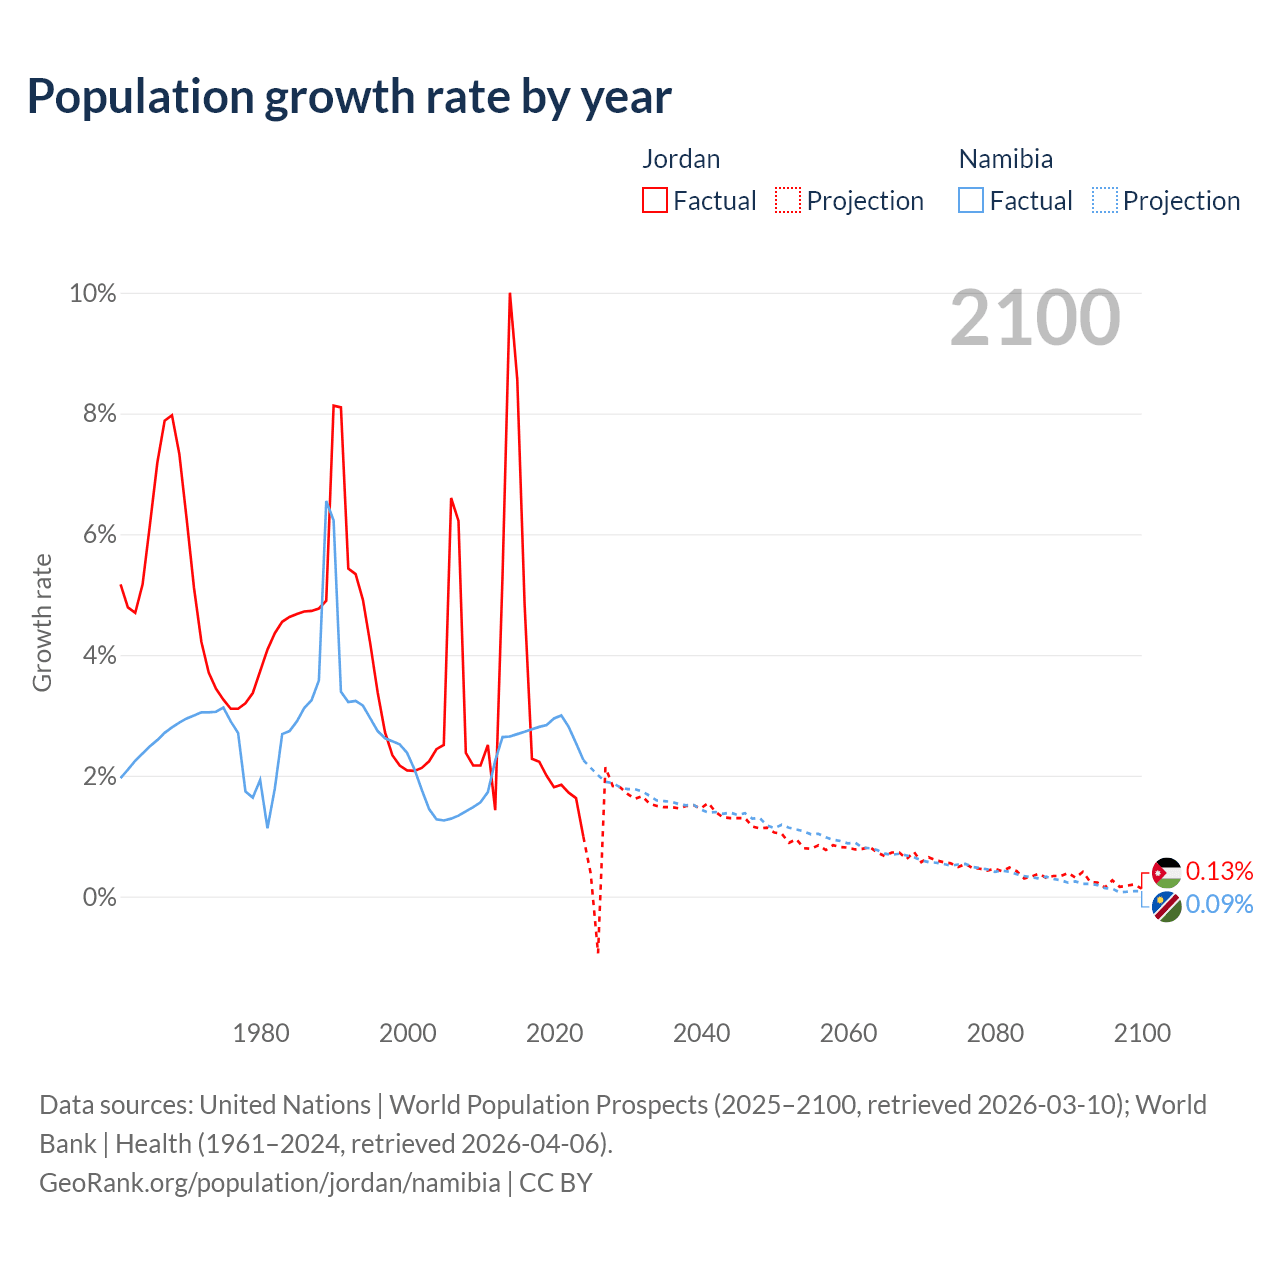
- For the last 10 years, Jordan has had an average growth rate of +2.51% per year vs +2.68% in Namibia.
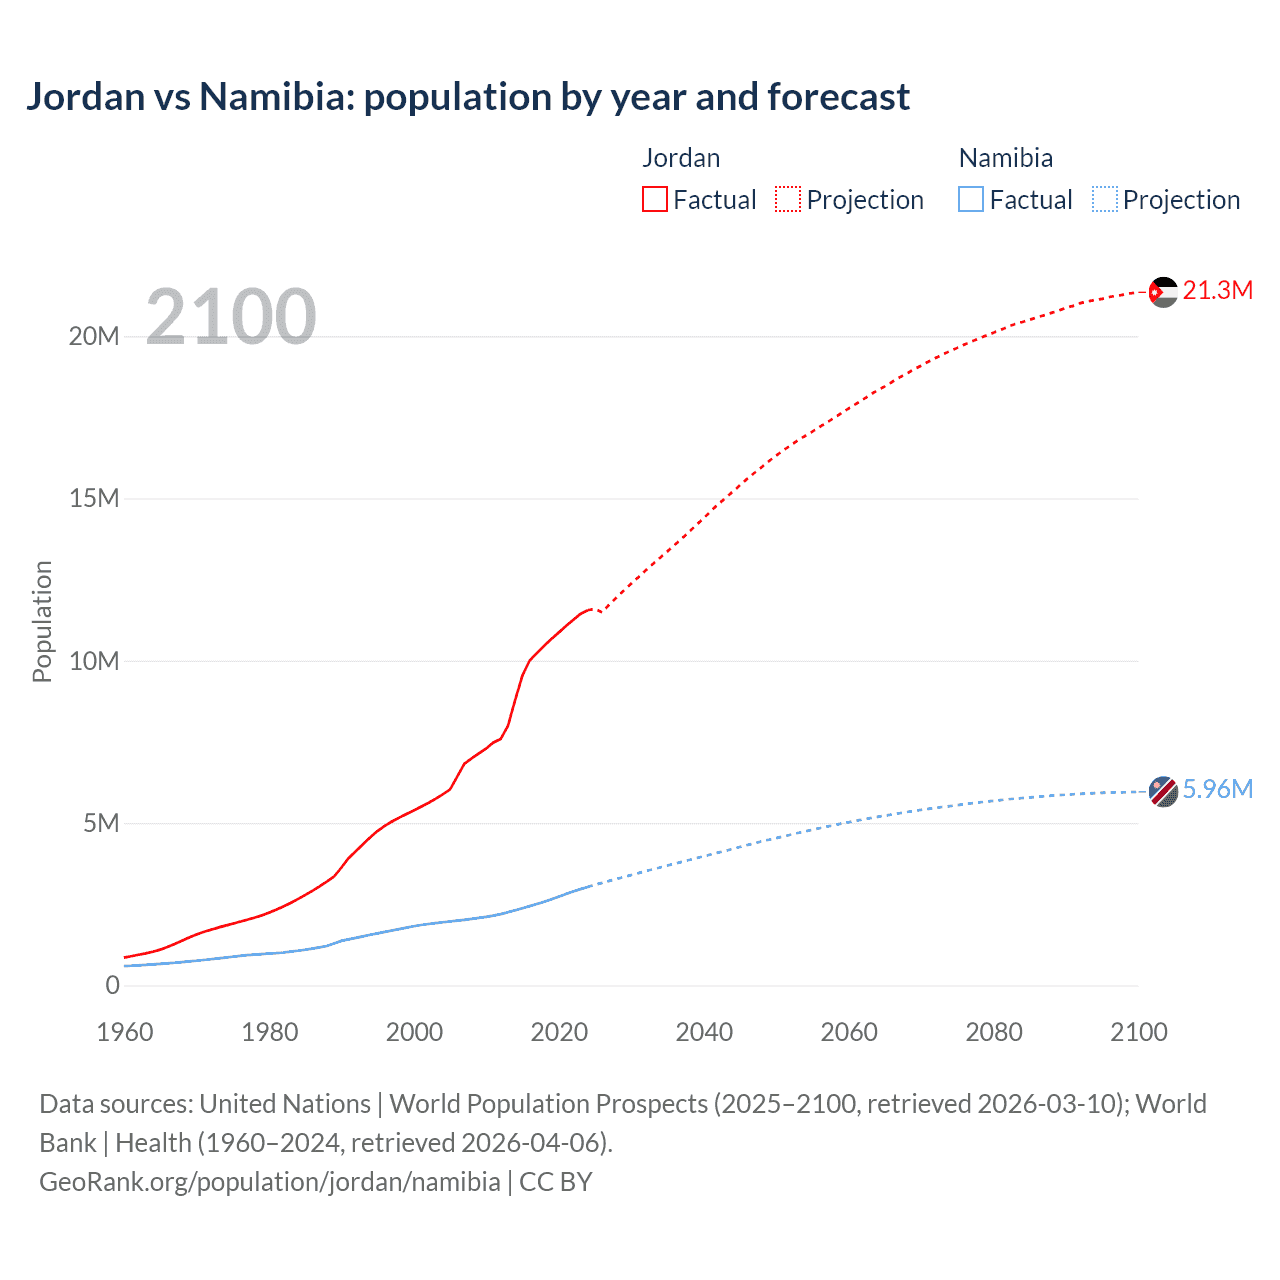
- Since 2006, the population of Jordan has increased from 6.43M people to 11.5M (79.5% growth), while Namibia has grown from 1.99M to 3.19M (59.9% growth).
Jordan vs Namibia: population by year and forecast
| Year | Population | |
|---|---|---|
 Jordan
|
 Namibia
|
|
| 2100 | 21,206,553 | 5,954,393 |
| 2099 | 21,178,430 | 5,948,866 |
| 2098 | 21,136,891 | 5,943,388 |
| 2097 | 21,098,437 | 5,938,535 |
| 2096 | 21,064,975 | 5,934,414 |
| 2095 | 21,007,321 | 5,926,652 |
| 2094 | 20,974,918 | 5,918,510 |
| 2093 | 20,926,611 | 5,907,504 |
| 2092 | 20,877,529 | 5,895,303 |
| 2091 | 20,792,840 | 5,882,775 |
| 2090 | 20,727,978 | 5,868,232 |
| 2089 | 20,647,108 | 5,854,537 |
| 2088 | 20,577,895 | 5,839,032 |
| 2087 | 20,508,170 | 5,822,179 |
| 2086 | 20,445,139 | 5,802,978 |
| 2085 | 20,367,437 | 5,785,593 |
| 2084 | 20,300,378 | 5,767,408 |
| 2083 | 20,240,284 | 5,747,980 |
| 2082 | 20,154,852 | 5,727,031 |
| 2081 | 20,058,508 | 5,703,874 |
| 2080 | 19,973,775 | 5,679,256 |
| 2079 | 19,882,784 | 5,656,126 |
| 2078 | 19,796,696 | 5,630,757 |
| 2077 | 19,705,632 | 5,604,556 |
| 2076 | 19,612,748 | 5,577,307 |
| 2075 | 19,506,799 | 5,547,604 |
| 2074 | 19,410,797 | 5,518,540 |
| 2073 | 19,304,910 | 5,490,713 |
| 2072 | 19,196,165 | 5,461,300 |
| 2071 | 19,081,623 | 5,431,031 |
| 2070 | 18,959,207 | 5,400,411 |
| 2069 | 18,852,491 | 5,368,127 |
| 2068 | 18,714,102 | 5,333,582 |
| 2067 | 18,598,580 | 5,297,361 |
| 2066 | 18,463,790 | 5,259,869 |
| 2065 | 18,329,203 | 5,224,047 |
| 2064 | 18,207,553 | 5,187,047 |
| 2063 | 18,075,660 | 5,147,329 |
| 2062 | 17,928,211 | 5,106,535 |
| 2061 | 17,787,680 | 5,065,279 |
| 2060 | 17,650,270 | 5,020,417 |
| 2059 | 17,507,871 | 4,976,448 |
| 2058 | 17,365,332 | 4,930,850 |
| 2057 | 17,219,182 | 4,884,900 |
| 2056 | 17,087,058 | 4,837,482 |
| 2055 | 16,943,513 | 4,787,824 |
| 2054 | 16,811,253 | 4,738,949 |
| 2053 | 16,678,042 | 4,688,219 |
| 2052 | 16,520,680 | 4,636,907 |
| 2051 | 16,375,107 | 4,584,458 |
| 2050 | 16,206,530 | 4,530,641 |
| 2049 | 16,037,046 | 4,479,821 |
| 2048 | 15,855,898 | 4,427,513 |
| 2047 | 15,679,222 | 4,370,836 |
| 2046 | 15,498,944 | 4,315,325 |
| 2045 | 15,300,324 | 4,256,478 |
| 2044 | 15,103,912 | 4,199,686 |
| 2043 | 14,910,676 | 4,142,276 |
| 2042 | 14,717,433 | 4,086,133 |
| 2041 | 14,514,257 | 4,029,802 |
| 2040 | 14,292,997 | 3,974,477 |
| 2039 | 14,087,063 | 3,918,246 |
| 2038 | 13,878,186 | 3,859,577 |
| 2037 | 13,672,864 | 3,802,081 |
| 2036 | 13,476,107 | 3,744,707 |
| 2035 | 13,279,859 | 3,686,835 |
| 2034 | 13,086,605 | 3,629,445 |
| 2033 | 12,892,780 | 3,572,743 |
| 2032 | 12,696,870 | 3,514,091 |
| 2031 | 12,489,908 | 3,454,083 |
| 2030 | 12,291,219 | 3,393,821 |
| 2029 | 12,085,718 | 3,334,592 |
| 2028 | 11,870,652 | 3,275,360 |
| 2027 | 11,657,736 | 3,214,886 |
| 2026 | 11,412,941 | 3,154,846 |
| 2025 | 11,520,684 | 3,092,816 |
| 2024 | 11,552,876 | 3,030,131 |
| 2023 | 11,439,213 | 2,963,095 |
| 2022 | 11,256,263 | 2,889,662 |
| 2021 | 11,066,356 | 2,810,548 |
| 2020 | 10,865,228 | 2,728,762 |
| 2019 | 10,671,891 | 2,650,494 |
| 2018 | 10,462,306 | 2,577,327 |
| 2017 | 10,234,226 | 2,506,853 |
| 2016 | 10,006,367 | 2,439,213 |
| 2015 | 9,544,729 | 2,374,300 |
| 2014 | 8,791,710 | 2,312,139 |
| 2013 | 7,991,809 | 2,252,508 |
| 2012 | 7,587,127 | 2,194,654 |
| 2011 | 7,480,424 | 2,146,325 |
| 2010 | 7,297,043 | 2,109,811 |
| 2009 | 7,141,753 | 2,077,394 |
| 2008 | 6,989,866 | 2,047,056 |
| 2007 | 6,827,227 | 2,018,600 |
| 2006 | 6,427,371 | 1,991,888 |
| 2005 | 6,029,587 | 1,966,582 |
| 2004 | 5,882,061 | 1,942,082 |
| 2003 | 5,741,828 | 1,917,464 |
| 2002 | 5,616,066 | 1,889,970 |
| 2001 | 5,498,894 | 1,857,048 |
| 2000 | 5,386,945 | 1,818,647 |
| 1999 | 5,276,444 | 1,776,368 |
| 1998 | 5,164,284 | 1,732,745 |
| 1997 | 5,046,285 | 1,689,264 |
| 1996 | 4,912,516 | 1,646,103 |
| 1995 | 4,752,096 | 1,602,170 |
| 1994 | 4,561,406 | 1,556,304 |
| 1993 | 4,348,020 | 1,508,697 |
| 1992 | 4,127,693 | 1,461,322 |
| 1991 | 3,915,149 | 1,415,684 |
| 1990 | 3,621,908 | 1,369,303 |
| 1989 | 3,349,627 | 1,288,947 |
| 1988 | 3,193,039 | 1,209,696 |
| 1987 | 3,047,634 | 1,167,889 |
| 1986 | 2,909,887 | 1,131,081 |
| 1985 | 2,778,810 | 1,096,890 |
| 1984 | 2,654,688 | 1,065,989 |
| 1983 | 2,537,307 | 1,037,511 |
| 1982 | 2,426,927 | 1,010,308 |
| 1981 | 2,325,517 | 992,500 |
| 1980 | 2,234,186 | 981,434 |
| 1979 | 2,153,882 | 962,825 |
| 1978 | 2,083,595 | 947,269 |
| 1977 | 2,019,002 | 931,104 |
| 1976 | 1,958,177 | 906,566 |
| 1975 | 1,899,055 | 881,032 |
| 1974 | 1,839,182 | 854,320 |
| 1973 | 1,778,094 | 828,928 |
| 1972 | 1,714,555 | 804,399 |
| 1971 | 1,645,145 | 780,584 |
| 1970 | 1,565,163 | 757,868 |
| 1969 | 1,473,100 | 736,120 |
| 1968 | 1,372,460 | 715,542 |
| 1967 | 1,271,183 | 696,045 |
| 1966 | 1,178,360 | 677,655 |
| 1965 | 1,099,440 | 660,558 |
| 1964 | 1,035,640 | 644,530 |
| 1963 | 984,714 | 629,589 |
| 1962 | 940,554 | 615,759 |
| 1961 | 897,591 | 603,067 |
| 1960 | 853,471 | 591,465 |
Data sources: United Nations | World Population Prospects (2026–2100, retrieved 2026-07-08); World Bank | Health (1960–2025, retrieved 2026-07-08).
GeoRank.org/population/jordan/namibia | CC BY 
From 2006 to 2016, the population of Jordan increased by 3,578,996 people (a 55.7% growth), while Namibia gained 447,325 people (a 22.5% growth).
For the next 10 years, from 2016 to 2026, Jordan gained 1,532,315 people (a 15.3% growth), while Namibia's population increased by 746,473 people (a 30.6% growth).
Jordan was ranked 101st most populous country in 2006 and is 86th in 2026. Namibia was ranked 143rd in 2006 and ranked 134th now.
The UN's World Population Prospects forecasts that in 24 years (in 2050) Jordan's population will grow by 40.5% to 16,206,530 people with a rank change from 86th to 79th. The population of Namibia will increase by 42.2% to 4,530,641 people and rank change from 134th to 131st.
Jordan is projected to reach its peak in 2100 at 21.2M people compared to the peak of 5.95M people in 2100 for Namibia.
Population growth rate by year
| Year | Growth rate | |
|---|---|---|
|
Jordan
|
Namibia
|
|
| 2100 | 0.13% | 0.09% |
| 2099 | 0.2% | 0.09% |
| 2098 | 0.18% | 0.08% |
| 2097 | 0.16% | 0.07% |
| 2096 | 0.27% | 0.13% |
| 2095 | 0.15% | 0.14% |
| 2094 | 0.23% | 0.19% |
| 2093 | 0.24% | 0.21% |
| 2092 | 0.41% | 0.21% |
| 2091 | 0.31% | 0.25% |
| 2090 | 0.39% | 0.23% |
| 2089 | 0.34% | 0.27% |
| 2088 | 0.34% | 0.29% |
| 2087 | 0.31% | 0.33% |
| 2086 | 0.38% | 0.3% |
| 2085 | 0.33% | 0.32% |
| 2084 | 0.3% | 0.34% |
| 2083 | 0.42% | 0.37% |
| 2082 | 0.48% | 0.41% |
| 2081 | 0.42% | 0.43% |
| 2080 | 0.46% | 0.41% |
| 2079 | 0.43% | 0.45% |
| 2078 | 0.46% | 0.47% |
| 2077 | 0.47% | 0.49% |
| 2076 | 0.54% | 0.54% |
| 2075 | 0.49% | 0.53% |
| 2074 | 0.55% | 0.51% |
| 2073 | 0.57% | 0.54% |
| 2072 | 0.6% | 0.56% |
| 2071 | 0.65% | 0.57% |
| 2070 | 0.57% | 0.6% |
| 2069 | 0.74% | 0.65% |
| 2068 | 0.62% | 0.68% |
| 2067 | 0.73% | 0.71% |
| 2066 | 0.73% | 0.69% |
| 2065 | 0.67% | 0.71% |
| 2064 | 0.73% | 0.77% |
| 2063 | 0.82% | 0.8% |
| 2062 | 0.79% | 0.81% |
| 2061 | 0.78% | 0.89% |
| 2060 | 0.81% | 0.88% |
| 2059 | 0.82% | 0.92% |
| 2058 | 0.85% | 0.94% |
| 2057 | 0.77% | 0.98% |
| 2056 | 0.85% | 1.04% |
| 2055 | 0.79% | 1.03% |
| 2054 | 0.8% | 1.08% |
| 2053 | 0.95% | 1.11% |
| 2052 | 0.89% | 1.14% |
| 2051 | 1.04% | 1.19% |
| 2050 | 1.06% | 1.13% |
| 2049 | 1.14% | 1.18% |
| 2048 | 1.13% | 1.3% |
| 2047 | 1.16% | 1.29% |
| 2046 | 1.3% | 1.38% |
| 2045 | 1.3% | 1.35% |
| 2044 | 1.3% | 1.39% |
| 2043 | 1.31% | 1.37% |
| 2042 | 1.4% | 1.4% |
| 2041 | 1.55% | 1.39% |
| 2040 | 1.46% | 1.44% |
| 2039 | 1.51% | 1.52% |
| 2038 | 1.5% | 1.51% |
| 2037 | 1.46% | 1.53% |
| 2036 | 1.48% | 1.57% |
| 2035 | 1.48% | 1.58% |
| 2034 | 1.5% | 1.59% |
| 2033 | 1.54% | 1.67% |
| 2032 | 1.66% | 1.74% |
| 2031 | 1.62% | 1.78% |
| 2030 | 1.7% | 1.78% |
| 2029 | 1.81% | 1.81% |
| 2028 | 1.83% | 1.88% |
| 2027 | 2.14% | 1.9% |
| 2026 | -0.94% | 2.01% |
| 2025 | -0.28% | 2.07% |
| 2024 | 0.99% | 2.26% |
| 2023 | 1.63% | 2.54% |
| 2022 | 1.72% | 2.81% |
| 2021 | 1.85% | 3% |
| 2020 | 1.81% | 2.95% |
| 2019 | 2% | 2.84% |
| 2018 | 2.23% | 2.81% |
| 2017 | 2.28% | 2.77% |
| 2016 | 4.84% | 2.73% |
| 2015 | 8.57% | 2.69% |
| 2014 | 10% | 2.65% |
| 2013 | 5.33% | 2.64% |
| 2012 | 1.43% | 2.25% |
| 2011 | 2.51% | 1.73% |
| 2010 | 2.17% | 1.56% |
| 2009 | 2.17% | 1.48% |
| 2008 | 2.38% | 1.41% |
| 2007 | 6.22% | 1.34% |
| 2006 | 6.6% | 1.29% |
| 2005 | 2.51% | 1.26% |
| 2004 | 2.44% | 1.28% |
| 2003 | 2.24% | 1.45% |
| 2002 | 2.13% | 1.77% |
| 2001 | 2.08% | 2.11% |
| 2000 | 2.09% | 2.38% |
| 1999 | 2.17% | 2.52% |
| 1998 | 2.34% | 2.57% |
| 1997 | 2.72% | 2.62% |
| 1996 | 3.38% | 2.74% |
| 1995 | 4.18% | 2.95% |
| 1994 | 4.91% | 3.16% |
| 1993 | 5.34% | 3.24% |
| 1992 | 5.43% | 3.22% |
| 1991 | 8.1% | 3.39% |
| 1990 | 8.13% | 6.23% |
| 1989 | 4.9% | 6.55% |
| 1988 | 4.77% | 3.58% |
| 1987 | 4.73% | 3.25% |
| 1986 | 4.72% | 3.12% |
| 1985 | 4.68% | 2.9% |
| 1984 | 4.63% | 2.74% |
| 1983 | 4.55% | 2.69% |
| 1982 | 4.36% | 1.79% |
| 1981 | 4.09% | 1.13% |
| 1980 | 3.73% | 1.93% |
| 1979 | 3.37% | 1.64% |
| 1978 | 3.2% | 1.74% |
| 1977 | 3.11% | 2.71% |
| 1976 | 3.11% | 2.9% |
| 1975 | 3.26% | 3.13% |
| 1974 | 3.44% | 3.06% |
| 1973 | 3.71% | 3.05% |
| 1972 | 4.22% | 3.05% |
| 1971 | 5.11% | 3% |
| 1970 | 6.25% | 2.95% |
| 1969 | 7.33% | 2.88% |
| 1968 | 7.97% | 2.8% |
| 1967 | 7.88% | 2.71% |
| 1966 | 7.18% | 2.59% |
| 1965 | 6.16% | 2.49% |
| 1964 | 5.17% | 2.37% |
| 1963 | 4.7% | 2.25% |
| 1962 | 4.79% | 2.1% |
| 1961 | 5.17% | 1.96% |
Data sources: United Nations | World Population Prospects (2026–2100, retrieved 2026-07-08); World Bank | Health (1961–2025, retrieved 2026-07-08).
GeoRank.org/population/jordan/namibia | CC BY
In 2025, the population of Jordan declined by 0.28%, while Namibia's population grew by 2.07%.
Live population counters
|
Jordan
|
Namibia
|
|
|---|---|---|
| Current population |
11538682
|
3185686
|
| Population rank | 86/197 | 134/197 |
| Percent of world population | 0.14% | 0.04% |
| One net population change |
16.4 minutes
|
8.41 minutes
|
| One birth every |
2.22 minutes
|
6.7 minutes
|
| One death every |
14.6 minutes
|
28.1 minutes
|
| Daily growth/decline | -88 | +172 |
| Annual growth/decline | -32,192 | +62,685 |
| Annual growth/decline rate | -0.28% | +2.07% |
| Population growth rate rank | 177/197 | 46/197 |
| One migration net change every |
1.74 minutes
|
4.71 hours
|
| Annual migration change | -303,267 | +1,866 |
| Net migration rank | 190/196 | 57/196 |
| Foreign-born residents | 5,280,168 | 116,035 |
| Foreign-born residents rank | 13/195 | 127/195 |
| Foreign-born share of population | 45.7% | 3.8% |
| Foreign-born share rank | 10/195 | 108/195 |
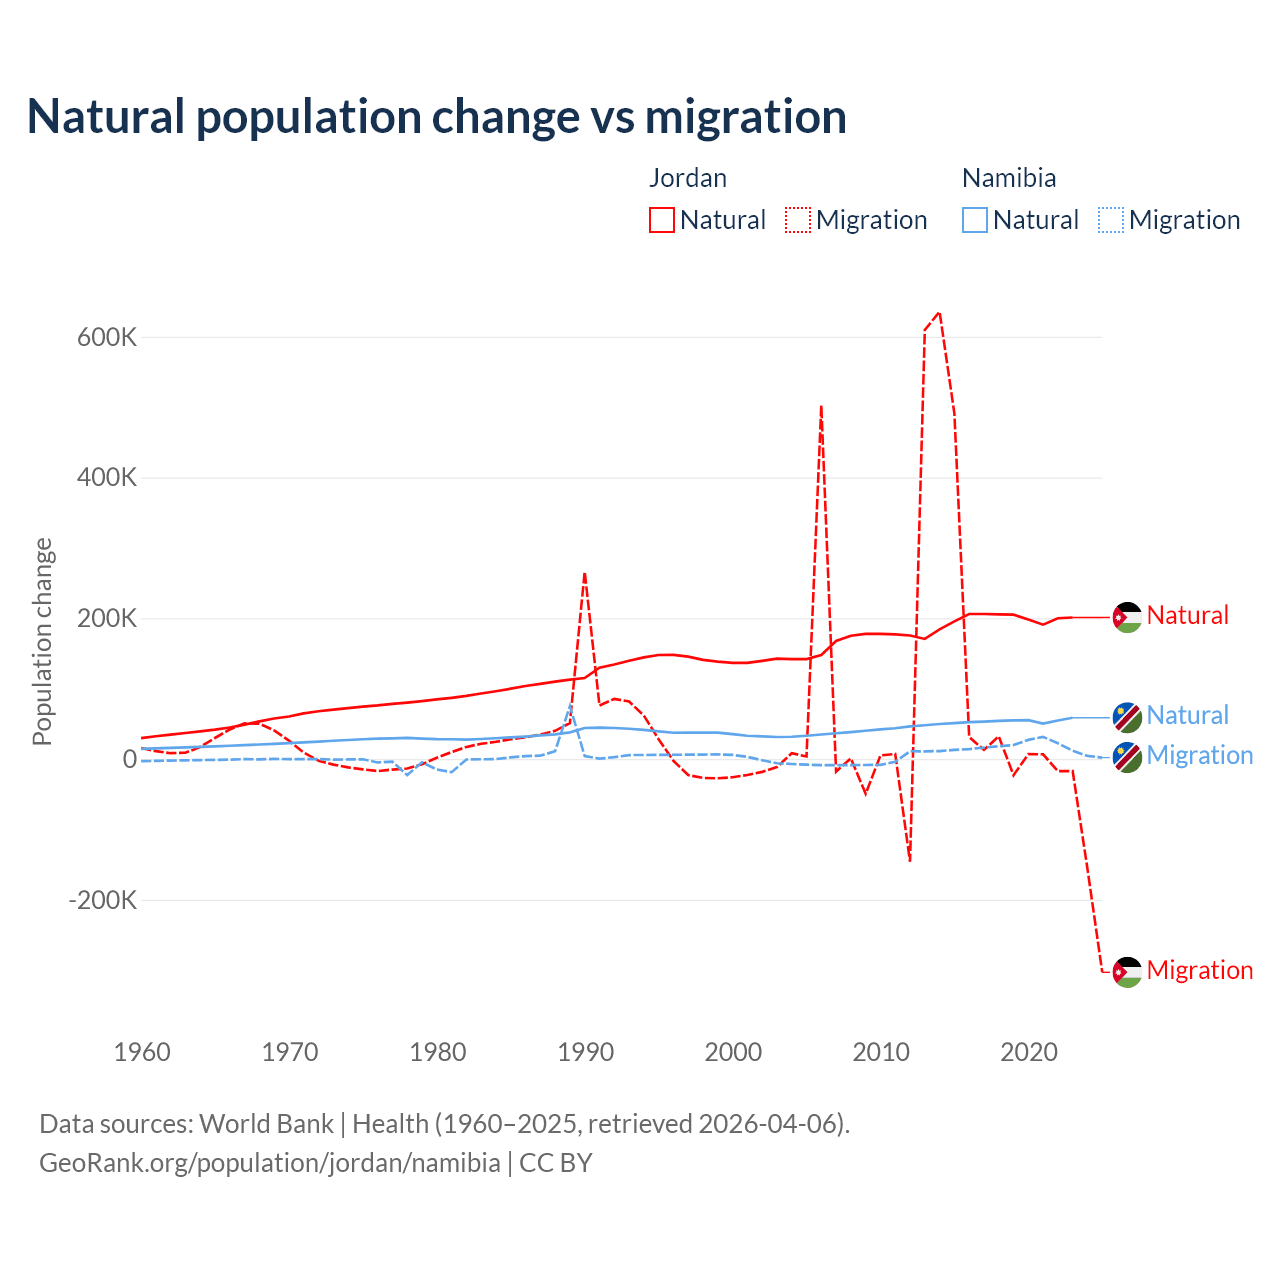
Natural population change vs migration
| Year | Population change | |||
|---|---|---|---|---|
|
Jordan
|
Namibia
|
|||
| Natural | Migration | Natural | Migration | |
| 2025 | - | -303,267 | - | 1,866 |
| 2024 | 200,223 | -156,369 | 59,739 | 4,211 |
| 2023 | 200,895 | -17,445 | 58,435 | 11,675 |
| 2022 | 199,900 | -17,445 | 54,534 | 22,212 |
| 2021 | 190,795 | 6,573 | 50,160 | 31,327 |
| 2020 | 198,138 | 6,745 | 55,034 | 27,056 |
| 2019 | 204,933 | -23,156 | 54,769 | 19,676 |
| 2018 | 205,333 | 32,062 | 53,970 | 17,920 |
| 2017 | 205,903 | 12,873 | 52,975 | 16,080 |
| 2016 | 205,891 | 31,046 | 52,228 | 14,002 |
| 2015 | 195,495 | 490,844 | 50,846 | 12,755 |
| 2014 | 184,169 | 635,528 | 49,581 | 11,134 |
| 2013 | 170,473 | 609,631 | 47,801 | 10,748 |
| 2012 | 175,437 | -146,181 | 46,204 | 10,957 |
| 2011 | 177,076 | 7,057 | 43,557 | -4,067 |
| 2010 | 177,748 | 4,872 | 42,046 | -8,518 |
| 2009 | 177,651 | -49,687 | 39,942 | -8,626 |
| 2008 | 175,048 | 767 | 38,147 | -8,775 |
| 2007 | 167,574 | -18,108 | 36,430 | -8,905 |
| 2006 | 147,643 | 502,609 | 34,690 | -8,792 |
| 2005 | 141,816 | 3,500 | 32,909 | -8,195 |
| 2004 | 141,752 | 7,979 | 31,478 | -7,192 |
| 2003 | 142,443 | -11,699 | 31,115 | -6,153 |
| 2002 | 139,250 | -18,463 | 31,947 | -1,913 |
| 2001 | 136,450 | -22,896 | 32,942 | 2,869 |
| 2000 | 136,414 | -26,077 | 35,280 | 5,709 |
| 1999 | 138,201 | -27,530 | 37,233 | 6,333 |
| 1998 | 140,696 | -27,036 | 37,500 | 6,180 |
| 1997 | 145,358 | -23,021 | 37,256 | 6,023 |
| 1996 | 147,852 | -2,655 | 37,177 | 5,866 |
| 1995 | 147,652 | 27,991 | 39,119 | 5,712 |
| 1994 | 144,199 | 61,533 | 41,316 | 5,578 |
| 1993 | 139,467 | 81,576 | 42,861 | 5,464 |
| 1992 | 134,241 | 85,376 | 43,945 | 2,487 |
| 1991 | 129,642 | 75,824 | 44,523 | 309 |
| 1990 | 114,912 | 266,100 | 43,956 | 3,969 |
| 1989 | 112,608 | 50,941 | 37,715 | 75,072 |
| 1988 | 109,754 | 39,873 | 34,798 | 10,916 |
| 1987 | 106,536 | 34,646 | 33,340 | 4,559 |
| 1986 | 103,551 | 30,763 | 31,764 | 3,953 |
| 1985 | 99,801 | 28,040 | 30,575 | 2,090 |
| 1984 | 96,092 | 24,316 | 29,395 | -267 |
| 1983 | 92,863 | 21,487 | 28,307 | -481 |
| 1982 | 89,473 | 16,944 | 27,474 | -889 |
| 1981 | 86,751 | 9,659 | 27,938 | -18,901 |
| 1980 | 84,508 | 1,735 | 28,142 | -15,041 |
| 1979 | 82,076 | -7,706 | 28,930 | -4,818 |
| 1978 | 79,908 | -13,701 | 29,821 | -22,827 |
| 1977 | 78,101 | -15,132 | 29,241 | -3,907 |
| 1976 | 75,981 | -17,309 | 28,785 | -5,048 |
| 1975 | 74,392 | -14,822 | 27,882 | -553 |
| 1974 | 72,212 | -12,024 | 26,844 | -744 |
| 1973 | 70,058 | -8,072 | 25,754 | -1,066 |
| 1972 | 67,707 | -2,622 | 24,606 | -236 |
| 1971 | 64,763 | 8,976 | 23,467 | -208 |
| 1970 | 60,321 | 25,894 | 22,414 | -244 |
| 1969 | 57,431 | 40,481 | 21,387 | -57 |
| 1968 | 53,336 | 50,036 | 20,470 | -636 |
| 1967 | 48,791 | 50,397 | 19,498 | -339 |
| 1966 | 44,580 | 41,882 | 18,635 | -1,023 |
| 1965 | 41,635 | 29,737 | 17,902 | -1,327 |
| 1964 | 39,205 | 17,018 | 17,134 | -1,660 |
| 1963 | 36,858 | 8,763 | 16,430 | -2,016 |
| 1962 | 34,598 | 8,098 | 15,656 | -2,403 |
| 1961 | 32,143 | 11,097 | 14,936 | -2,807 |
| 1960 | 29,491 | 15,509 | 14,307 | -3,227 |
Data sources: World Bank | Health (1960–2025, retrieved 2026-07-08).
GeoRank.org/population/jordan/namibia | CC BY
Over the last 10 years, 84.6% of the population change in Jordan is from natural causes (a gain of 2,007,506 people) and 15.4% is from migration (a gain of 365,728 people). In Namibia 75.4% is from natural causes (a gain of 542,690 people) and 24.6% is from migration (a gain of 176,914 people).
As of 2024, 5,280,168 residents or 45.7% of the population were not native-born in Jordan, compared to 116,035 people or 3.8% in Namibia.
Biggest cities by population
Compare countries by 7 more topics
Population differences between Jordan and Namibia
|
Jordan
|
Namibia
|
|
|---|---|---|
| Life expectancy | 78.3 years | 67.8 years |
| Average age | 28.7 years | 25.7 years |
| Median age | 25.7 years | 22.4 years |
| Male:Female ratio | 51.5:48.5 | 48.8:51.2 |
| Fertility rate | 2.6 births per woman | 3.21 births per woman |
| Population density | 333 ppl/mi² | 9.92 ppl/mi² |
Population map with other countries
Data sources: World Bank | Health (1960–2025, retrieved 2026-07-08); United Nations | World Population Prospects (1960–2026, retrieved 2026-07-08); U.S. Census Bureau (1960–2025, retrieved 2026-07-08); Central Intelligence Agency (CIA) (2000–2019, retrieved 2026-07-08).
GeoRank.org/population/jordan/namibia | CC BY
Help us show the world through your eyes
Share a photo of your city and help others discover what it looks like to live there. Your contribution makes our data come alive.
Data sources:
- World Bank | Health (1960–2025, retrieved 2026-07-08)
- United Nations | World Population Prospects (1960–2100, retrieved 2026-07-08)
- U.S. Census Bureau (1960–2025, retrieved 2026-07-08)
- Central Intelligence Agency (CIA) (2000–2019, retrieved 2026-07-08)
- Wikidata (2026, retrieved 2026-07-08)
Creative Commons Attribution (CC BY) — you’re free to copy, share, remix, adapt, and use even commercially as long as you give appropriate credit and clearly indicate if you made changes. Other sources may be subject to different license terms.