The latest officially reported population of Algeria was 47,435,312 in 2025 vs 3,140,095 people in Bosnia and Herzegovina in 2025. In 2026, based on the adjusted UN estimation, the current Algeria's population is 48,345,858 people compared to 3,114,736 in Bosnia and Herzegovina.
Population statistics:
- Algeria's population is 15.5 times bigger than Bosnia and Herzegovina's.
- Algeria is ranked the 34th most populous country in the world, while Bosnia and Herzegovina is the 135th.
- The countries together account for 0.62% of the world: 0.58% for Algeria vs 0.04% for Bosnia and Herzegovina.
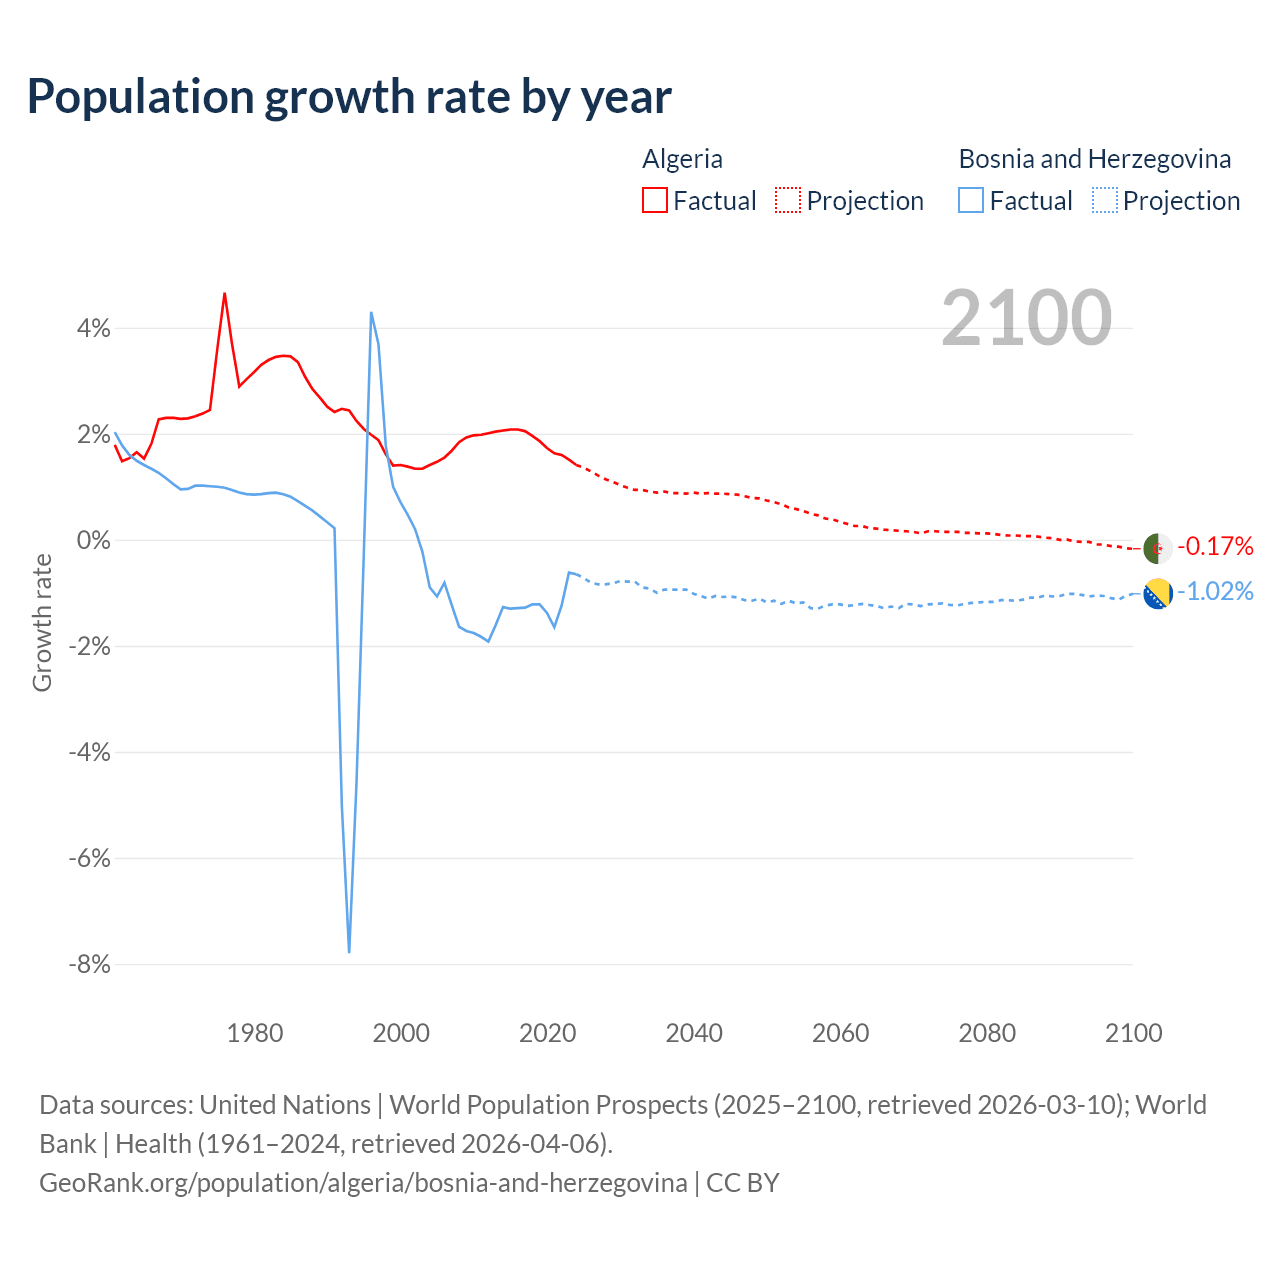
- For the last 10 years, Algeria has had an average growth rate of +1.75% per year vs -1.15% in Bosnia and Herzegovina.
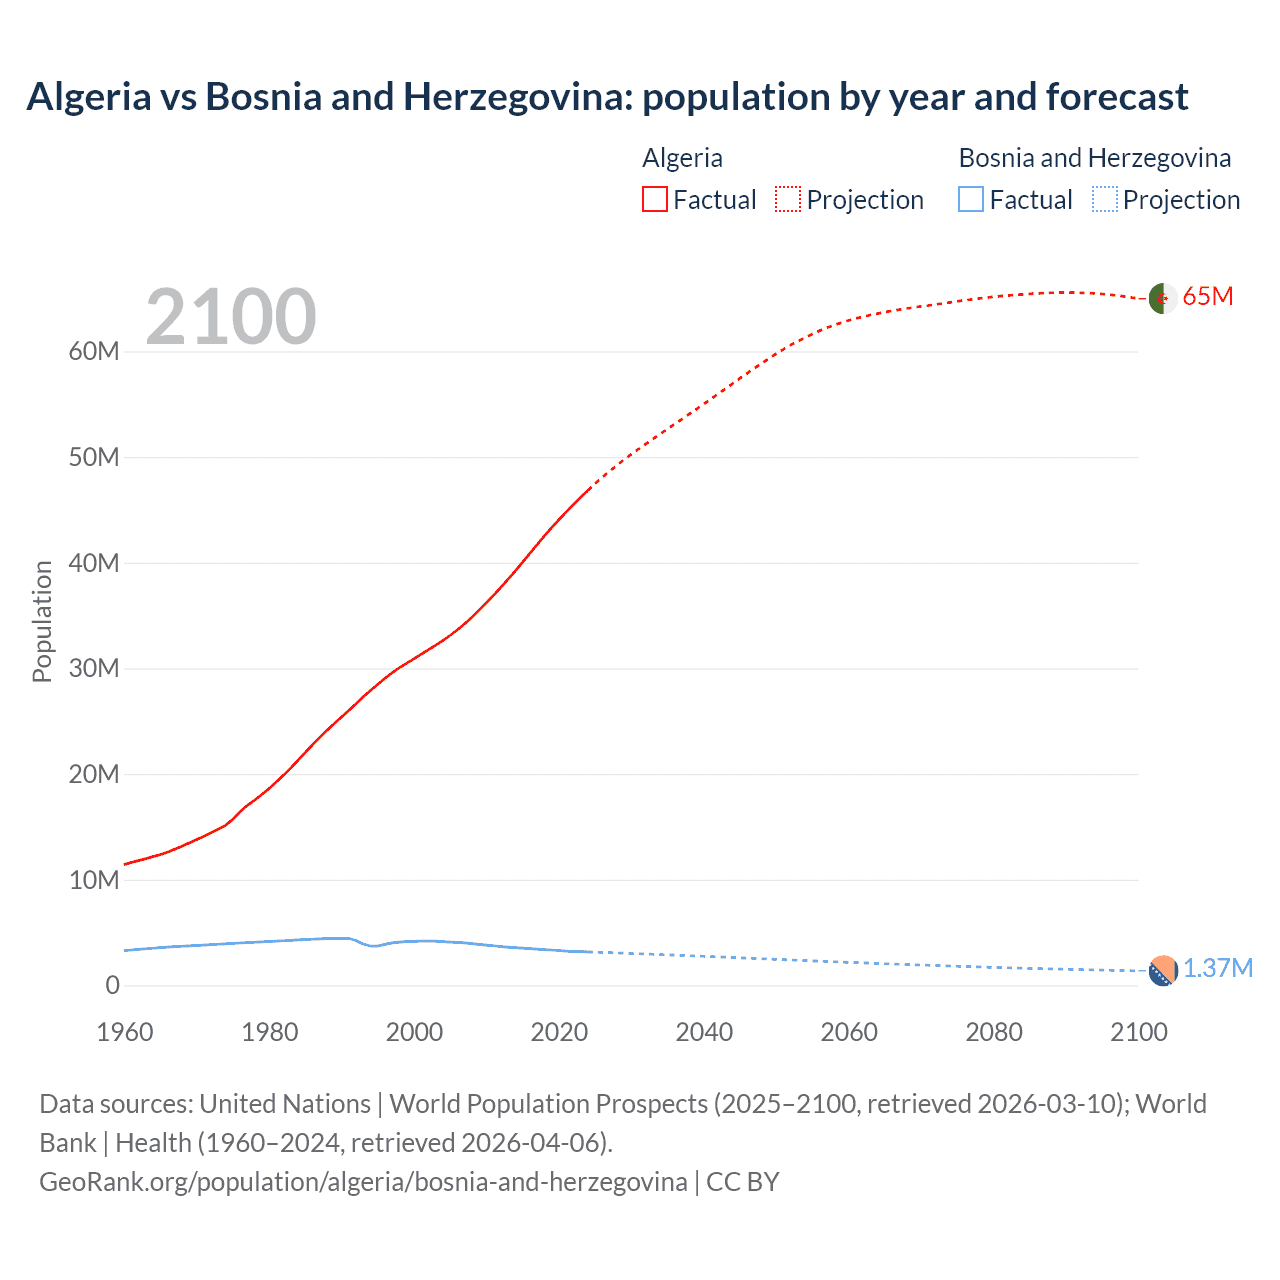
- Since 2006, the population of Algeria has increased from 33.6M people to 48.3M (43.8% growth), while Bosnia and Herzegovina has declined from 4.06M to 3.11M (23.3% decline).
Algeria vs Bosnia and Herzegovina: population by year and forecast
| Year | Population | |
|---|---|---|
 Algeria
|
 Bosnia
|
|
| 2100 | 64,963,450 | 1,368,062 |
| 2099 | 65,075,244 | 1,382,211 |
| 2098 | 65,177,248 | 1,396,949 |
| 2097 | 65,262,264 | 1,412,908 |
| 2096 | 65,339,404 | 1,428,574 |
| 2095 | 65,400,924 | 1,443,843 |
| 2094 | 65,457,659 | 1,459,099 |
| 2093 | 65,486,594 | 1,474,841 |
| 2092 | 65,514,575 | 1,490,288 |
| 2091 | 65,536,206 | 1,505,574 |
| 2090 | 65,534,162 | 1,521,165 |
| 2089 | 65,536,151 | 1,537,449 |
| 2088 | 65,519,144 | 1,554,002 |
| 2087 | 65,494,168 | 1,570,515 |
| 2086 | 65,455,745 | 1,587,803 |
| 2085 | 65,411,808 | 1,605,248 |
| 2084 | 65,365,401 | 1,623,603 |
| 2083 | 65,315,151 | 1,642,536 |
| 2082 | 65,262,527 | 1,661,441 |
| 2081 | 65,204,172 | 1,680,572 |
| 2080 | 65,131,995 | 1,700,417 |
| 2079 | 65,053,592 | 1,720,559 |
| 2078 | 64,973,632 | 1,741,147 |
| 2077 | 64,887,885 | 1,762,029 |
| 2076 | 64,805,016 | 1,783,547 |
| 2075 | 64,708,752 | 1,805,988 |
| 2074 | 64,611,374 | 1,828,419 |
| 2073 | 64,515,111 | 1,850,549 |
| 2072 | 64,413,784 | 1,873,199 |
| 2071 | 64,310,442 | 1,896,330 |
| 2070 | 64,230,683 | 1,920,335 |
| 2069 | 64,132,724 | 1,943,983 |
| 2068 | 64,030,989 | 1,967,713 |
| 2067 | 63,923,427 | 1,993,328 |
| 2066 | 63,810,251 | 2,018,796 |
| 2065 | 63,687,208 | 2,045,094 |
| 2064 | 63,550,779 | 2,071,026 |
| 2063 | 63,412,160 | 2,096,801 |
| 2062 | 63,250,420 | 2,122,454 |
| 2061 | 63,086,423 | 2,148,932 |
| 2060 | 62,900,355 | 2,176,154 |
| 2059 | 62,689,379 | 2,203,131 |
| 2058 | 62,454,967 | 2,230,453 |
| 2057 | 62,203,082 | 2,258,553 |
| 2056 | 61,916,006 | 2,288,270 |
| 2055 | 61,612,550 | 2,318,066 |
| 2054 | 61,282,973 | 2,345,650 |
| 2053 | 60,929,515 | 2,374,091 |
| 2052 | 60,562,817 | 2,401,804 |
| 2051 | 60,161,555 | 2,431,166 |
| 2050 | 59,737,427 | 2,459,340 |
| 2049 | 59,297,226 | 2,488,686 |
| 2048 | 58,841,142 | 2,516,605 |
| 2047 | 58,377,907 | 2,545,909 |
| 2046 | 57,902,123 | 2,575,176 |
| 2045 | 57,416,731 | 2,603,679 |
| 2044 | 56,927,927 | 2,631,917 |
| 2043 | 56,437,286 | 2,660,625 |
| 2042 | 55,951,600 | 2,689,157 |
| 2041 | 55,465,931 | 2,719,360 |
| 2040 | 54,988,407 | 2,748,491 |
| 2039 | 54,505,331 | 2,776,696 |
| 2038 | 54,033,480 | 2,803,054 |
| 2037 | 53,561,143 | 2,829,544 |
| 2036 | 53,094,449 | 2,856,285 |
| 2035 | 52,616,136 | 2,883,527 |
| 2034 | 52,150,833 | 2,912,522 |
| 2033 | 51,682,632 | 2,939,434 |
| 2032 | 51,203,273 | 2,966,176 |
| 2031 | 50,724,222 | 2,989,887 |
| 2030 | 50,230,658 | 3,013,719 |
| 2029 | 49,720,218 | 3,037,488 |
| 2028 | 49,184,244 | 3,062,650 |
| 2027 | 48,629,000 | 3,088,595 |
| 2026 | 48,046,811 | 3,114,736 |
| 2025 | 47,435,312 | 3,140,095 |
| 2024 | 46,814,308 | 3,164,253 |
| 2023 | 46,164,219 | 3,185,073 |
| 2022 | 45,477,389 | 3,204,802 |
| 2021 | 44,761,099 | 3,244,907 |
| 2020 | 44,042,091 | 3,299,349 |
| 2019 | 43,294,546 | 3,345,533 |
| 2018 | 42,505,035 | 3,387,000 |
| 2017 | 41,689,299 | 3,428,682 |
| 2016 | 40,850,721 | 3,473,003 |
| 2015 | 40,019,529 | 3,518,541 |
| 2014 | 39,205,031 | 3,564,829 |
| 2013 | 38,414,171 | 3,610,859 |
| 2012 | 37,646,166 | 3,670,113 |
| 2011 | 36,903,376 | 3,741,798 |
| 2010 | 36,188,236 | 3,811,472 |
| 2009 | 35,490,445 | 3,879,794 |
| 2008 | 34,816,961 | 3,947,544 |
| 2007 | 34,189,416 | 4,013,424 |
| 2006 | 33,623,506 | 4,063,272 |
| 2005 | 33,109,249 | 4,096,493 |
| 2004 | 32,628,286 | 4,140,987 |
| 2003 | 32,175,818 | 4,178,523 |
| 2002 | 31,750,835 | 4,188,002 |
| 2001 | 31,331,221 | 4,179,438 |
| 2000 | 30,903,893 | 4,159,771 |
| 1999 | 30,474,354 | 4,130,305 |
| 1998 | 30,054,133 | 4,089,356 |
| 1997 | 29,579,301 | 4,018,227 |
| 1996 | 29,033,044 | 3,875,246 |
| 1995 | 28,470,191 | 3,715,564 |
| 1994 | 27,887,279 | 3,725,412 |
| 1993 | 27,277,048 | 3,904,482 |
| 1992 | 26,628,568 | 4,234,616 |
| 1991 | 25,987,928 | 4,458,343 |
| 1990 | 25,375,810 | 4,448,652 |
| 1989 | 24,754,485 | 4,433,983 |
| 1988 | 24,109,536 | 4,414,404 |
| 1987 | 23,443,624 | 4,390,246 |
| 1986 | 22,745,499 | 4,362,115 |
| 1985 | 22,008,544 | 4,330,364 |
| 1984 | 21,271,969 | 4,295,536 |
| 1983 | 20,558,115 | 4,258,728 |
| 1982 | 19,872,348 | 4,221,100 |
| 1981 | 19,220,704 | 4,184,217 |
| 1980 | 18,607,174 | 4,148,426 |
| 1979 | 18,036,655 | 4,113,300 |
| 1978 | 17,506,974 | 4,078,240 |
| 1977 | 17,015,994 | 4,042,124 |
| 1976 | 16,409,170 | 4,004,552 |
| 1975 | 15,678,596 | 3,965,743 |
| 1974 | 15,133,502 | 3,926,472 |
| 1973 | 14,771,147 | 3,887,376 |
| 1972 | 14,427,072 | 3,848,271 |
| 1971 | 14,098,936 | 3,809,376 |
| 1970 | 13,783,719 | 3,773,247 |
| 1969 | 13,475,960 | 3,737,765 |
| 1968 | 13,172,614 | 3,698,794 |
| 1967 | 12,876,118 | 3,656,223 |
| 1966 | 12,590,069 | 3,610,562 |
| 1965 | 12,365,976 | 3,562,834 |
| 1964 | 12,179,813 | 3,513,441 |
| 1963 | 11,982,118 | 3,461,942 |
| 1962 | 11,800,771 | 3,407,532 |
| 1961 | 11,628,883 | 3,348,035 |
| 1960 | 11,424,922 | 3,281,381 |
Data sources: United Nations | World Population Prospects (2026–2100, retrieved 2026-07-08); World Bank | Health (1960–2025, retrieved 2026-07-08).
GeoRank.org/population/algeria/bosnia-and-herzegovina | CC BY 
From 2006 to 2016, the population of Algeria increased by 7,227,215 people (a 21.5% growth), while Bosnia and Herzegovina lost 590,269 people (a 14.5% decline).
For the next 10 years, from 2016 to 2026, Algeria gained 7,495,137 people (a 18.3% growth), while Bosnia and Herzegovina's population decreased by 358,267 people (a 10.3% decline).
Algeria was ranked 34th most populous country in 2006 and is still 34th in 2026. Bosnia and Herzegovina was ranked 123rd in 2006 and ranked 135th now.
The UN's World Population Prospects forecasts that in 24 years (in 2050) Algeria's population will grow by 23.6% to 59,737,427 people with a rank change from 34th to 33rd. The population of Bosnia and Herzegovina will decrease by 21% to 2,459,340 people and rank change from 135th to 144th.
Algeria is projected to reach its peak in 2091 at 65.5M people, while Bosnia and Herzegovina's population already peaked in 1991 at 4.46M people and is projected to decrease to 1.37M people by 2100.
Population growth rate by year
| Year | Growth rate | |
|---|---|---|
|
Algeria
|
Bosnia
|
|
| 2100 | -0.17% | -1.02% |
| 2099 | -0.16% | -1.06% |
| 2098 | -0.13% | -1.13% |
| 2097 | -0.12% | -1.1% |
| 2096 | -0.09% | -1.06% |
| 2095 | -0.09% | -1.05% |
| 2094 | -0.04% | -1.07% |
| 2093 | -0.04% | -1.04% |
| 2092 | -0.03% | -1.02% |
| 2091 | 0.003% | -1.02% |
| 2090 | -0.003% | -1.06% |
| 2089 | 0.03% | -1.07% |
| 2088 | 0.04% | -1.05% |
| 2087 | 0.06% | -1.09% |
| 2086 | 0.07% | -1.09% |
| 2085 | 0.07% | -1.13% |
| 2084 | 0.08% | -1.15% |
| 2083 | 0.08% | -1.14% |
| 2082 | 0.09% | -1.14% |
| 2081 | 0.11% | -1.17% |
| 2080 | 0.12% | -1.17% |
| 2079 | 0.12% | -1.18% |
| 2078 | 0.13% | -1.19% |
| 2077 | 0.13% | -1.21% |
| 2076 | 0.15% | -1.24% |
| 2075 | 0.15% | -1.23% |
| 2074 | 0.15% | -1.2% |
| 2073 | 0.16% | -1.21% |
| 2072 | 0.16% | -1.22% |
| 2071 | 0.12% | -1.25% |
| 2070 | 0.15% | -1.22% |
| 2069 | 0.16% | -1.21% |
| 2068 | 0.17% | -1.29% |
| 2067 | 0.18% | -1.26% |
| 2066 | 0.19% | -1.29% |
| 2065 | 0.21% | -1.25% |
| 2064 | 0.22% | -1.23% |
| 2063 | 0.26% | -1.21% |
| 2062 | 0.26% | -1.23% |
| 2061 | 0.3% | -1.25% |
| 2060 | 0.34% | -1.22% |
| 2059 | 0.38% | -1.22% |
| 2058 | 0.4% | -1.24% |
| 2057 | 0.46% | -1.3% |
| 2056 | 0.49% | -1.29% |
| 2055 | 0.54% | -1.18% |
| 2054 | 0.58% | -1.2% |
| 2053 | 0.61% | -1.15% |
| 2052 | 0.67% | -1.21% |
| 2051 | 0.71% | -1.15% |
| 2050 | 0.74% | -1.18% |
| 2049 | 0.78% | -1.11% |
| 2048 | 0.79% | -1.15% |
| 2047 | 0.82% | -1.14% |
| 2046 | 0.85% | -1.09% |
| 2045 | 0.86% | -1.07% |
| 2044 | 0.87% | -1.08% |
| 2043 | 0.87% | -1.06% |
| 2042 | 0.88% | -1.11% |
| 2041 | 0.87% | -1.06% |
| 2040 | 0.89% | -1.02% |
| 2039 | 0.87% | -0.94% |
| 2038 | 0.88% | -0.94% |
| 2037 | 0.88% | -0.94% |
| 2036 | 0.91% | -0.94% |
| 2035 | 0.89% | -1% |
| 2034 | 0.91% | -0.92% |
| 2033 | 0.94% | -0.9% |
| 2032 | 0.94% | -0.79% |
| 2031 | 0.98% | -0.79% |
| 2030 | 1.03% | -0.78% |
| 2029 | 1.09% | -0.82% |
| 2028 | 1.14% | -0.84% |
| 2027 | 1.21% | -0.84% |
| 2026 | 1.29% | -0.81% |
| 2025 | 1.33% | -0.76% |
| 2024 | 1.41% | -0.65% |
| 2023 | 1.51% | -0.62% |
| 2022 | 1.6% | -1.24% |
| 2021 | 1.63% | -1.65% |
| 2020 | 1.73% | -1.38% |
| 2019 | 1.86% | -1.22% |
| 2018 | 1.96% | -1.22% |
| 2017 | 2.05% | -1.28% |
| 2016 | 2.08% | -1.29% |
| 2015 | 2.08% | -1.3% |
| 2014 | 2.06% | -1.27% |
| 2013 | 2.04% | -1.61% |
| 2012 | 2.01% | -1.92% |
| 2011 | 1.98% | -1.83% |
| 2010 | 1.97% | -1.76% |
| 2009 | 1.93% | -1.72% |
| 2008 | 1.84% | -1.64% |
| 2007 | 1.68% | -1.23% |
| 2006 | 1.55% | -0.81% |
| 2005 | 1.47% | -1.07% |
| 2004 | 1.41% | -0.9% |
| 2003 | 1.34% | -0.23% |
| 2002 | 1.34% | 0.2% |
| 2001 | 1.38% | 0.47% |
| 2000 | 1.41% | 0.71% |
| 1999 | 1.4% | 1% |
| 1998 | 1.61% | 1.77% |
| 1997 | 1.88% | 3.69% |
| 1996 | 1.98% | 4.3% |
| 1995 | 2.09% | -0.26% |
| 1994 | 2.24% | -4.59% |
| 1993 | 2.44% | -7.8% |
| 1992 | 2.47% | -5.02% |
| 1991 | 2.41% | 0.22% |
| 1990 | 2.51% | 0.33% |
| 1989 | 2.68% | 0.44% |
| 1988 | 2.84% | 0.55% |
| 1987 | 3.07% | 0.64% |
| 1986 | 3.35% | 0.73% |
| 1985 | 3.46% | 0.81% |
| 1984 | 3.47% | 0.86% |
| 1983 | 3.45% | 0.89% |
| 1982 | 3.39% | 0.88% |
| 1981 | 3.3% | 0.86% |
| 1980 | 3.16% | 0.85% |
| 1979 | 3.03% | 0.86% |
| 1978 | 2.89% | 0.89% |
| 1977 | 3.7% | 0.94% |
| 1976 | 4.66% | 0.98% |
| 1975 | 3.6% | 1% |
| 1974 | 2.45% | 1.01% |
| 1973 | 2.38% | 1.02% |
| 1972 | 2.33% | 1.02% |
| 1971 | 2.29% | 0.96% |
| 1970 | 2.28% | 0.95% |
| 1969 | 2.3% | 1.05% |
| 1968 | 2.3% | 1.16% |
| 1967 | 2.27% | 1.26% |
| 1966 | 1.81% | 1.34% |
| 1965 | 1.53% | 1.41% |
| 1964 | 1.65% | 1.49% |
| 1963 | 1.54% | 1.6% |
| 1962 | 1.48% | 1.78% |
| 1961 | 1.79% | 2.03% |
Data sources: United Nations | World Population Prospects (2026–2100, retrieved 2026-07-08); World Bank | Health (1961–2025, retrieved 2026-07-08).
GeoRank.org/population/algeria/bosnia-and-herzegovina | CC BY
In 2025, the population of Algeria grew by 1.33%, while Bosnia and Herzegovina's population declined by 0.76%.
Live population counters
|
Algeria
|
Bosnia
|
|
|---|---|---|
| Current population |
48345858
|
3114736
|
| Population rank | 34/197 | 135/197 |
| Percent of world population | 0.58% | 0.04% |
| One net population change |
50.9 seconds
|
21.8 minutes
|
| One birth every |
35.8 seconds
|
21.5 minutes
|
| One death every |
2.43 minutes
|
12.3 minutes
|
| Daily growth/decline | +1,701 | -66 |
| Annual growth/decline | +621,004 | -24,158 |
| Annual growth/decline rate | +1.33% | -0.76% |
| Population growth rate rank | 77/197 | 192/197 |
| One migration net change every |
19.1 minutes
|
1.26 hours
|
| Annual migration change | -27,531 | -6,994 |
| Net migration rank | 161/196 | 124/196 |
| Foreign-born residents | 259,458 | 34,120 |
| Foreign-born residents rank | 104/195 | 160/195 |
| Foreign-born share of population | 0.6% | 1.1% |
| Foreign-born share rank | 168/195 | 151/195 |
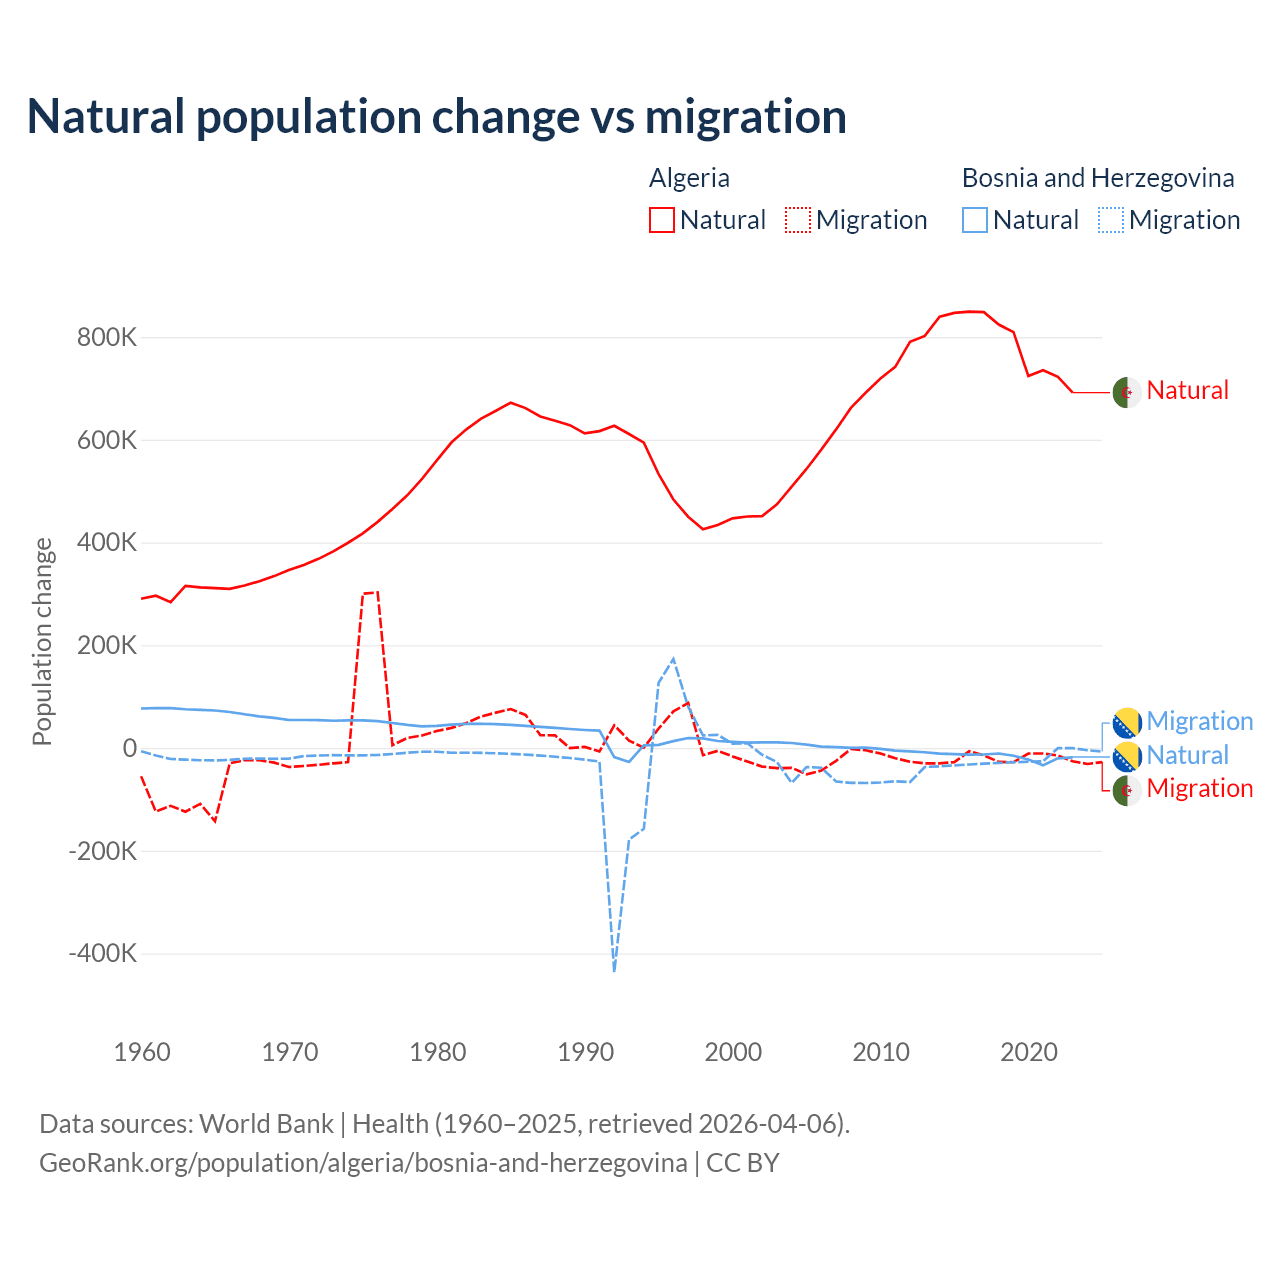
Natural population change vs migration
| Year | Population change | |||
|---|---|---|---|---|
|
Algeria
|
Bosnia
|
|||
| Natural | Migration | Natural | Migration | |
| 2025 | - | -27,531 | - | -6,994 |
| 2024 | 665,653 | -31,240 | -18,359 | -4,497 |
| 2023 | 691,724 | -25,963 | -18,292 | -485 |
| 2022 | 722,591 | -14,684 | -20,197 | -485 |
| 2021 | 735,514 | -10,803 | -33,670 | -25,865 |
| 2020 | 724,140 | -10,798 | -22,502 | -26,840 |
| 2019 | 809,522 | -27,786 | -15,192 | -27,841 |
| 2018 | 824,428 | -27,146 | -10,761 | -29,147 |
| 2017 | 848,585 | -14,403 | -12,810 | -30,650 |
| 2016 | 849,368 | -6,438 | -13,009 | -32,173 |
| 2015 | 847,054 | -27,638 | -11,942 | -33,948 |
| 2014 | 839,654 | -30,064 | -11,009 | -35,683 |
| 2013 | 802,203 | -30,052 | -8,367 | -37,002 |
| 2012 | 790,645 | -26,763 | -6,761 | -66,378 |
| 2011 | 741,832 | -20,108 | -5,354 | -64,875 |
| 2010 | 719,350 | -10,788 | -1,895 | -67,228 |
| 2009 | 691,496 | -4,458 | 652 | -68,182 |
| 2008 | 662,044 | -2,101 | 161 | -68,140 |
| 2007 | 620,196 | -25,046 | 1,557 | -65,335 |
| 2006 | 580,812 | -44,138 | 2,714 | -38,622 |
| 2005 | 543,158 | -51,345 | 6,546 | -37,086 |
| 2004 | 508,773 | -38,648 | 9,549 | -68,008 |
| 2003 | 474,272 | -39,421 | 10,781 | -27,396 |
| 2002 | 451,369 | -36,255 | 10,972 | -13,312 |
| 2001 | 450,637 | -26,539 | 10,424 | 9,055 |
| 2000 | 447,025 | -16,454 | 11,722 | 8,138 |
| 1999 | 434,198 | -5,657 | 13,568 | 25,495 |
| 1998 | 425,928 | -13,991 | 18,492 | 24,335 |
| 1997 | 450,138 | 87,582 | 19,311 | 80,133 |
| 1996 | 483,632 | 71,139 | 13,327 | 173,193 |
| 1995 | 533,104 | 37,817 | 5,926 | 126,914 |
| 1994 | 594,445 | 430 | 4,895 | -157,427 |
| 1993 | 611,306 | 14,289 | -27,199 | -178,416 |
| 1992 | 627,289 | 44,102 | -17,883 | -436,814 |
| 1991 | 616,850 | -6,945 | 33,692 | -26,483 |
| 1990 | 612,369 | 1,962 | 34,993 | -22,829 |
| 1989 | 628,542 | -234 | 36,802 | -19,634 |
| 1988 | 637,215 | 24,376 | 39,058 | -17,058 |
| 1987 | 645,309 | 24,933 | 41,172 | -14,853 |
| 1986 | 661,644 | 64,381 | 42,884 | -12,941 |
| 1985 | 672,185 | 75,729 | 44,983 | -11,429 |
| 1984 | 656,475 | 68,774 | 46,413 | -10,321 |
| 1983 | 641,167 | 61,292 | 47,135 | -9,599 |
| 1982 | 620,415 | 48,660 | 47,023 | -9,298 |
| 1981 | 595,150 | 39,043 | 45,423 | -9,384 |
| 1980 | 559,983 | 32,879 | 42,911 | -7,368 |
| 1979 | 523,875 | 24,311 | 42,157 | -7,454 |
| 1978 | 491,876 | 19,317 | 44,800 | -9,382 |
| 1977 | 465,405 | 5,360 | 48,643 | -11,834 |
| 1976 | 440,192 | 302,662 | 52,107 | -13,778 |
| 1975 | 417,803 | 300,482 | 53,629 | -14,348 |
| 1974 | 399,509 | -27,605 | 53,600 | -14,345 |
| 1973 | 382,736 | -29,938 | 52,989 | -14,043 |
| 1972 | 368,179 | -32,832 | 54,072 | -14,807 |
| 1971 | 356,069 | -35,141 | 54,352 | -15,829 |
| 1970 | 346,564 | -37,058 | 54,455 | -20,714 |
| 1969 | 334,541 | -28,535 | 58,454 | -21,229 |
| 1968 | 324,560 | -23,870 | 61,422 | -20,704 |
| 1967 | 316,289 | -23,983 | 65,618 | -21,195 |
| 1966 | 309,628 | -29,832 | 70,085 | -23,196 |
| 1965 | 311,190 | -142,810 | 72,896 | -24,330 |
| 1964 | 312,729 | -108,798 | 74,151 | -23,922 |
| 1963 | 315,645 | -124,175 | 75,380 | -22,611 |
| 1962 | 283,903 | -112,676 | 77,582 | -21,531 |
| 1961 | 296,467 | -123,928 | 77,601 | -14,655 |
| 1960 | 290,582 | -55,212 | 76,840 | -6,481 |
Data sources: World Bank | Health (1960–2025, retrieved 2026-07-08).
GeoRank.org/population/algeria/bosnia-and-herzegovina | CC BY
Over the last 10 years, 97.5% of the population change in Algeria is from natural causes (a gain of 7,718,579 people) and 2.49% is from migration (a loss of 196,899 people). In Bosnia and Herzegovina 45.5% is from natural causes (a loss of 176,734 people) and 54.5% is from migration (a loss of 211,931 people).
As of 2024, 259,458 residents or 0.6% of the population were not native-born in Algeria, compared to 34,120 people or 1.1% in Bosnia and Herzegovina.
Biggest cities by population
|
Algeria
|
|
|---|---|
| City | Population |
| Algiers | 2.36M |
| Oran | 803K |
| Constantine | 465K |
| Batna | 291K |
| Setif | 288K |
| Djelfa | 266K |
| Annaba | 257K |
| Sidi Bel Abbes | 213K |
| Biskra | 205K |
| Tebessa | 194K |
|
Bosnia
|
|
|---|---|
| City | Population |
| Sarajevo | 276K |
| Banja Luka | 185K |
| Tuzla | 111K |
| Zenica | 111K |
| Mostar | 105K |
| Prijedor | 89.4K |
| Doboj | 68.5K |
| Bihac | 56.3K |
| Bijeljina | 42.3K |
| Sanski Most | 16.9K |
Compare countries by 7 more topics
Population differences between Algeria and Bosnia and Herzegovina
|
Algeria
|
Bosnia
|
|
|---|---|---|
| Life expectancy | 76.9 years | 78.4 years |
| Average age | 31 years | 45 years |
| Median age | 29.6 years | 46.7 years |
| Male:Female ratio | 51:49 | 47.6:52.4 |
| Fertility rate | 2.72 births per woman | 1.49 births per woman |
| Population density | 52.2 ppl/mi² | 157.6 ppl/mi² |
Population map with other countries
Data sources: World Bank | Health (1960–2025, retrieved 2026-07-08); United Nations | World Population Prospects (1960–2026, retrieved 2026-07-08); U.S. Census Bureau (1960–2025, retrieved 2026-07-08); Central Intelligence Agency (CIA) (2000–2019, retrieved 2026-07-08).
GeoRank.org/population/algeria/bosnia-and-herzegovina | CC BY
Help us show the world through your eyes
Share a photo of your city and help others discover what it looks like to live there. Your contribution makes our data come alive.
Data sources:
- World Bank | Health (1960–2025, retrieved 2026-07-08)
- United Nations | World Population Prospects (1960–2100, retrieved 2026-07-08)
- U.S. Census Bureau (1960–2025, retrieved 2026-07-08)
- Wikidata (2026, retrieved 2026-07-08)
- Central Intelligence Agency (CIA) (2000–2019, retrieved 2026-07-08)
Creative Commons Attribution (CC BY) — you’re free to copy, share, remix, adapt, and use even commercially as long as you give appropriate credit and clearly indicate if you made changes. Other sources may be subject to different license terms.