The latest officially reported population of Pakistan was 255,219,554 in 2025 vs 639,850 people in Suriname in 2025. In 2026, based on the adjusted UN estimation, the current Pakistan's population is 261,421,997 people compared to 648,096 in Suriname.
Population statistics:
- Pakistan's population is 403 times bigger than Suriname's.
- Pakistan is ranked the 5th most populous country in the world, while Suriname is the 165th.
- The countries together account for 3.15% of the world: 3.15% for Pakistan vs 0.008% for Suriname.
- For the last 10 years, Pakistan has had an average growth rate of +1.6% per year vs +0.97% in Suriname.
- Since 2006, the population of Pakistan has increased from 180M people to 261M (45.5% growth), while Suriname has grown from 525K to 648K (23.4% growth).
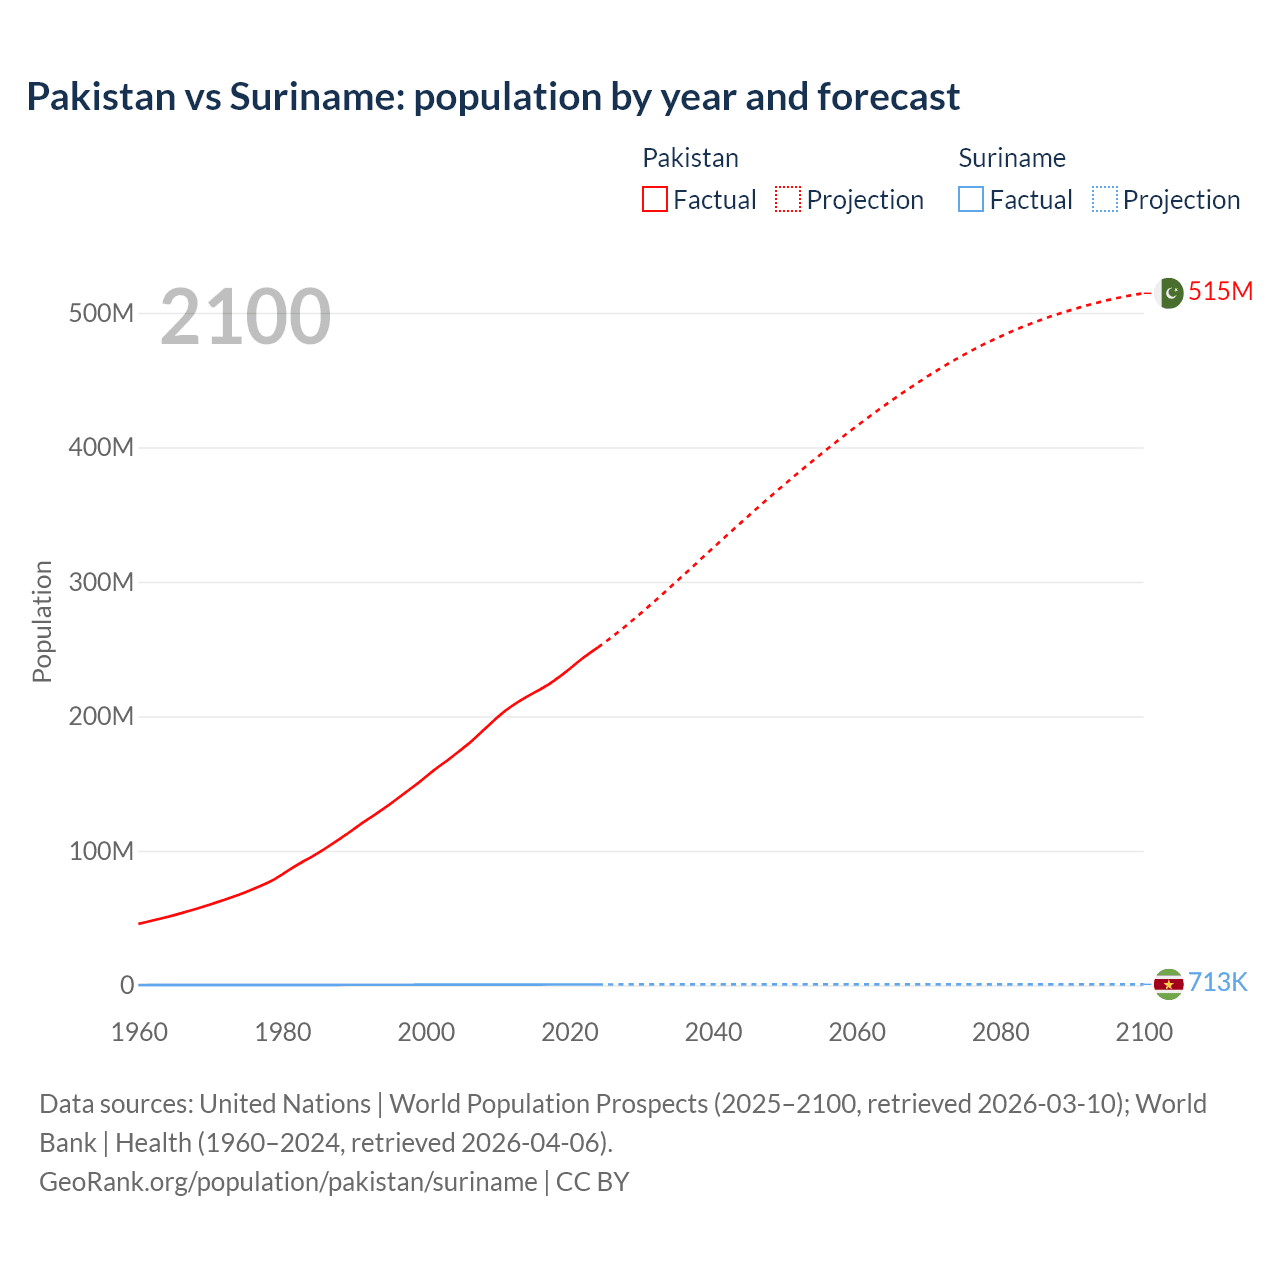
Pakistan vs Suriname: population by year and forecast
| Year | Population | |
|---|---|---|
 Pakistan
|
 Suriname
|
|
| 2100 | 514,639,086 | 713,301 |
| 2099 | 513,762,873 | 715,718 |
| 2098 | 512,834,641 | 718,073 |
| 2097 | 511,842,588 | 720,500 |
| 2096 | 510,743,323 | 722,800 |
| 2095 | 509,544,194 | 725,224 |
| 2094 | 508,236,117 | 727,514 |
| 2093 | 506,871,405 | 729,945 |
| 2092 | 505,433,117 | 732,310 |
| 2091 | 503,929,591 | 734,611 |
| 2090 | 502,369,089 | 736,676 |
| 2089 | 500,764,988 | 738,887 |
| 2088 | 499,040,109 | 741,028 |
| 2087 | 497,294,229 | 742,858 |
| 2086 | 495,416,407 | 744,619 |
| 2085 | 493,469,269 | 746,328 |
| 2084 | 491,457,322 | 747,772 |
| 2083 | 489,327,293 | 749,164 |
| 2082 | 487,086,584 | 750,355 |
| 2081 | 484,774,651 | 751,527 |
| 2080 | 482,358,125 | 752,571 |
| 2079 | 479,913,540 | 753,310 |
| 2078 | 477,377,443 | 753,974 |
| 2077 | 474,692,907 | 754,582 |
| 2076 | 471,877,807 | 755,015 |
| 2075 | 468,953,317 | 755,554 |
| 2074 | 465,972,364 | 755,740 |
| 2073 | 462,907,667 | 756,042 |
| 2072 | 459,752,452 | 756,125 |
| 2071 | 456,518,761 | 756,124 |
| 2070 | 453,190,545 | 755,985 |
| 2069 | 449,749,441 | 755,900 |
| 2068 | 446,219,879 | 755,625 |
| 2067 | 442,632,987 | 755,174 |
| 2066 | 438,970,919 | 754,830 |
| 2065 | 435,260,675 | 754,137 |
| 2064 | 431,484,424 | 753,311 |
| 2063 | 427,665,121 | 752,771 |
| 2062 | 423,724,764 | 751,992 |
| 2061 | 419,759,602 | 751,308 |
| 2060 | 415,724,868 | 750,325 |
| 2059 | 411,662,239 | 749,420 |
| 2058 | 407,514,159 | 748,612 |
| 2057 | 403,318,028 | 747,183 |
| 2056 | 399,031,614 | 745,967 |
| 2055 | 394,728,055 | 744,434 |
| 2054 | 390,385,410 | 742,836 |
| 2053 | 386,003,289 | 741,364 |
| 2052 | 381,568,312 | 739,688 |
| 2051 | 377,096,921 | 738,024 |
| 2050 | 372,554,619 | 736,078 |
| 2049 | 367,986,189 | 734,256 |
| 2048 | 363,386,382 | 732,085 |
| 2047 | 358,734,325 | 729,623 |
| 2046 | 354,003,639 | 727,242 |
| 2045 | 349,228,953 | 724,469 |
| 2044 | 344,443,561 | 721,556 |
| 2043 | 339,631,894 | 718,596 |
| 2042 | 334,801,403 | 715,335 |
| 2041 | 329,944,530 | 712,005 |
| 2040 | 325,107,264 | 708,379 |
| 2039 | 320,203,920 | 704,797 |
| 2038 | 315,273,196 | 701,029 |
| 2037 | 310,377,446 | 697,364 |
| 2036 | 305,472,156 | 693,268 |
| 2035 | 300,604,245 | 689,014 |
| 2034 | 295,748,602 | 684,675 |
| 2033 | 290,911,874 | 680,289 |
| 2032 | 286,130,352 | 675,648 |
| 2031 | 281,410,647 | 670,943 |
| 2030 | 276,766,735 | 666,067 |
| 2029 | 272,246,760 | 661,186 |
| 2028 | 267,784,548 | 656,001 |
| 2027 | 263,445,027 | 650,709 |
| 2026 | 259,285,315 | 645,337 |
| 2025 | 255,219,554 | 639,850 |
| 2024 | 251,269,164 | 634,431 |
| 2023 | 247,504,495 | 628,886 |
| 2022 | 243,700,667 | 623,164 |
| 2021 | 239,477,801 | 617,896 |
| 2020 | 235,001,746 | 612,317 |
| 2019 | 230,800,899 | 605,768 |
| 2018 | 226,928,892 | 599,513 |
| 2017 | 223,273,967 | 593,713 |
| 2016 | 220,138,869 | 587,757 |
| 2015 | 217,290,883 | 581,627 |
| 2014 | 214,264,647 | 575,373 |
| 2013 | 211,073,978 | 569,020 |
| 2012 | 207,667,125 | 562,633 |
| 2011 | 203,746,065 | 556,269 |
| 2010 | 199,239,047 | 549,923 |
| 2009 | 194,376,534 | 543,568 |
| 2008 | 189,499,113 | 537,245 |
| 2007 | 184,493,231 | 531,016 |
| 2006 | 179,682,690 | 524,997 |
| 2005 | 175,453,212 | 519,313 |
| 2004 | 171,286,000 | 513,923 |
| 2003 | 167,110,248 | 506,414 |
| 2002 | 163,222,549 | 496,551 |
| 2001 | 159,270,907 | 486,560 |
| 2000 | 154,879,127 | 476,643 |
| 1999 | 150,565,377 | 466,916 |
| 1998 | 146,522,356 | 457,406 |
| 1997 | 142,531,804 | 448,067 |
| 1996 | 138,557,092 | 438,830 |
| 1995 | 134,582,253 | 429,606 |
| 1994 | 130,748,083 | 422,375 |
| 1993 | 127,020,117 | 419,352 |
| 1992 | 123,546,848 | 417,589 |
| 1991 | 120,060,406 | 415,013 |
| 1990 | 116,155,576 | 412,493 |
| 1989 | 112,336,629 | 408,409 |
| 1988 | 108,724,739 | 402,227 |
| 1987 | 105,130,717 | 396,911 |
| 1986 | 101,606,764 | 392,330 |
| 1985 | 98,229,285 | 386,972 |
| 1984 | 95,164,936 | 382,193 |
| 1983 | 92,227,711 | 378,746 |
| 1982 | 89,089,246 | 376,555 |
| 1981 | 85,802,049 | 375,459 |
| 1980 | 82,291,010 | 375,377 |
| 1979 | 78,997,039 | 377,602 |
| 1978 | 76,307,379 | 381,502 |
| 1977 | 73,901,827 | 385,067 |
| 1976 | 71,620,254 | 388,289 |
| 1975 | 69,461,175 | 391,170 |
| 1974 | 67,415,487 | 393,676 |
| 1973 | 65,461,912 | 395,772 |
| 1972 | 63,583,194 | 397,413 |
| 1971 | 61,847,899 | 391,932 |
| 1970 | 60,166,719 | 379,442 |
| 1969 | 58,460,939 | 366,906 |
| 1968 | 56,810,507 | 354,616 |
| 1967 | 55,214,768 | 342,679 |
| 1966 | 53,678,667 | 331,135 |
| 1965 | 52,209,010 | 320,000 |
| 1964 | 50,799,999 | 309,041 |
| 1963 | 49,447,776 | 297,034 |
| 1962 | 48,156,128 | 283,912 |
| 1961 | 46,921,277 | 272,791 |
| 1960 | 45,709,310 | 263,918 |
Data sources: United Nations | World Population Prospects (2026–2100, retrieved 2026-07-08); World Bank | Health (1960–2025, retrieved 2026-07-08).
GeoRank.org/population/pakistan/suriname | CC BY 
From 2006 to 2016, the population of Pakistan increased by 40,456,179 people (a 22.5% growth), while Suriname gained 62,760 people (a 12% growth).
For the next 10 years, from 2016 to 2026, Pakistan gained 41,283,128 people (a 18.8% growth), while Suriname's population increased by 60,339 people (a 10.3% growth).
Pakistan was ranked 6th most populous country in 2006 and is 5th in 2026. Suriname was ranked 164th in 2006 and ranked 165th now.
The UN's World Population Prospects forecasts that in 24 years (in 2050) Pakistan's population will grow by 42.5% to 372,554,619 people with a rank change from 5th to 4th. The population of Suriname will increase by 13.6% to 736,078 people and will still be ranked 165th.
Pakistan is projected to reach its peak in 2100 at 515M people compared to the peak of 756K people in 2072 for Suriname.
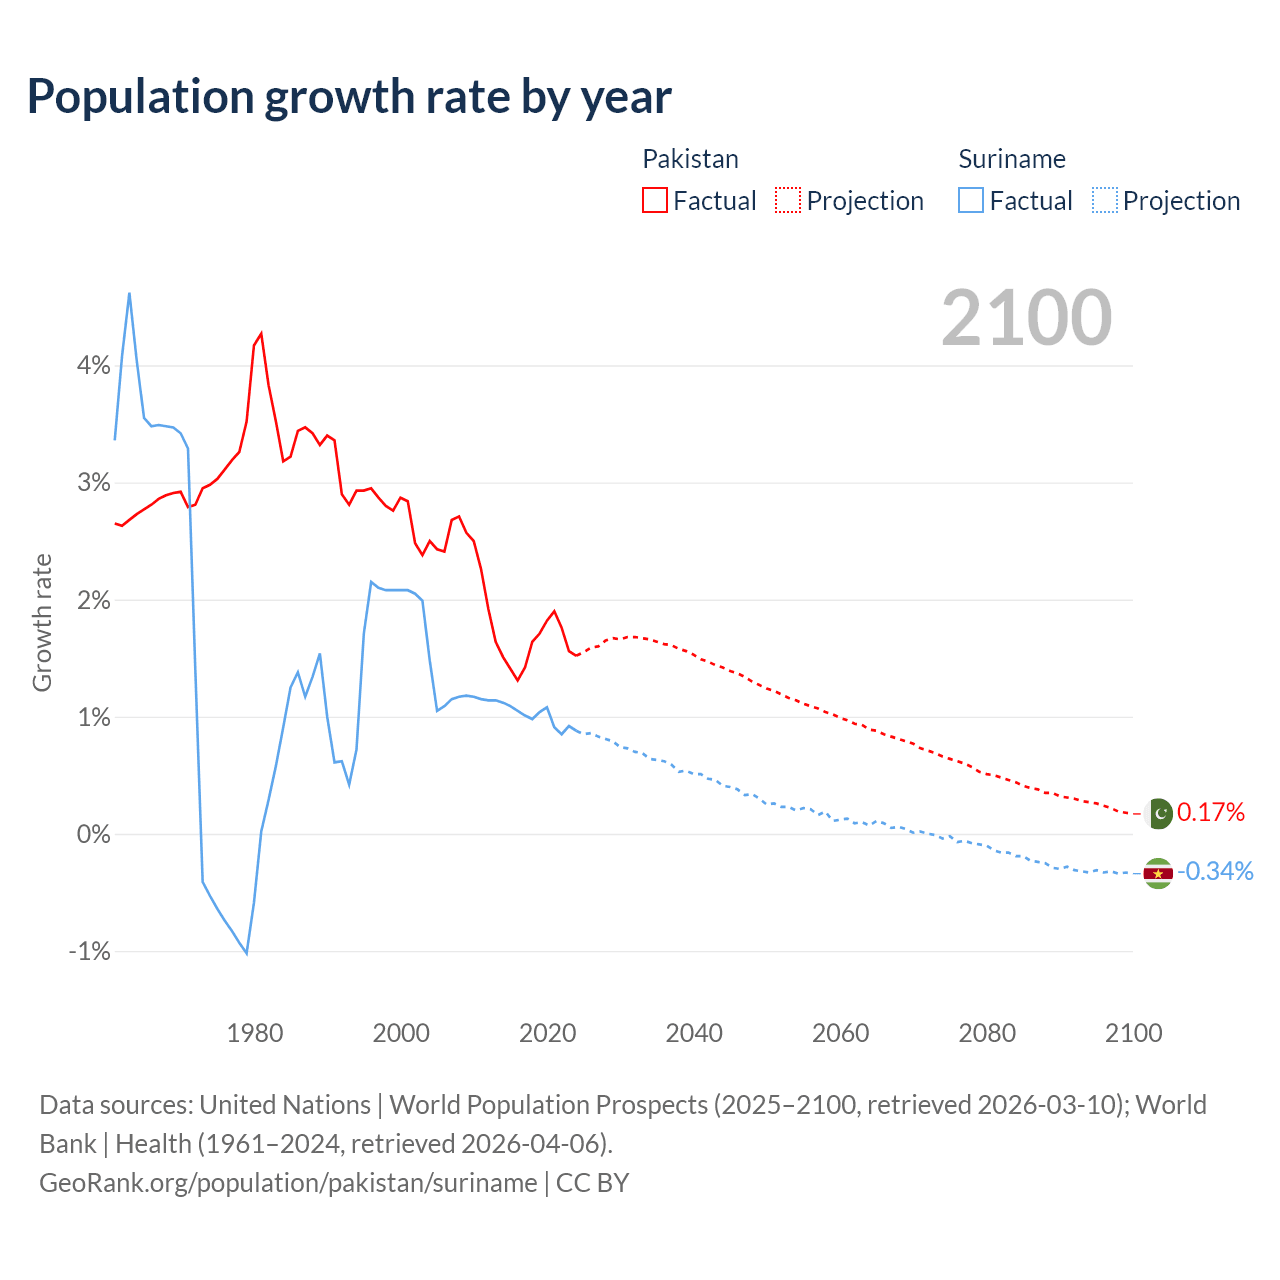
Population growth rate by year
| Year | Growth rate | |
|---|---|---|
|
Pakistan
|
Suriname
|
|
| 2100 | 0.17% | -0.34% |
| 2099 | 0.18% | -0.33% |
| 2098 | 0.19% | -0.34% |
| 2097 | 0.22% | -0.32% |
| 2096 | 0.24% | -0.33% |
| 2095 | 0.26% | -0.31% |
| 2094 | 0.27% | -0.33% |
| 2093 | 0.28% | -0.32% |
| 2092 | 0.3% | -0.31% |
| 2091 | 0.31% | -0.28% |
| 2090 | 0.32% | -0.3% |
| 2089 | 0.35% | -0.29% |
| 2088 | 0.35% | -0.25% |
| 2087 | 0.38% | -0.24% |
| 2086 | 0.39% | -0.23% |
| 2085 | 0.41% | -0.19% |
| 2084 | 0.44% | -0.19% |
| 2083 | 0.46% | -0.16% |
| 2082 | 0.48% | -0.16% |
| 2081 | 0.5% | -0.14% |
| 2080 | 0.51% | -0.1% |
| 2079 | 0.53% | -0.09% |
| 2078 | 0.57% | -0.08% |
| 2077 | 0.6% | -0.06% |
| 2076 | 0.62% | -0.07% |
| 2075 | 0.64% | -0.02% |
| 2074 | 0.66% | -0.04% |
| 2073 | 0.69% | -0.01% |
| 2072 | 0.71% | 0% |
| 2071 | 0.73% | 0.02% |
| 2070 | 0.77% | 0.01% |
| 2069 | 0.79% | 0.04% |
| 2068 | 0.81% | 0.06% |
| 2067 | 0.83% | 0.05% |
| 2066 | 0.85% | 0.09% |
| 2065 | 0.88% | 0.11% |
| 2064 | 0.89% | 0.07% |
| 2063 | 0.93% | 0.1% |
| 2062 | 0.94% | 0.09% |
| 2061 | 0.97% | 0.13% |
| 2060 | 0.99% | 0.12% |
| 2059 | 1.02% | 0.11% |
| 2058 | 1.04% | 0.19% |
| 2057 | 1.07% | 0.16% |
| 2056 | 1.09% | 0.21% |
| 2055 | 1.11% | 0.22% |
| 2054 | 1.14% | 0.2% |
| 2053 | 1.16% | 0.23% |
| 2052 | 1.19% | 0.23% |
| 2051 | 1.22% | 0.26% |
| 2050 | 1.24% | 0.25% |
| 2049 | 1.27% | 0.3% |
| 2048 | 1.3% | 0.34% |
| 2047 | 1.34% | 0.33% |
| 2046 | 1.37% | 0.38% |
| 2045 | 1.39% | 0.4% |
| 2044 | 1.42% | 0.41% |
| 2043 | 1.44% | 0.46% |
| 2042 | 1.47% | 0.47% |
| 2041 | 1.49% | 0.51% |
| 2040 | 1.53% | 0.51% |
| 2039 | 1.56% | 0.54% |
| 2038 | 1.58% | 0.53% |
| 2037 | 1.61% | 0.59% |
| 2036 | 1.62% | 0.62% |
| 2035 | 1.64% | 0.63% |
| 2034 | 1.66% | 0.64% |
| 2033 | 1.67% | 0.69% |
| 2032 | 1.68% | 0.7% |
| 2031 | 1.68% | 0.73% |
| 2030 | 1.66% | 0.74% |
| 2029 | 1.67% | 0.79% |
| 2028 | 1.65% | 0.81% |
| 2027 | 1.6% | 0.83% |
| 2026 | 1.59% | 0.86% |
| 2025 | 1.57% | 0.85% |
| 2024 | 1.52% | 0.88% |
| 2023 | 1.56% | 0.92% |
| 2022 | 1.76% | 0.85% |
| 2021 | 1.9% | 0.91% |
| 2020 | 1.82% | 1.08% |
| 2019 | 1.71% | 1.04% |
| 2018 | 1.64% | 0.98% |
| 2017 | 1.42% | 1.01% |
| 2016 | 1.31% | 1.05% |
| 2015 | 1.41% | 1.09% |
| 2014 | 1.51% | 1.12% |
| 2013 | 1.64% | 1.14% |
| 2012 | 1.92% | 1.14% |
| 2011 | 2.26% | 1.15% |
| 2010 | 2.5% | 1.17% |
| 2009 | 2.57% | 1.18% |
| 2008 | 2.71% | 1.17% |
| 2007 | 2.68% | 1.15% |
| 2006 | 2.41% | 1.09% |
| 2005 | 2.43% | 1.05% |
| 2004 | 2.5% | 1.48% |
| 2003 | 2.38% | 1.99% |
| 2002 | 2.48% | 2.05% |
| 2001 | 2.84% | 2.08% |
| 2000 | 2.87% | 2.08% |
| 1999 | 2.76% | 2.08% |
| 1998 | 2.8% | 2.08% |
| 1997 | 2.87% | 2.1% |
| 1996 | 2.95% | 2.15% |
| 1995 | 2.93% | 1.71% |
| 1994 | 2.93% | 0.72% |
| 1993 | 2.81% | 0.42% |
| 1992 | 2.9% | 0.62% |
| 1991 | 3.36% | 0.61% |
| 1990 | 3.4% | 1% |
| 1989 | 3.32% | 1.54% |
| 1988 | 3.42% | 1.34% |
| 1987 | 3.47% | 1.17% |
| 1986 | 3.44% | 1.38% |
| 1985 | 3.22% | 1.25% |
| 1984 | 3.18% | 0.91% |
| 1983 | 3.52% | 0.58% |
| 1982 | 3.83% | 0.29% |
| 1981 | 4.27% | 0.02% |
| 1980 | 4.17% | -0.59% |
| 1979 | 3.52% | -1.02% |
| 1978 | 3.26% | -0.93% |
| 1977 | 3.19% | -0.83% |
| 1976 | 3.11% | -0.74% |
| 1975 | 3.03% | -0.64% |
| 1974 | 2.98% | -0.53% |
| 1973 | 2.95% | -0.41% |
| 1972 | 2.81% | 1.4% |
| 1971 | 2.79% | 3.29% |
| 1970 | 2.92% | 3.42% |
| 1969 | 2.91% | 3.47% |
| 1968 | 2.89% | 3.48% |
| 1967 | 2.86% | 3.49% |
| 1966 | 2.81% | 3.48% |
| 1965 | 2.77% | 3.55% |
| 1964 | 2.73% | 4.04% |
| 1963 | 2.68% | 4.62% |
| 1962 | 2.63% | 4.08% |
| 1961 | 2.65% | 3.36% |
Data sources: United Nations | World Population Prospects (2026–2100, retrieved 2026-07-08); World Bank | Health (1961–2025, retrieved 2026-07-08).
GeoRank.org/population/pakistan/suriname | CC BY
In 2025, the population of Pakistan grew by 1.57%, while Suriname's population grew by 0.85%.
Live population counters
|
Pakistan
|
Suriname
|
|
|---|---|---|
| Current population |
261421997
|
648096
|
| Population rank | 5/197 | 165/197 |
| Percent of world population | 3.15% | 0.008% |
| One net population change |
8.01 seconds
|
1.62 hours
|
| One birth every |
4.58 seconds
|
48.3 minutes
|
| One death every |
19.5 seconds
|
2.02 hours
|
| Daily growth/decline | +10,823 | +15 |
| Annual growth/decline | +3,950,390 | +5,419 |
| Annual growth/decline rate | +1.57% | +0.85% |
| Population growth rate rank | 66/197 | 107/197 |
| One migration net change every |
25.6 seconds
|
9.08 hours
|
| Annual migration change | -1,235,336 | -967 |
| Net migration rank | 196/196 | 92/196 |
| Foreign-born residents | 4,175,958 | 51,902 |
| Foreign-born residents rank | 16/195 | 148/195 |
| Foreign-born share of population | 1.7% | 8.2% |
| Foreign-born share rank | 141/195 | 74/195 |
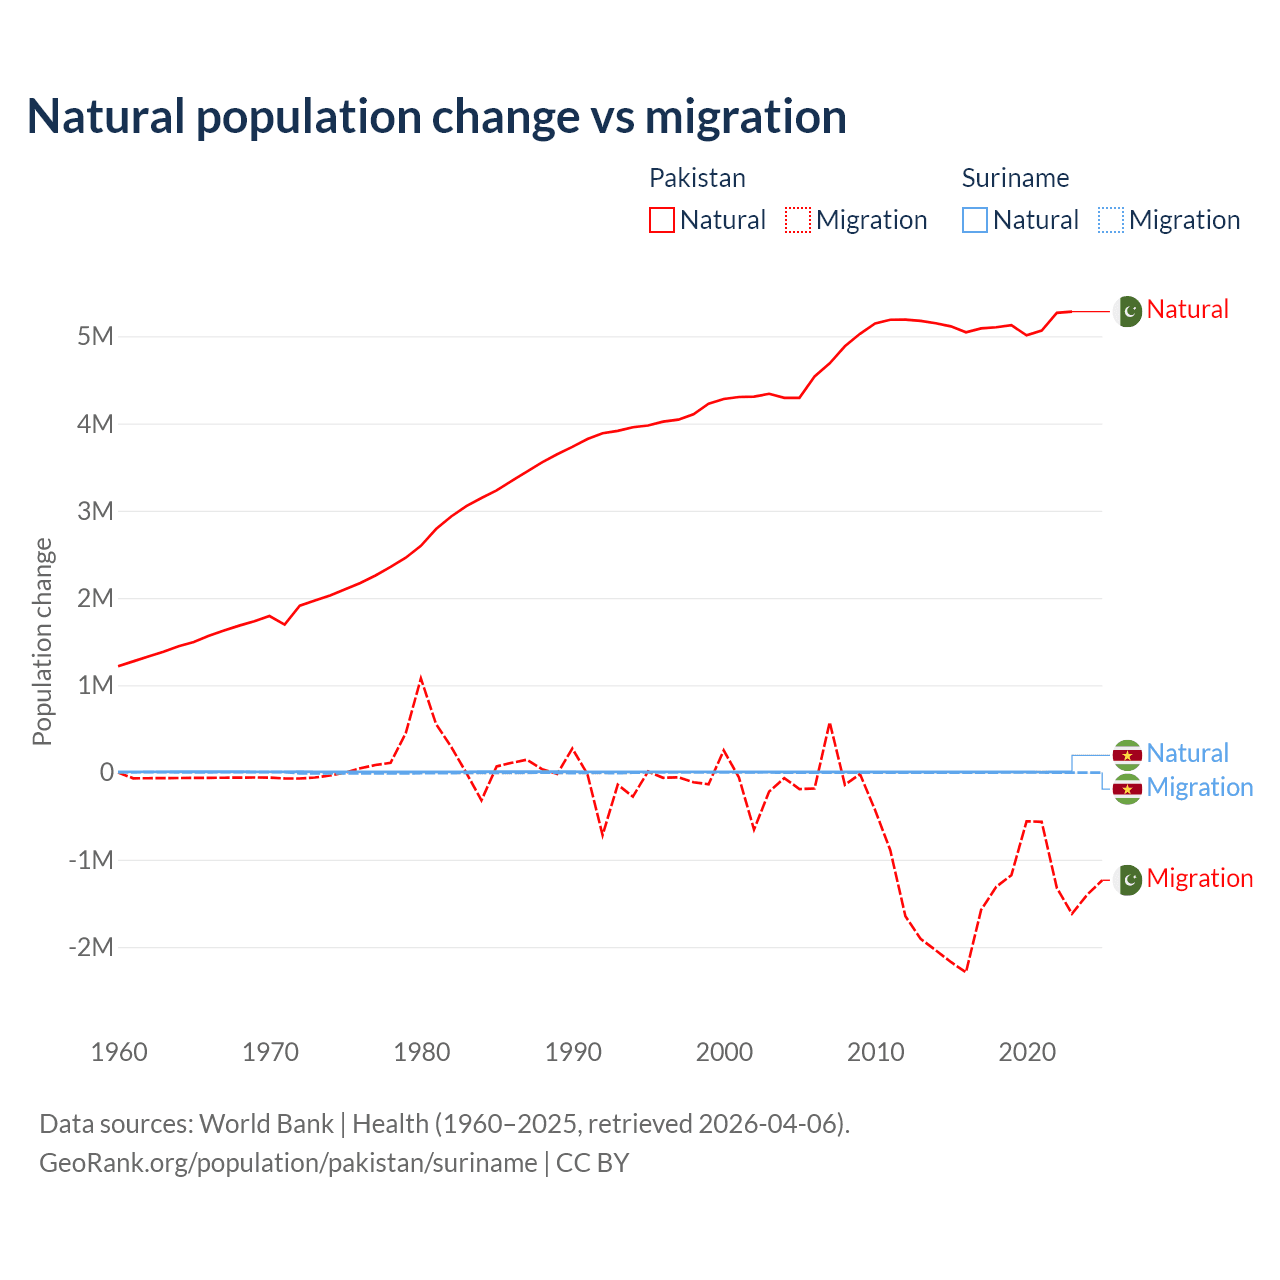
Natural population change vs migration
| Year | Population change | |||
|---|---|---|---|---|
|
Pakistan
|
Suriname
|
|||
| Natural | Migration | Natural | Migration | |
| 2025 | - | -1,235,336 | - | -967 |
| 2024 | 5,268,361 | -1,401,173 | 6,541 | -1,166 |
| 2023 | 5,281,745 | -1,619,557 | 6,697 | -988 |
| 2022 | 5,268,077 | -1,322,625 | 6,719 | -988 |
| 2021 | 5,065,913 | -565,673 | 5,291 | -486 |
| 2020 | 5,011,177 | -559,291 | 6,640 | -296 |
| 2019 | 5,127,011 | -1,177,220 | 6,564 | 191 |
| 2018 | 5,103,858 | -1,309,611 | 6,613 | -851 |
| 2017 | 5,090,200 | -1,574,585 | 6,772 | -935 |
| 2016 | 5,044,922 | -2,290,411 | 6,979 | -906 |
| 2015 | 5,113,507 | -2,172,162 | 7,150 | -967 |
| 2014 | 5,148,994 | -2,037,920 | 7,284 | -959 |
| 2013 | 5,176,590 | -1,906,319 | 7,350 | -968 |
| 2012 | 5,191,263 | -1,647,989 | 7,405 | -1,011 |
| 2011 | 5,189,412 | -890,633 | 7,401 | -1,060 |
| 2010 | 5,147,142 | -431,902 | 7,489 | -1,138 |
| 2009 | 5,028,132 | -18,298 | 7,559 | -1,204 |
| 2008 | 4,885,855 | -140,746 | 7,552 | -1,255 |
| 2007 | 4,690,187 | 576,349 | 7,468 | -1,312 |
| 2006 | 4,538,426 | -183,933 | 7,278 | -1,403 |
| 2005 | 4,294,393 | -189,899 | 7,037 | -1,534 |
| 2004 | 4,294,654 | -64,669 | 6,948 | -1,676 |
| 2003 | 4,340,688 | -219,118 | 7,396 | 2,345 |
| 2002 | 4,307,607 | -653,758 | 7,916 | 2,076 |
| 2001 | 4,304,297 | -54,727 | 8,349 | 1,641 |
| 2000 | 4,281,169 | 252,869 | 8,323 | 1,516 |
| 1999 | 4,228,026 | -134,510 | 8,236 | 1,380 |
| 1998 | 4,104,824 | -112,191 | 8,173 | 1,241 |
| 1997 | 4,043,912 | -55,539 | 8,106 | 1,164 |
| 1996 | 4,021,758 | -60,855 | 8,031 | 1,165 |
| 1995 | 3,977,175 | 11,534 | 7,968 | 1,275 |
| 1994 | 3,956,699 | -277,100 | 7,929 | -2,713 |
| 1993 | 3,915,776 | -139,493 | 8,127 | -7,291 |
| 1992 | 3,888,637 | -718,387 | 8,355 | -5,662 |
| 1991 | 3,822,363 | -19,668 | 8,637 | -6,174 |
| 1990 | 3,731,730 | 275,242 | 9,047 | -6,471 |
| 1989 | 3,648,132 | -17,164 | 9,441 | -3,846 |
| 1988 | 3,554,755 | 38,139 | 9,347 | -2,573 |
| 1987 | 3,448,813 | 146,364 | 9,319 | -5,467 |
| 1986 | 3,341,643 | 111,045 | 9,222 | -3,920 |
| 1985 | 3,233,315 | 68,860 | 9,177 | -3,763 |
| 1984 | 3,145,772 | -319,242 | 9,031 | -4,894 |
| 1983 | 3,052,738 | -4,753 | 8,797 | -6,036 |
| 1982 | 2,934,689 | 294,252 | 8,197 | -6,566 |
| 1981 | 2,790,454 | 555,032 | 7,541 | -6,991 |
| 1980 | 2,598,421 | 1,078,229 | 7,002 | -7,390 |
| 1979 | 2,461,311 | 450,003 | 7,312 | -11,375 |
| 1978 | 2,356,601 | 111,386 | 7,650 | -11,389 |
| 1977 | 2,257,849 | 85,250 | 7,998 | -11,390 |
| 1976 | 2,171,812 | 48,238 | 8,327 | -11,381 |
| 1975 | 2,099,811 | -1,710 | 8,587 | -11,287 |
| 1974 | 2,028,061 | -34,785 | 8,751 | -11,061 |
| 1973 | 1,971,909 | -58,012 | 8,877 | -10,765 |
| 1972 | 1,912,774 | -69,209 | 8,893 | -10,285 |
| 1971 | 1,695,374 | -68,357 | 8,814 | 3,552 |
| 1970 | 1,793,570 | -58,281 | 8,823 | 3,791 |
| 1969 | 1,733,601 | -57,406 | 8,880 | 3,575 |
| 1968 | 1,683,296 | -58,721 | 8,980 | 3,147 |
| 1967 | 1,626,737 | -59,932 | 9,104 | 2,637 |
| 1966 | 1,566,343 | -61,025 | 9,243 | 2,103 |
| 1965 | 1,496,050 | -62,070 | 9,270 | 1,657 |
| 1964 | 1,447,394 | -63,298 | 9,174 | 1,820 |
| 1963 | 1,384,934 | -64,552 | 8,838 | 4,181 |
| 1962 | 1,328,675 | -65,780 | 8,529 | 4,703 |
| 1961 | 1,273,772 | -66,991 | 8,361 | 660 |
| 1960 | 1,217,147 | 0 | 8,170 | 544 |
Data sources: World Bank | Health (1960–2025, retrieved 2026-07-08).
GeoRank.org/population/pakistan/suriname | CC BY
Over the last 10 years, 78.6% of the population change in Pakistan is from natural causes (a gain of 51,374,771 people) and 21.4% is from migration (a loss of 13,992,308 people). In Suriname 89.9% is from natural causes (a gain of 65,966 people) and 10.1% is from migration (a loss of 7,392 people).
As of 2024, 4,175,958 residents or 1.7% of the population were not native-born in Pakistan, compared to 51,902 people or 8.2% in Suriname.
Biggest cities by population
Compare countries by 7 more topics
Population differences between Pakistan and Suriname
|
Pakistan
|
Suriname
|
|
|---|---|---|
| Life expectancy | 68.1 years | 74 years |
| Average age | 25.8 years | 32.6 years |
| Median age | 21.6 years | 29.6 years |
| Male:Female ratio | 50.7:49.3 | 49.9:50.1 |
| Fertility rate | 3.55 births per woman | 2.23 births per woman |
| Population density | 871 ppl/mi² | 10.4 ppl/mi² |
Population map with other countries
Data sources: World Bank | Health (1960–2025, retrieved 2026-07-08); United Nations | World Population Prospects (1960–2026, retrieved 2026-07-08); U.S. Census Bureau (1960–2025, retrieved 2026-07-08); Central Intelligence Agency (CIA) (2000–2019, retrieved 2026-07-08).
GeoRank.org/population/pakistan/suriname | CC BY
Help us show the world through your eyes
Share a photo of your city and help others discover what it looks like to live there. Your contribution makes our data come alive.
Data sources:
- World Bank | Health (1960–2025, retrieved 2026-07-08)
- United Nations | World Population Prospects (1960–2100, retrieved 2026-07-08)
- U.S. Census Bureau (1960–2025, retrieved 2026-07-08)
- Central Intelligence Agency (CIA) (2000–2019, retrieved 2026-07-08)
- Wikidata (2026, retrieved 2026-07-08)
Creative Commons Attribution (CC BY) — you’re free to copy, share, remix, adapt, and use even commercially as long as you give appropriate credit and clearly indicate if you made changes. Other sources may be subject to different license terms.