The latest officially reported population of Kyrgyzstan was 7,343,064 in 2025 vs 14,569,341 people in Rwanda in 2025. In 2026, based on the adjusted UN estimation, the current Kyrgyzstan's population is 7,505,771 people compared to 15,062,056 in Rwanda.
Population statistics:
- Rwanda's population is 2.01 times bigger than Kyrgyzstan's.
- Kyrgyzstan is ranked the 106th most populous country in the world, while Rwanda is the 77th.
- The countries together account for 0.27% of the world: 0.09% for Kyrgyzstan vs 0.18% for Rwanda.
- For the last 10 years, Kyrgyzstan has had an average growth rate of +2% per year vs +2.28% in Rwanda.
- Since 2006, the population of Kyrgyzstan has increased from 5.22M people to 7.51M (43.8% growth), while Rwanda has grown from 9.3M to 15.1M (62% growth).
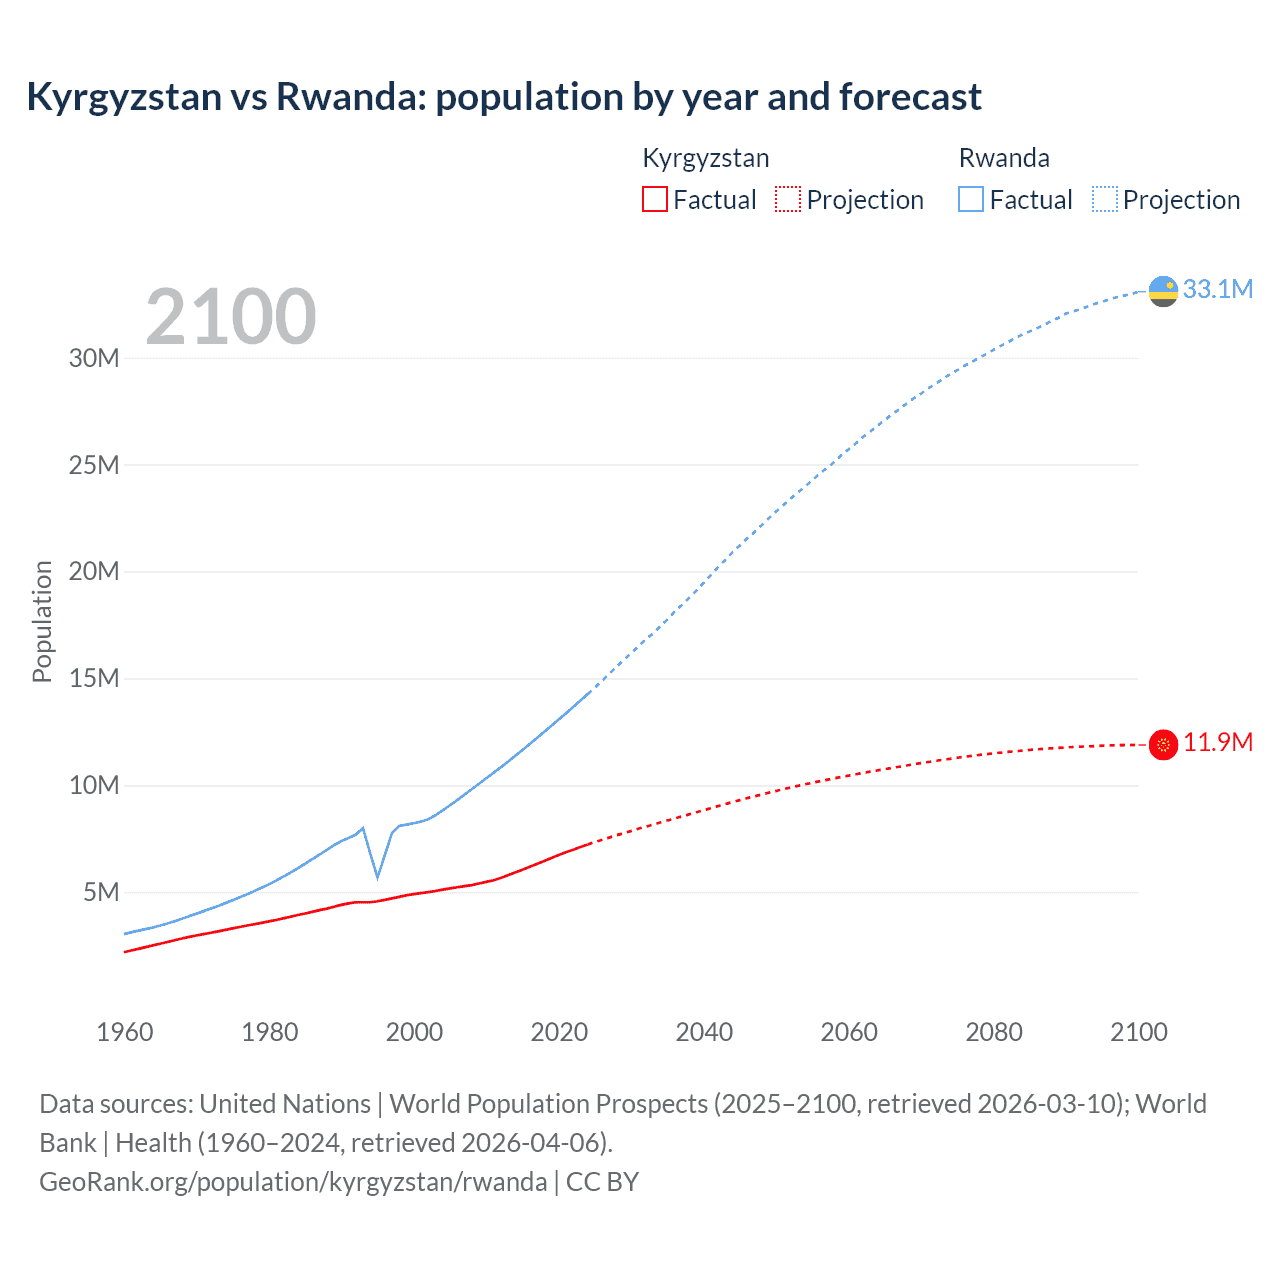
Kyrgyzstan vs Rwanda: population by year and forecast
| Year | Population | |
|---|---|---|
 Kyrgyzstan
|
 Rwanda
|
|
| 2100 | 11,893,475 | 33,113,283 |
| 2099 | 11,890,700 | 33,008,545 |
| 2098 | 11,886,376 | 32,927,982 |
| 2097 | 11,878,418 | 32,853,307 |
| 2096 | 11,868,604 | 32,768,037 |
| 2095 | 11,856,708 | 32,635,508 |
| 2094 | 11,842,004 | 32,550,001 |
| 2093 | 11,826,547 | 32,416,870 |
| 2092 | 11,811,507 | 32,294,333 |
| 2091 | 11,794,816 | 32,191,262 |
| 2090 | 11,776,743 | 32,088,747 |
| 2089 | 11,756,556 | 31,892,591 |
| 2088 | 11,734,533 | 31,746,789 |
| 2087 | 11,710,904 | 31,553,150 |
| 2086 | 11,685,092 | 31,399,004 |
| 2085 | 11,657,302 | 31,254,597 |
| 2084 | 11,627,305 | 31,112,448 |
| 2083 | 11,596,335 | 30,937,106 |
| 2082 | 11,565,309 | 30,752,861 |
| 2081 | 11,531,811 | 30,576,992 |
| 2080 | 11,496,474 | 30,386,351 |
| 2079 | 11,459,776 | 30,195,560 |
| 2078 | 11,420,394 | 30,016,688 |
| 2077 | 11,379,831 | 29,819,259 |
| 2076 | 11,337,247 | 29,645,610 |
| 2075 | 11,290,092 | 29,441,964 |
| 2074 | 11,242,895 | 29,243,980 |
| 2073 | 11,196,297 | 29,025,977 |
| 2072 | 11,145,255 | 28,798,822 |
| 2071 | 11,092,847 | 28,578,302 |
| 2070 | 11,039,249 | 28,334,300 |
| 2069 | 10,984,604 | 28,121,174 |
| 2068 | 10,928,940 | 27,872,383 |
| 2067 | 10,872,811 | 27,609,059 |
| 2066 | 10,815,162 | 27,372,823 |
| 2065 | 10,758,104 | 27,101,698 |
| 2064 | 10,700,945 | 26,838,144 |
| 2063 | 10,640,277 | 26,559,838 |
| 2062 | 10,579,126 | 26,312,631 |
| 2061 | 10,517,210 | 26,001,660 |
| 2060 | 10,455,339 | 25,729,037 |
| 2059 | 10,392,368 | 25,453,407 |
| 2058 | 10,325,792 | 25,121,995 |
| 2057 | 10,258,112 | 24,853,512 |
| 2056 | 10,188,786 | 24,582,198 |
| 2055 | 10,119,516 | 24,281,895 |
| 2054 | 10,047,571 | 23,991,958 |
| 2053 | 9,973,507 | 23,705,290 |
| 2052 | 9,898,179 | 23,421,032 |
| 2051 | 9,819,063 | 23,113,700 |
| 2050 | 9,737,536 | 22,814,556 |
| 2049 | 9,654,638 | 22,498,806 |
| 2048 | 9,569,296 | 22,171,841 |
| 2047 | 9,483,376 | 21,848,486 |
| 2046 | 9,396,627 | 21,554,082 |
| 2045 | 9,306,461 | 21,228,573 |
| 2044 | 9,214,649 | 20,915,810 |
| 2043 | 9,120,664 | 20,548,490 |
| 2042 | 9,025,981 | 20,214,283 |
| 2041 | 8,929,438 | 19,845,021 |
| 2040 | 8,831,799 | 19,475,227 |
| 2039 | 8,734,313 | 19,108,842 |
| 2038 | 8,637,242 | 18,773,398 |
| 2037 | 8,542,062 | 18,433,422 |
| 2036 | 8,446,471 | 18,128,058 |
| 2035 | 8,350,860 | 17,765,049 |
| 2034 | 8,255,039 | 17,432,165 |
| 2033 | 8,158,636 | 17,100,072 |
| 2032 | 8,061,935 | 16,822,053 |
| 2031 | 7,963,148 | 16,495,903 |
| 2030 | 7,863,148 | 16,178,061 |
| 2029 | 7,762,348 | 15,868,812 |
| 2028 | 7,661,118 | 15,554,713 |
| 2027 | 7,556,883 | 15,217,275 |
| 2026 | 7,451,789 | 14,898,118 |
| 2025 | 7,343,064 | 14,569,341 |
| 2024 | 7,221,868 | 14,256,567 |
| 2023 | 7,099,750 | 13,954,471 |
| 2022 | 6,975,220 | 13,651,030 |
| 2021 | 6,851,224 | 13,355,260 |
| 2020 | 6,726,596 | 13,065,837 |
| 2019 | 6,590,211 | 12,776,103 |
| 2018 | 6,444,079 | 12,487,996 |
| 2017 | 6,306,696 | 12,202,060 |
| 2016 | 6,175,338 | 11,919,183 |
| 2015 | 6,040,036 | 11,640,022 |
| 2014 | 5,905,848 | 11,364,757 |
| 2013 | 5,777,150 | 11,093,340 |
| 2012 | 5,652,076 | 10,829,901 |
| 2011 | 5,546,587 | 10,573,733 |
| 2010 | 5,467,059 | 10,317,553 |
| 2009 | 5,389,643 | 10,060,432 |
| 2008 | 5,318,729 | 9,804,269 |
| 2007 | 5,268,385 | 9,549,933 |
| 2006 | 5,218,373 | 9,299,246 |
| 2005 | 5,162,640 | 9,054,528 |
| 2004 | 5,104,713 | 8,816,844 |
| 2003 | 5,043,308 | 8,586,875 |
| 2002 | 4,990,704 | 8,400,180 |
| 2001 | 4,945,073 | 8,287,094 |
| 2000 | 4,898,362 | 8,213,931 |
| 1999 | 4,840,422 | 8,147,912 |
| 1998 | 4,769,015 | 8,081,681 |
| 1997 | 4,696,421 | 7,755,238 |
| 1996 | 4,628,438 | 6,708,764 |
| 1995 | 4,560,454 | 5,674,118 |
| 1994 | 4,515,069 | 6,792,352 |
| 1993 | 4,516,777 | 7,981,132 |
| 1992 | 4,515,400 | 7,683,266 |
| 1991 | 4,463,634 | 7,526,966 |
| 1990 | 4,391,236 | 7,375,307 |
| 1989 | 4,307,500 | 7,184,706 |
| 1988 | 4,218,400 | 6,968,071 |
| 1987 | 4,144,600 | 6,749,493 |
| 1986 | 4,066,500 | 6,531,881 |
| 1985 | 3,990,300 | 6,317,228 |
| 1984 | 3,916,400 | 6,107,627 |
| 1983 | 3,838,300 | 5,905,311 |
| 1982 | 3,759,300 | 5,711,549 |
| 1981 | 3,685,800 | 5,527,230 |
| 1980 | 3,617,400 | 5,353,259 |
| 1979 | 3,552,000 | 5,189,541 |
| 1978 | 3,487,100 | 5,035,171 |
| 1977 | 3,423,900 | 4,888,240 |
| 1976 | 3,358,700 | 4,745,954 |
| 1975 | 3,292,400 | 4,607,728 |
| 1974 | 3,223,900 | 4,474,228 |
| 1973 | 3,153,800 | 4,345,047 |
| 1972 | 3,088,200 | 4,220,335 |
| 1971 | 3,022,300 | 4,100,044 |
| 1970 | 2,959,900 | 3,980,669 |
| 1969 | 2,894,800 | 3,861,271 |
| 1968 | 2,818,300 | 3,744,010 |
| 1967 | 2,736,500 | 3,629,577 |
| 1966 | 2,655,300 | 3,521,626 |
| 1965 | 2,573,300 | 3,423,210 |
| 1964 | 2,495,300 | 3,334,834 |
| 1963 | 2,413,700 | 3,258,890 |
| 1962 | 2,333,400 | 3,186,025 |
| 1961 | 2,255,900 | 3,106,779 |
| 1960 | 2,172,300 | 3,022,294 |
Data sources: United Nations | World Population Prospects (2026–2100, retrieved 2026-07-08); World Bank | Health (1960–2025, retrieved 2026-07-08).
GeoRank.org/population/kyrgyzstan/rwanda | CC BY 
From 2006 to 2016, the population of Kyrgyzstan increased by 956,965 people (a 18.3% growth), while Rwanda gained 2,619,937 people (a 28.2% growth).
For the next 10 years, from 2016 to 2026, Kyrgyzstan gained 1,330,433 people (a 21.5% growth), while Rwanda's population increased by 3,142,873 people (a 26.4% growth).
Kyrgyzstan was ranked 112th most populous country in 2006 and is 106th in 2026. Rwanda was ranked 86th in 2006 and ranked 77th now.
The UN's World Population Prospects forecasts that in 24 years (in 2050) Kyrgyzstan's population will grow by 29.7% to 9,737,536 people with a rank change from 106th to 100th. The population of Rwanda will increase by 51.5% to 22,814,556 people and rank change from 77th to 72nd.
Kyrgyzstan is projected to reach its peak in 2100 at 11.9M people compared to the peak of 33.1M people in 2100 for Rwanda.
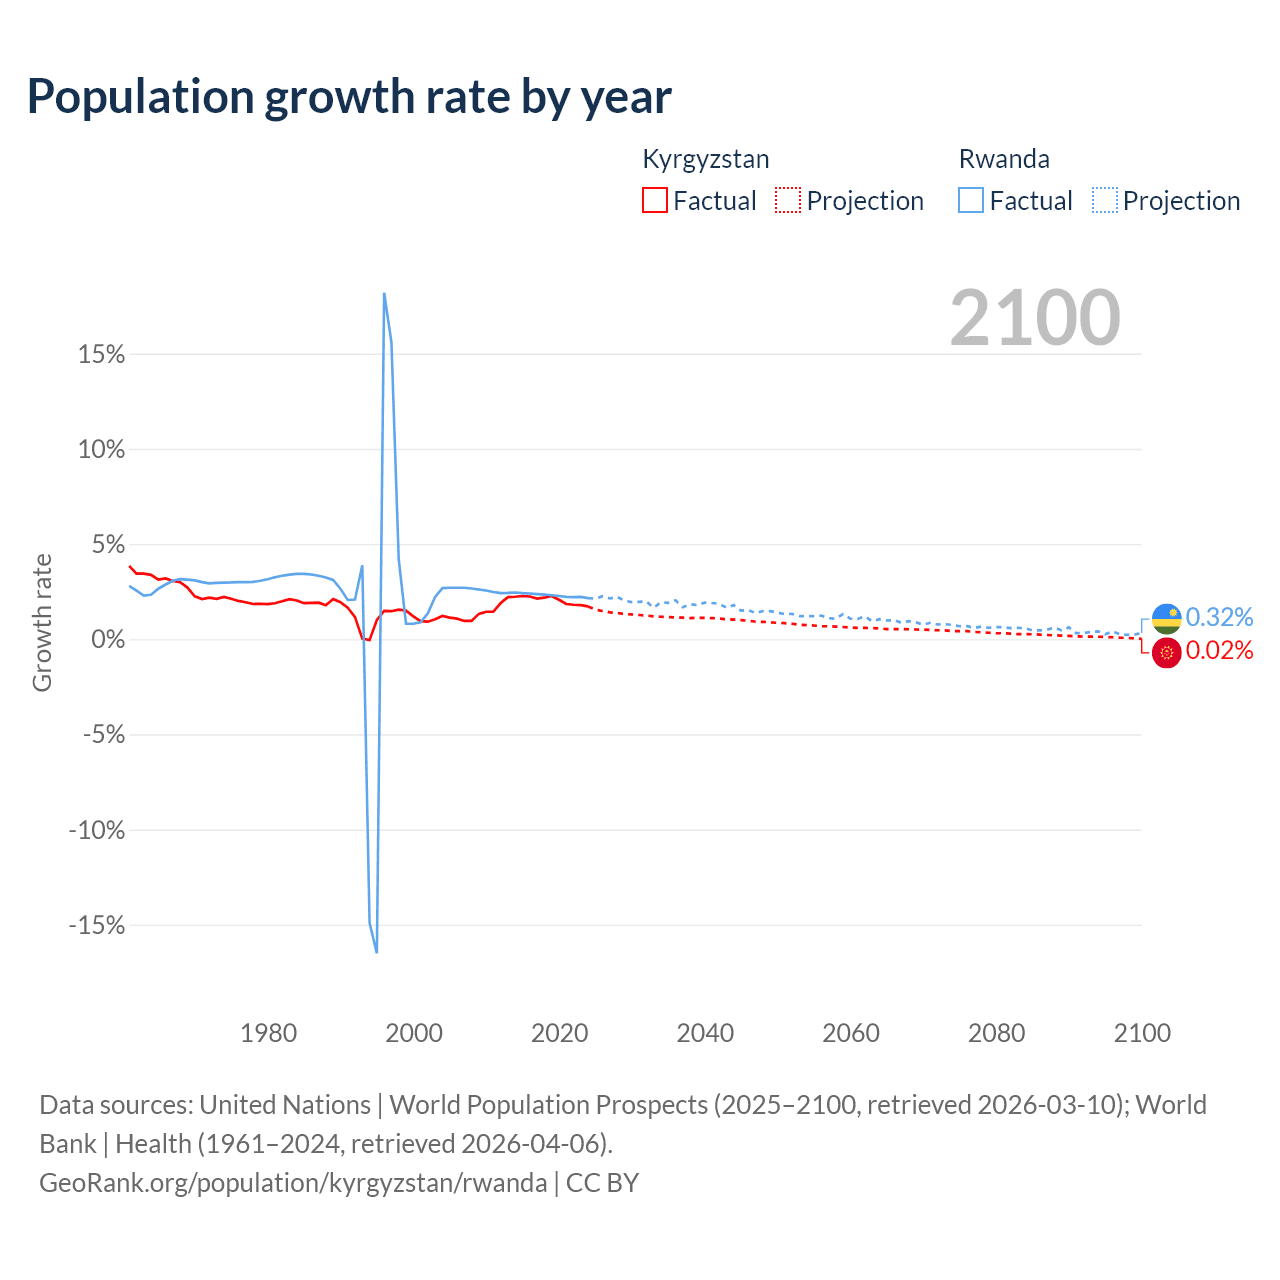
Population growth rate by year
| Year | Growth rate | |
|---|---|---|
|
Kyrgyzstan
|
Rwanda
|
|
| 2100 | 0.02% | 0.32% |
| 2099 | 0.04% | 0.24% |
| 2098 | 0.07% | 0.23% |
| 2097 | 0.08% | 0.26% |
| 2096 | 0.1% | 0.41% |
| 2095 | 0.12% | 0.26% |
| 2094 | 0.13% | 0.41% |
| 2093 | 0.13% | 0.38% |
| 2092 | 0.14% | 0.32% |
| 2091 | 0.15% | 0.32% |
| 2090 | 0.17% | 0.62% |
| 2089 | 0.19% | 0.46% |
| 2088 | 0.2% | 0.61% |
| 2087 | 0.22% | 0.49% |
| 2086 | 0.24% | 0.46% |
| 2085 | 0.26% | 0.46% |
| 2084 | 0.27% | 0.57% |
| 2083 | 0.27% | 0.6% |
| 2082 | 0.29% | 0.58% |
| 2081 | 0.31% | 0.63% |
| 2080 | 0.32% | 0.63% |
| 2079 | 0.34% | 0.6% |
| 2078 | 0.36% | 0.66% |
| 2077 | 0.38% | 0.59% |
| 2076 | 0.42% | 0.69% |
| 2075 | 0.42% | 0.68% |
| 2074 | 0.42% | 0.75% |
| 2073 | 0.46% | 0.79% |
| 2072 | 0.47% | 0.77% |
| 2071 | 0.49% | 0.86% |
| 2070 | 0.5% | 0.76% |
| 2069 | 0.51% | 0.89% |
| 2068 | 0.52% | 0.95% |
| 2067 | 0.53% | 0.86% |
| 2066 | 0.53% | 1% |
| 2065 | 0.53% | 0.98% |
| 2064 | 0.57% | 1.05% |
| 2063 | 0.58% | 0.94% |
| 2062 | 0.59% | 1.2% |
| 2061 | 0.59% | 1.06% |
| 2060 | 0.61% | 1.08% |
| 2059 | 0.64% | 1.32% |
| 2058 | 0.66% | 1.08% |
| 2057 | 0.68% | 1.1% |
| 2056 | 0.68% | 1.24% |
| 2055 | 0.72% | 1.21% |
| 2054 | 0.74% | 1.21% |
| 2053 | 0.76% | 1.21% |
| 2052 | 0.81% | 1.33% |
| 2051 | 0.84% | 1.31% |
| 2050 | 0.86% | 1.4% |
| 2049 | 0.89% | 1.47% |
| 2048 | 0.91% | 1.48% |
| 2047 | 0.92% | 1.37% |
| 2046 | 0.97% | 1.53% |
| 2045 | 1% | 1.5% |
| 2044 | 1.03% | 1.79% |
| 2043 | 1.05% | 1.65% |
| 2042 | 1.08% | 1.86% |
| 2041 | 1.11% | 1.9% |
| 2040 | 1.12% | 1.92% |
| 2039 | 1.12% | 1.79% |
| 2038 | 1.11% | 1.84% |
| 2037 | 1.13% | 1.68% |
| 2036 | 1.14% | 2.04% |
| 2035 | 1.16% | 1.91% |
| 2034 | 1.18% | 1.94% |
| 2033 | 1.2% | 1.65% |
| 2032 | 1.24% | 1.98% |
| 2031 | 1.27% | 1.96% |
| 2030 | 1.3% | 1.95% |
| 2029 | 1.32% | 2.02% |
| 2028 | 1.38% | 2.22% |
| 2027 | 1.41% | 2.14% |
| 2026 | 1.48% | 2.26% |
| 2025 | 1.68% | 2.19% |
| 2024 | 1.72% | 2.16% |
| 2023 | 1.79% | 2.22% |
| 2022 | 1.81% | 2.21% |
| 2021 | 1.85% | 2.22% |
| 2020 | 2.07% | 2.27% |
| 2019 | 2.27% | 2.31% |
| 2018 | 2.18% | 2.34% |
| 2017 | 2.13% | 2.37% |
| 2016 | 2.24% | 2.4% |
| 2015 | 2.27% | 2.42% |
| 2014 | 2.23% | 2.45% |
| 2013 | 2.21% | 2.43% |
| 2012 | 1.9% | 2.42% |
| 2011 | 1.45% | 2.48% |
| 2010 | 1.44% | 2.56% |
| 2009 | 1.33% | 2.61% |
| 2008 | 0.96% | 2.66% |
| 2007 | 0.96% | 2.7% |
| 2006 | 1.08% | 2.7% |
| 2005 | 1.13% | 2.7% |
| 2004 | 1.22% | 2.68% |
| 2003 | 1.05% | 2.22% |
| 2002 | 0.92% | 1.36% |
| 2001 | 0.95% | 0.89% |
| 2000 | 1.2% | 0.81% |
| 1999 | 1.5% | 0.82% |
| 1998 | 1.55% | 4.21% |
| 1997 | 1.47% | 15.6% |
| 1996 | 1.49% | 18.2% |
| 1995 | 1.01% | -16.5% |
| 1994 | -0.04% | -14.9% |
| 1993 | 0.03% | 3.88% |
| 1992 | 1.16% | 2.08% |
| 1991 | 1.65% | 2.06% |
| 1990 | 1.94% | 2.65% |
| 1989 | 2.11% | 3.11% |
| 1988 | 1.78% | 3.24% |
| 1987 | 1.92% | 3.33% |
| 1986 | 1.91% | 3.4% |
| 1985 | 1.89% | 3.43% |
| 1984 | 2.03% | 3.43% |
| 1983 | 2.1% | 3.39% |
| 1982 | 1.99% | 3.33% |
| 1981 | 1.89% | 3.25% |
| 1980 | 1.84% | 3.15% |
| 1979 | 1.86% | 3.07% |
| 1978 | 1.85% | 3.01% |
| 1977 | 1.94% | 3% |
| 1976 | 2.01% | 3% |
| 1975 | 2.12% | 2.98% |
| 1974 | 2.22% | 2.97% |
| 1973 | 2.12% | 2.96% |
| 1972 | 2.18% | 2.93% |
| 1971 | 2.11% | 3% |
| 1970 | 2.25% | 3.09% |
| 1969 | 2.71% | 3.13% |
| 1968 | 2.99% | 3.15% |
| 1967 | 3.06% | 3.07% |
| 1966 | 3.19% | 2.87% |
| 1965 | 3.13% | 2.65% |
| 1964 | 3.38% | 2.33% |
| 1963 | 3.44% | 2.29% |
| 1962 | 3.44% | 2.55% |
| 1961 | 3.85% | 2.8% |
Data sources: United Nations | World Population Prospects (2026–2100, retrieved 2026-07-08); World Bank | Health (1961–2025, retrieved 2026-07-08).
GeoRank.org/population/kyrgyzstan/rwanda | CC BY
In 2025, the population of Kyrgyzstan grew by 1.68%, while Rwanda's population grew by 2.19%.
Live population counters
|
Kyrgyzstan
|
Rwanda
|
|
|---|---|---|
| Current population |
7505771
|
15062056
|
| Population rank | 106/197 | 77/197 |
| Percent of world population | 0.09% | 0.18% |
| One net population change |
4.35 minutes
|
1.69 minutes
|
| One birth every |
3.75 minutes
|
1.31 minutes
|
| One death every |
16.5 minutes
|
6.25 minutes
|
| Daily growth/decline | +332 | +857 |
| Annual growth/decline | +121,196 | +312,774 |
| Annual growth/decline rate | +1.68% | +2.19% |
| Population growth rate rank | 61/197 | 40/197 |
| One migration net change every |
4.84 hours
|
1.4 hours
|
| Annual migration change | +1,815 | +6,282 |
| Net migration rank | 58/196 | 48/196 |
| Foreign-born residents | 194,816 | 513,316 |
| Foreign-born residents rank | 114/195 | 80/195 |
| Foreign-born share of population | 2.7% | 3.6% |
| Foreign-born share rank | 122/195 | 109/195 |
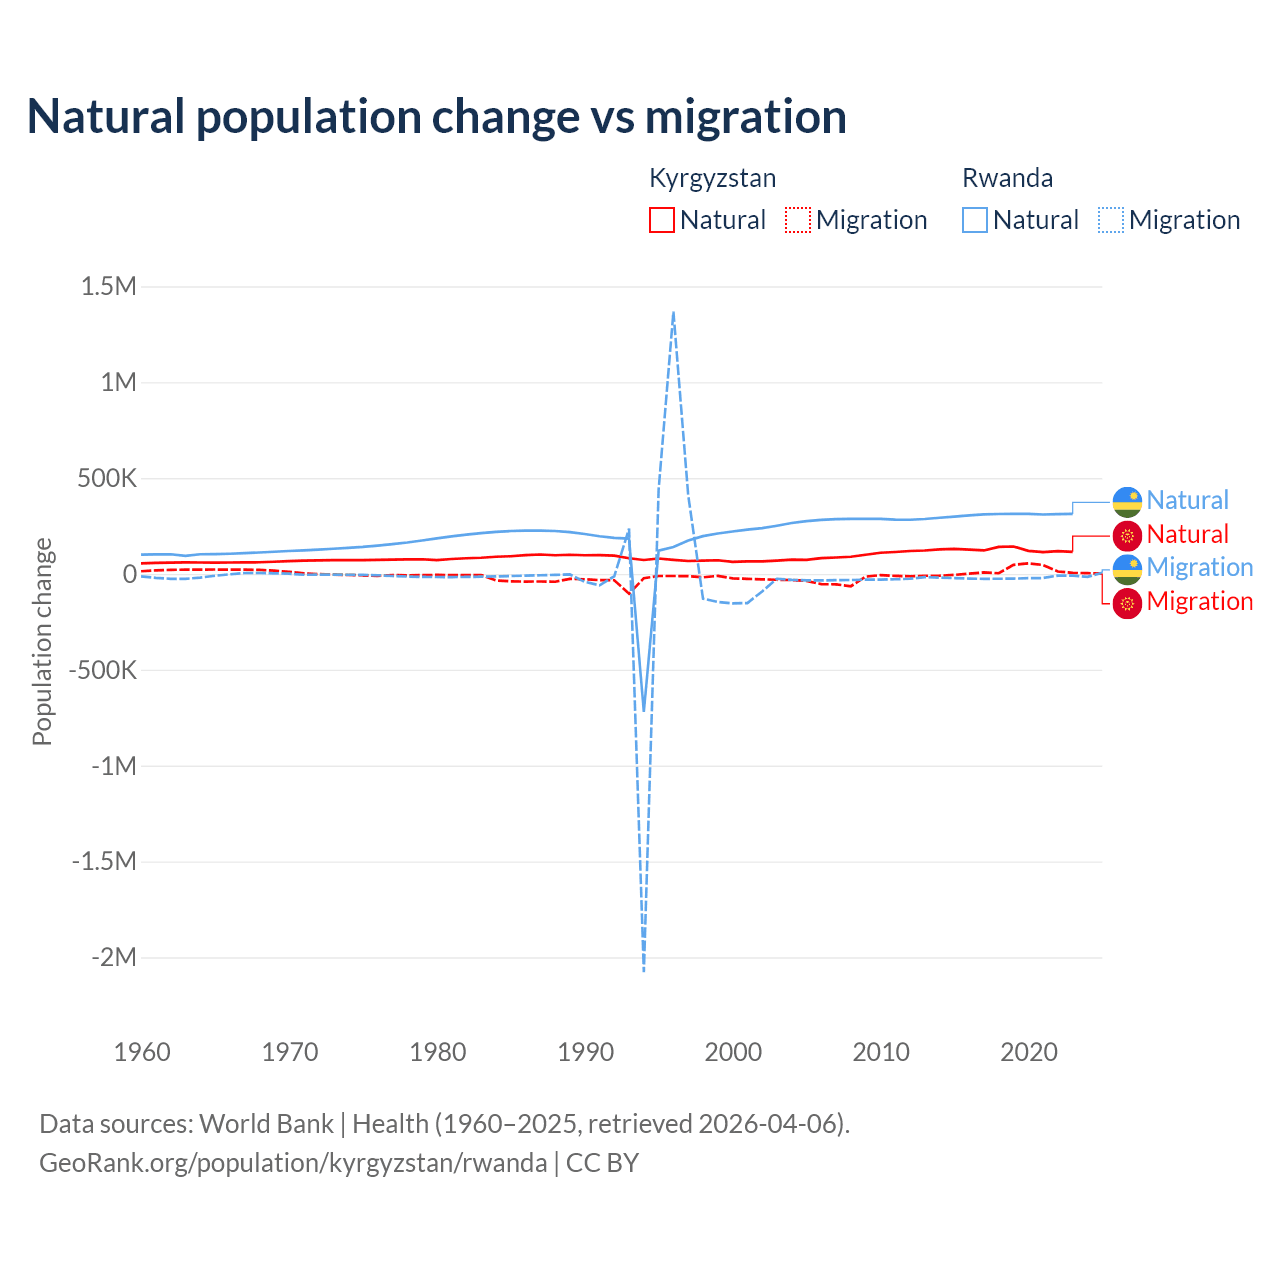
Natural population change vs migration
| Year | Population change | |||
|---|---|---|---|---|
|
Kyrgyzstan
|
Rwanda
|
|||
| Natural | Migration | Natural | Migration | |
| 2025 | - | 1,815 | - | 6,282 |
| 2024 | 108,328 | 3,645 | 316,025 | -15,582 |
| 2023 | 115,016 | 5,601 | 312,762 | -9,001 |
| 2022 | 118,579 | 12,596 | 312,145 | -9,001 |
| 2021 | 113,730 | 46,208 | 309,895 | -21,492 |
| 2020 | 120,406 | 54,704 | 312,692 | -22,251 |
| 2019 | 143,007 | 47,303 | 313,525 | -24,492 |
| 2018 | 141,125 | 3,494 | 312,512 | -25,323 |
| 2017 | 122,350 | 7,553 | 310,323 | -25,634 |
| 2016 | 126,594 | 1,187 | 305,549 | -24,474 |
| 2015 | 130,464 | -5,071 | 299,114 | -21,862 |
| 2014 | 127,566 | -9,443 | 292,779 | -19,505 |
| 2013 | 121,898 | -9,667 | 286,331 | -16,779 |
| 2012 | 119,259 | -12,503 | 282,584 | -25,260 |
| 2011 | 114,260 | -10,170 | 282,922 | -27,915 |
| 2010 | 110,435 | -6,521 | 286,848 | -29,501 |
| 2009 | 99,709 | -14,325 | 287,034 | -30,128 |
| 2008 | 89,355 | -64,404 | 287,334 | -31,913 |
| 2007 | 85,348 | -54,298 | 285,791 | -32,537 |
| 2006 | 81,929 | -53,469 | 282,149 | -34,008 |
| 2005 | 72,793 | -36,288 | 275,121 | -33,830 |
| 2004 | 74,529 | -32,088 | 265,273 | -31,214 |
| 2003 | 69,598 | -30,686 | 251,243 | -25,355 |
| 2002 | 65,379 | -28,300 | 239,036 | -91,518 |
| 2001 | 65,275 | -25,695 | 230,845 | -152,197 |
| 2000 | 62,699 | -23,265 | 221,276 | -153,588 |
| 1999 | 71,155 | -10,297 | 210,518 | -146,162 |
| 1998 | 69,151 | -17,690 | 197,185 | -129,089 |
| 1997 | 67,159 | -11,740 | 174,687 | 410,106 |
| 1996 | 73,129 | -10,926 | 140,455 | 1,367,700 |
| 1995 | 80,264 | -10,767 | 121,137 | 439,995 |
| 1994 | 72,693 | -22,165 | -719,479 | -2,078,111 |
| 1993 | 81,754 | -103,698 | 183,926 | 236,110 |
| 1992 | 95,275 | -33,009 | 188,025 | -12,334 |
| 1991 | 97,753 | -32,276 | 196,431 | -59,519 |
| 1990 | 97,485 | -27,912 | 207,895 | -41,483 |
| 1989 | 99,934 | -25,723 | 217,632 | -2,826 |
| 1988 | 97,415 | -40,823 | 223,759 | -5,285 |
| 1987 | 101,232 | -39,678 | 225,744 | -7,062 |
| 1986 | 98,263 | -40,062 | 225,526 | -8,982 |
| 1985 | 92,084 | -38,536 | 223,794 | -11,031 |
| 1984 | 89,356 | -34,248 | 219,337 | -12,899 |
| 1983 | 84,139 | -5,525 | 212,750 | -14,560 |
| 1982 | 81,716 | -6,388 | 205,147 | -15,818 |
| 1981 | 77,955 | -6,725 | 195,769 | -16,453 |
| 1980 | 72,092 | -5,090 | 184,988 | -16,359 |
| 1979 | 76,489 | -6,672 | 174,477 | -15,669 |
| 1978 | 76,137 | -6,988 | 163,779 | -13,838 |
| 1977 | 74,296 | -6,724 | 155,011 | -11,084 |
| 1976 | 73,280 | -10,499 | 147,665 | -7,027 |
| 1975 | 72,255 | -7,639 | 140,596 | -4,791 |
| 1974 | 71,925 | -5,818 | 135,743 | -4,535 |
| 1973 | 71,500 | -3,373 | 131,021 | -3,862 |
| 1972 | 70,852 | -1,163 | 126,403 | -4,156 |
| 1971 | 68,902 | 2,645 | 122,567 | -4,230 |
| 1970 | 66,485 | 11,295 | 119,273 | 1,149 |
| 1969 | 63,396 | 16,862 | 115,394 | 2,983 |
| 1968 | 60,670 | 20,918 | 111,422 | 4,728 |
| 1967 | 59,793 | 22,162 | 108,053 | 4,655 |
| 1966 | 59,346 | 21,868 | 105,128 | -1,930 |
| 1965 | 59,163 | 22,870 | 103,422 | -9,774 |
| 1964 | 59,657 | 22,281 | 102,562 | -19,458 |
| 1963 | 60,145 | 21,967 | 94,296 | -25,524 |
| 1962 | 58,827 | 21,217 | 102,548 | -25,594 |
| 1961 | 57,176 | 18,355 | 102,051 | -20,508 |
| 1960 | 54,920 | 13,946 | 100,627 | -13,198 |
Data sources: World Bank | Health (1960–2025, retrieved 2026-07-08).
GeoRank.org/population/kyrgyzstan/rwanda | CC BY
Over the last 10 years, 87.5% of the population change in Kyrgyzstan is from natural causes (a gain of 1,239,599 people) and 12.5% is from migration (a gain of 177,220 people). In Rwanda 94% is from natural causes (a gain of 3,104,542 people) and 6.03% is from migration (a loss of 199,112 people).
As of 2024, 194,816 residents or 2.7% of the population were not native-born in Kyrgyzstan, compared to 513,316 people or 3.6% in Rwanda.
Biggest cities by population
|
Kyrgyzstan
|
|
|---|---|
| City | Population |
| Bishkek | 1.19M |
| Osh | 375K |
| Jalal-Abad | 89K |
| Tokmok | 53.2K |
| Naryn | 34.8K |
| Talas | 32.9K |
| Kant | 23.2K |
| Toktogul | 16.4K |
| Cholpon-Ata | 11.5K |
|
Rwanda
|
|
|---|---|
| City | Population |
| Kigali | 1.75M |
| Ruhengeri | 153K |
| Gisenyi | 53.6K |
| Byumba | 36.4K |
| Cyangugu | 27.4K |
| Nyanza | 25.4K |
| Butare | 19.9K |
| Kibuye | 12.3K |
Compare countries by 7 more topics
Population differences between Kyrgyzstan and Rwanda
|
Kyrgyzstan
|
Rwanda
|
|
|---|---|---|
| Life expectancy | 72.1 years | 68.5 years |
| Average age | 29.3 years | 25.1 years |
| Median age | 26.3 years | 21 years |
| Male:Female ratio | 49.4:50.6 | 48.8:51.2 |
| Fertility rate | 2.6 births per woman | 3.65 births per woman |
| Population density | 100.6 ppl/mi² | 1,564 ppl/mi² |
Population map with other countries
Data sources: World Bank | Health (1960–2025, retrieved 2026-07-08); United Nations | World Population Prospects (1960–2026, retrieved 2026-07-08); U.S. Census Bureau (1960–2025, retrieved 2026-07-08); Central Intelligence Agency (CIA) (2000–2019, retrieved 2026-07-08).
GeoRank.org/population/kyrgyzstan/rwanda | CC BY
Help us show the world through your eyes
Share a photo of your city and help others discover what it looks like to live there. Your contribution makes our data come alive.
Data sources:
- World Bank | Health (1960–2025, retrieved 2026-07-08)
- United Nations | World Population Prospects (1960–2100, retrieved 2026-07-08)
- U.S. Census Bureau (1960–2025, retrieved 2026-07-08)
- Central Intelligence Agency (CIA) (2000–2019, retrieved 2026-07-08)
- Wikidata (2026, retrieved 2026-07-08)
Creative Commons Attribution (CC BY) — you’re free to copy, share, remix, adapt, and use even commercially as long as you give appropriate credit and clearly indicate if you made changes. Other sources may be subject to different license terms.