The latest officially reported population of Indonesia was 285,721,236 in 2025 vs 28,516,896 people in Venezuela in 2025. In 2026, based on the adjusted UN estimation, the current Indonesia's population is 289,027,659 people compared to 28,692,435 in Venezuela.
Population statistics:
- Indonesia's population is 10.1 times bigger than Venezuela's.
- Indonesia is ranked the 4th most populous country in the world, while Venezuela is the 54th.
- The countries together account for 3.82% of the world: 3.48% for Indonesia vs 0.35% for Venezuela.
- For the last 10 years, Indonesia has had an average growth rate of +0.9% per year vs -0.53% in Venezuela.
- Since 2006, the population of Indonesia has increased from 234M people to 289M (23.5% growth), while Venezuela has grown from 27.2M to 28.7M (5.39% growth).
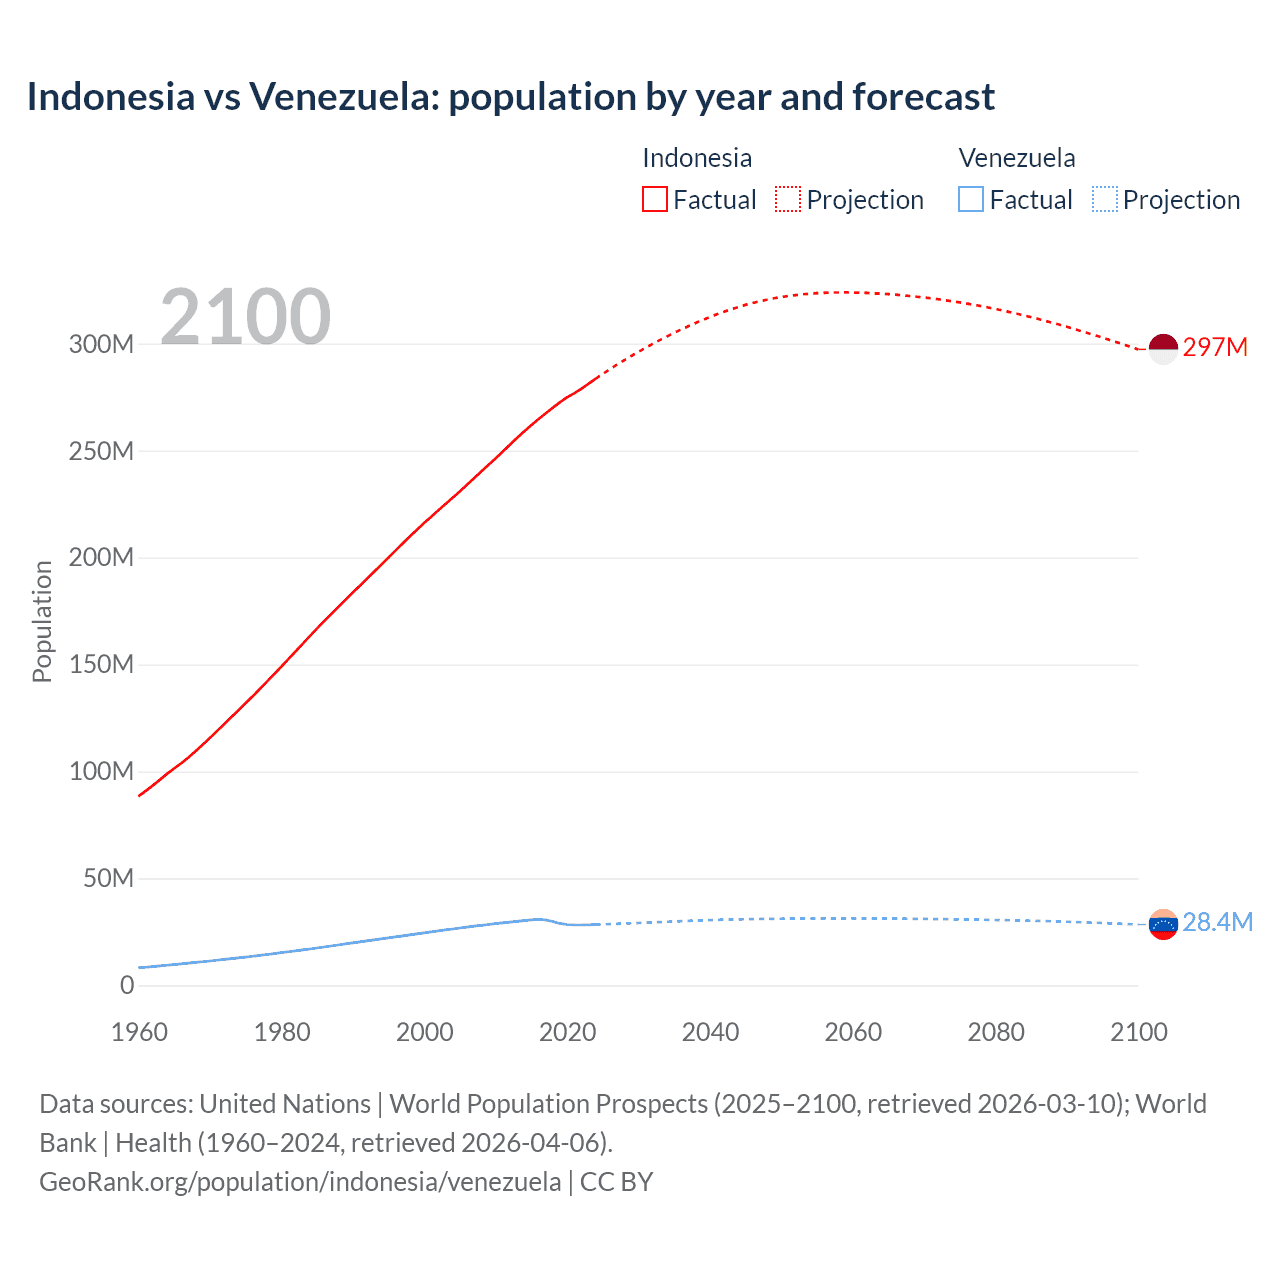
Indonesia vs Venezuela: population by year and forecast
| Year | Population | |
|---|---|---|
 Indonesia
|
 Venezuela
|
|
| 2100 | 297,217,412 | 28,410,292 |
| 2099 | 298,340,219 | 28,556,135 |
| 2098 | 299,449,882 | 28,707,705 |
| 2097 | 300,549,857 | 28,852,186 |
| 2096 | 301,634,112 | 28,997,910 |
| 2095 | 302,698,798 | 29,134,707 |
| 2094 | 303,751,488 | 29,264,882 |
| 2093 | 304,790,169 | 29,394,209 |
| 2092 | 305,809,796 | 29,510,768 |
| 2091 | 306,805,664 | 29,623,813 |
| 2090 | 307,780,044 | 29,734,285 |
| 2089 | 308,727,665 | 29,840,423 |
| 2088 | 309,652,467 | 29,936,470 |
| 2087 | 310,557,120 | 30,030,678 |
| 2086 | 311,434,804 | 30,120,614 |
| 2085 | 312,284,488 | 30,201,240 |
| 2084 | 313,107,329 | 30,276,736 |
| 2083 | 313,904,231 | 30,348,224 |
| 2082 | 314,670,881 | 30,418,460 |
| 2081 | 315,404,888 | 30,484,132 |
| 2080 | 316,109,402 | 30,549,302 |
| 2079 | 316,790,074 | 30,612,881 |
| 2078 | 317,438,140 | 30,674,565 |
| 2077 | 318,056,534 | 30,730,870 |
| 2076 | 318,635,038 | 30,780,046 |
| 2075 | 319,190,402 | 30,829,620 |
| 2074 | 319,709,426 | 30,868,955 |
| 2073 | 320,201,444 | 30,913,457 |
| 2072 | 320,659,562 | 30,956,993 |
| 2071 | 321,086,184 | 30,999,181 |
| 2070 | 321,485,042 | 31,039,456 |
| 2069 | 321,858,064 | 31,077,886 |
| 2068 | 322,201,979 | 31,111,229 |
| 2067 | 322,516,545 | 31,147,205 |
| 2066 | 322,798,892 | 31,177,952 |
| 2065 | 323,048,550 | 31,202,552 |
| 2064 | 323,268,759 | 31,217,149 |
| 2063 | 323,456,004 | 31,232,539 |
| 2062 | 323,612,644 | 31,245,802 |
| 2061 | 323,734,699 | 31,255,590 |
| 2060 | 323,814,746 | 31,264,668 |
| 2059 | 323,854,683 | 31,272,623 |
| 2058 | 323,844,015 | 31,273,762 |
| 2057 | 323,786,943 | 31,276,766 |
| 2056 | 323,671,172 | 31,268,661 |
| 2055 | 323,502,155 | 31,252,602 |
| 2054 | 323,274,189 | 31,238,775 |
| 2053 | 322,982,358 | 31,222,231 |
| 2052 | 322,627,695 | 31,194,694 |
| 2051 | 322,202,850 | 31,174,182 |
| 2050 | 321,699,802 | 31,139,557 |
| 2049 | 321,119,283 | 31,104,189 |
| 2048 | 320,457,830 | 31,062,699 |
| 2047 | 319,728,668 | 31,009,532 |
| 2046 | 318,921,027 | 30,960,686 |
| 2045 | 318,028,206 | 30,905,370 |
| 2044 | 317,051,440 | 30,845,107 |
| 2043 | 315,992,168 | 30,776,828 |
| 2042 | 314,856,940 | 30,694,535 |
| 2041 | 313,643,892 | 30,607,831 |
| 2040 | 312,358,800 | 30,504,638 |
| 2039 | 311,001,176 | 30,389,092 |
| 2038 | 309,578,763 | 30,268,244 |
| 2037 | 308,089,917 | 30,145,046 |
| 2036 | 306,544,452 | 30,014,973 |
| 2035 | 304,940,852 | 29,870,829 |
| 2034 | 303,275,782 | 29,718,039 |
| 2033 | 301,552,643 | 29,574,127 |
| 2032 | 299,781,696 | 29,428,330 |
| 2031 | 297,956,985 | 29,279,969 |
| 2030 | 296,081,262 | 29,139,878 |
| 2029 | 294,145,245 | 29,004,690 |
| 2028 | 292,143,454 | 28,880,803 |
| 2027 | 290,069,053 | 28,750,990 |
| 2026 | 287,927,760 | 28,630,592 |
| 2025 | 285,721,236 | 28,516,896 |
| 2024 | 283,487,931 | 28,405,543 |
| 2023 | 281,190,067 | 28,300,854 |
| 2022 | 278,830,529 | 28,213,017 |
| 2021 | 276,758,053 | 28,237,826 |
| 2020 | 274,814,866 | 28,444,077 |
| 2019 | 272,489,381 | 28,938,098 |
| 2018 | 269,951,846 | 29,807,592 |
| 2017 | 267,346,658 | 30,565,323 |
| 2016 | 264,627,418 | 30,765,720 |
| 2015 | 261,799,249 | 30,573,972 |
| 2014 | 258,877,399 | 30,254,079 |
| 2013 | 255,852,467 | 29,912,198 |
| 2012 | 252,698,525 | 29,553,826 |
| 2011 | 249,470,032 | 29,185,212 |
| 2010 | 246,305,322 | 28,813,101 |
| 2009 | 243,220,028 | 28,438,298 |
| 2008 | 240,157,903 | 28,053,696 |
| 2007 | 237,062,337 | 27,649,363 |
| 2006 | 233,951,652 | 27,224,686 |
| 2005 | 230,871,650 | 26,785,804 |
| 2004 | 227,926,649 | 26,340,838 |
| 2003 | 225,048,008 | 25,892,703 |
| 2002 | 222,088,495 | 25,435,671 |
| 2001 | 219,097,902 | 24,979,922 |
| 2000 | 216,077,790 | 24,526,708 |
| 1999 | 213,004,668 | 24,066,593 |
| 1998 | 209,826,788 | 23,601,337 |
| 1997 | 206,536,095 | 23,131,685 |
| 1996 | 203,204,348 | 22,662,113 |
| 1995 | 199,888,057 | 22,193,821 |
| 1994 | 196,591,828 | 21,725,188 |
| 1993 | 193,305,168 | 21,254,520 |
| 1992 | 190,043,744 | 20,780,948 |
| 1991 | 186,778,238 | 20,304,896 |
| 1990 | 183,501,098 | 19,827,010 |
| 1989 | 180,201,630 | 19,348,921 |
| 1988 | 176,855,065 | 18,871,020 |
| 1987 | 173,511,154 | 18,394,963 |
| 1986 | 170,175,065 | 17,923,536 |
| 1985 | 166,776,185 | 17,461,434 |
| 1984 | 163,251,124 | 17,008,841 |
| 1983 | 159,651,381 | 16,562,205 |
| 1982 | 156,052,152 | 16,121,874 |
| 1981 | 152,485,035 | 15,687,297 |
| 1980 | 148,950,540 | 15,258,218 |
| 1979 | 145,434,834 | 14,834,552 |
| 1978 | 141,953,163 | 14,416,684 |
| 1977 | 138,533,541 | 14,006,812 |
| 1976 | 135,173,655 | 13,606,284 |
| 1975 | 131,843,848 | 13,215,892 |
| 1974 | 128,555,045 | 12,835,351 |
| 1973 | 125,288,515 | 12,463,537 |
| 1972 | 122,039,841 | 12,099,180 |
| 1971 | 118,833,702 | 11,741,008 |
| 1970 | 115,657,495 | 11,387,790 |
| 1969 | 112,517,639 | 11,040,280 |
| 1968 | 109,450,006 | 10,697,530 |
| 1967 | 106,526,393 | 10,358,513 |
| 1966 | 103,792,754 | 10,024,854 |
| 1965 | 101,365,130 | 9,697,790 |
| 1964 | 98,833,749 | 9,377,712 |
| 1963 | 96,051,424 | 9,064,021 |
| 1962 | 93,375,850 | 8,756,870 |
| 1961 | 90,791,249 | 8,455,915 |
| 1960 | 88,296,070 | 8,160,090 |
Data sources: United Nations | World Population Prospects (2026–2100, retrieved 2026-07-08); World Bank | Health (1960–2025, retrieved 2026-07-08).
GeoRank.org/population/indonesia/venezuela | CC BY 
From 2006 to 2016, the population of Indonesia increased by 30,675,766 people (a 13.1% growth), while Venezuela gained 3,541,034 people (a 13% growth).
For the next 10 years, from 2016 to 2026, Indonesia gained 24,400,241 people (a 9.22% growth), while Venezuela's population decreased by 2,073,285 people (a 6.74% decline).
Indonesia was ranked 4th most populous country in 2006 and is still 4th in 2026. Venezuela was ranked 41st in 2006 and ranked 54th now.
The UN's World Population Prospects forecasts that in 24 years (in 2050) Indonesia's population will grow by 11.3% to 321,699,802 people with a rank change from 4th to 6th. The population of Venezuela will increase by 8.53% to 31,139,557 people and rank change from 54th to 62nd.
Indonesia is projected to reach its peak in 2059 at 324M people compared to the peak of 31.3M people in 2057 for Venezuela.
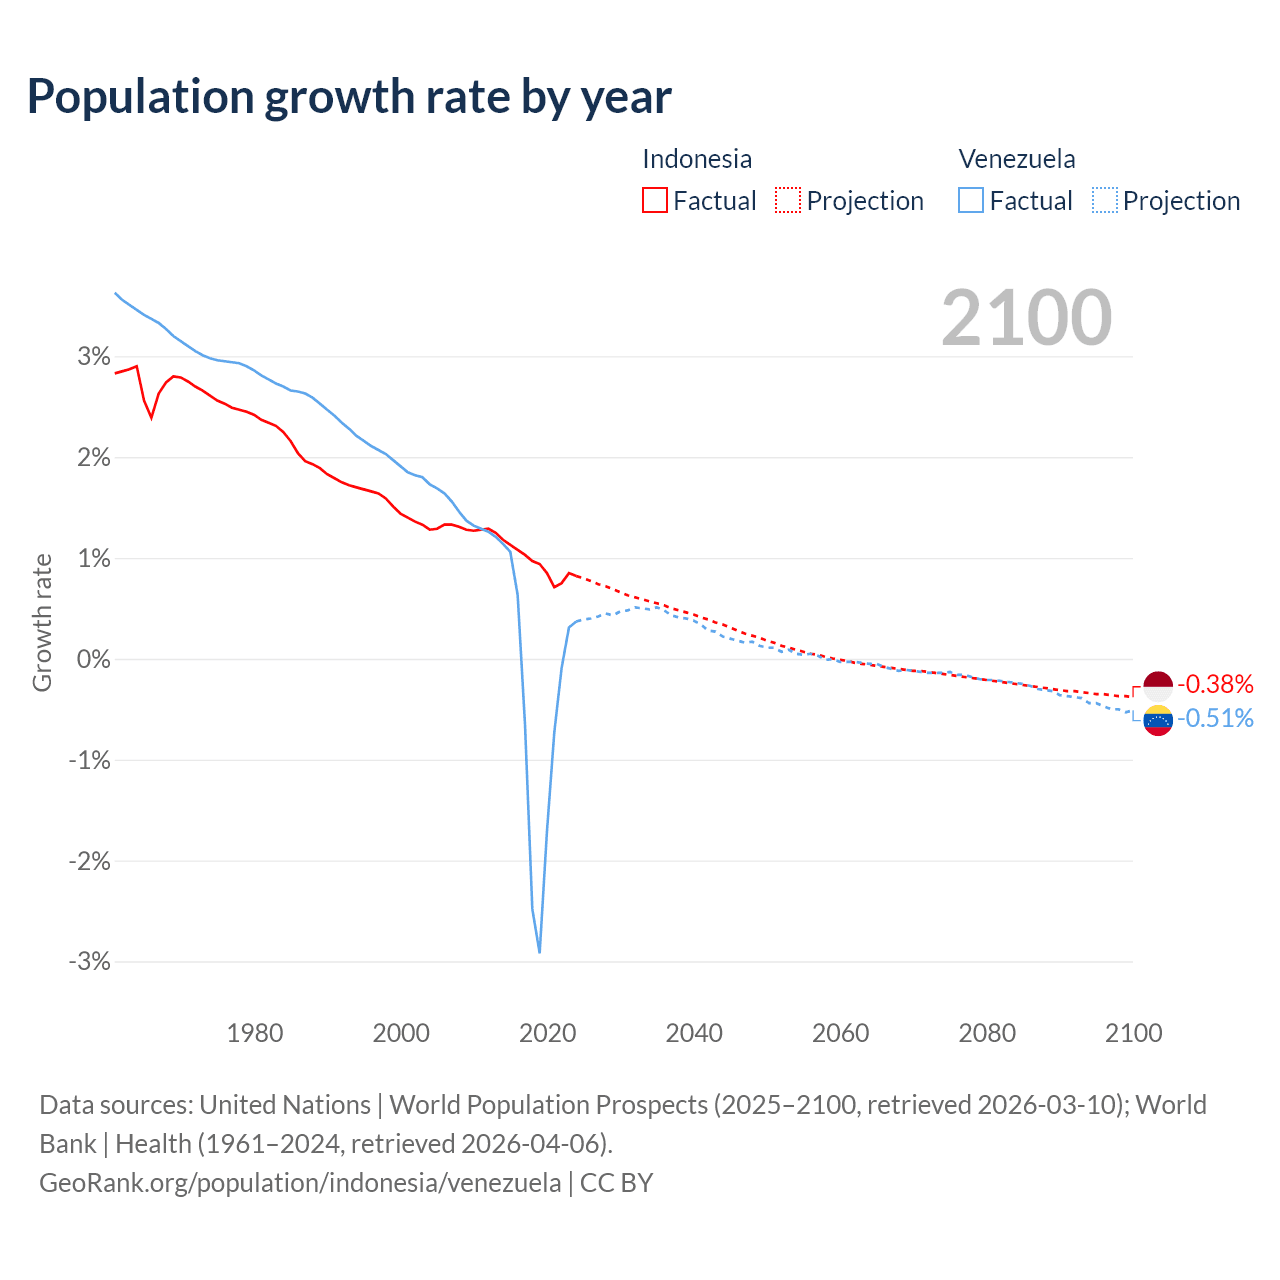
Population growth rate by year
| Year | Growth rate | |
|---|---|---|
|
Indonesia
|
Venezuela
|
|
| 2100 | -0.38% | -0.51% |
| 2099 | -0.37% | -0.53% |
| 2098 | -0.37% | -0.5% |
| 2097 | -0.36% | -0.5% |
| 2096 | -0.35% | -0.47% |
| 2095 | -0.35% | -0.44% |
| 2094 | -0.34% | -0.44% |
| 2093 | -0.33% | -0.39% |
| 2092 | -0.32% | -0.38% |
| 2091 | -0.32% | -0.37% |
| 2090 | -0.31% | -0.36% |
| 2089 | -0.3% | -0.32% |
| 2088 | -0.29% | -0.31% |
| 2087 | -0.28% | -0.3% |
| 2086 | -0.27% | -0.27% |
| 2085 | -0.26% | -0.25% |
| 2084 | -0.25% | -0.24% |
| 2083 | -0.24% | -0.23% |
| 2082 | -0.23% | -0.22% |
| 2081 | -0.22% | -0.21% |
| 2080 | -0.21% | -0.21% |
| 2079 | -0.2% | -0.2% |
| 2078 | -0.19% | -0.18% |
| 2077 | -0.18% | -0.16% |
| 2076 | -0.17% | -0.16% |
| 2075 | -0.16% | -0.13% |
| 2074 | -0.15% | -0.14% |
| 2073 | -0.14% | -0.14% |
| 2072 | -0.13% | -0.14% |
| 2071 | -0.12% | -0.13% |
| 2070 | -0.12% | -0.12% |
| 2069 | -0.11% | -0.11% |
| 2068 | -0.1% | -0.12% |
| 2067 | -0.09% | -0.1% |
| 2066 | -0.08% | -0.08% |
| 2065 | -0.07% | -0.05% |
| 2064 | -0.06% | -0.05% |
| 2063 | -0.05% | -0.04% |
| 2062 | -0.04% | -0.03% |
| 2061 | -0.02% | -0.03% |
| 2060 | -0.01% | -0.03% |
| 2059 | 0.003% | -0.004% |
| 2058 | 0.02% | -0.01% |
| 2057 | 0.04% | 0.03% |
| 2056 | 0.05% | 0.05% |
| 2055 | 0.07% | 0.04% |
| 2054 | 0.09% | 0.05% |
| 2053 | 0.11% | 0.09% |
| 2052 | 0.13% | 0.07% |
| 2051 | 0.16% | 0.11% |
| 2050 | 0.18% | 0.11% |
| 2049 | 0.21% | 0.13% |
| 2048 | 0.23% | 0.17% |
| 2047 | 0.25% | 0.16% |
| 2046 | 0.28% | 0.18% |
| 2045 | 0.31% | 0.2% |
| 2044 | 0.34% | 0.22% |
| 2043 | 0.36% | 0.27% |
| 2042 | 0.39% | 0.28% |
| 2041 | 0.41% | 0.34% |
| 2040 | 0.44% | 0.38% |
| 2039 | 0.46% | 0.4% |
| 2038 | 0.48% | 0.41% |
| 2037 | 0.5% | 0.43% |
| 2036 | 0.53% | 0.48% |
| 2035 | 0.55% | 0.51% |
| 2034 | 0.57% | 0.49% |
| 2033 | 0.59% | 0.5% |
| 2032 | 0.61% | 0.51% |
| 2031 | 0.63% | 0.48% |
| 2030 | 0.66% | 0.47% |
| 2029 | 0.69% | 0.43% |
| 2028 | 0.72% | 0.45% |
| 2027 | 0.74% | 0.42% |
| 2026 | 0.77% | 0.4% |
| 2025 | 0.79% | 0.39% |
| 2024 | 0.82% | 0.37% |
| 2023 | 0.85% | 0.31% |
| 2022 | 0.75% | -0.09% |
| 2021 | 0.71% | -0.73% |
| 2020 | 0.85% | -1.71% |
| 2019 | 0.94% | -2.92% |
| 2018 | 0.97% | -2.48% |
| 2017 | 1.03% | -0.65% |
| 2016 | 1.08% | 0.63% |
| 2015 | 1.13% | 1.06% |
| 2014 | 1.18% | 1.14% |
| 2013 | 1.25% | 1.21% |
| 2012 | 1.29% | 1.26% |
| 2011 | 1.28% | 1.29% |
| 2010 | 1.27% | 1.32% |
| 2009 | 1.28% | 1.37% |
| 2008 | 1.31% | 1.46% |
| 2007 | 1.33% | 1.56% |
| 2006 | 1.33% | 1.64% |
| 2005 | 1.29% | 1.69% |
| 2004 | 1.28% | 1.73% |
| 2003 | 1.33% | 1.8% |
| 2002 | 1.36% | 1.82% |
| 2001 | 1.4% | 1.85% |
| 2000 | 1.44% | 1.91% |
| 1999 | 1.51% | 1.97% |
| 1998 | 1.59% | 2.03% |
| 1997 | 1.64% | 2.07% |
| 1996 | 1.66% | 2.11% |
| 1995 | 1.68% | 2.16% |
| 1994 | 1.7% | 2.21% |
| 1993 | 1.72% | 2.28% |
| 1992 | 1.75% | 2.34% |
| 1991 | 1.79% | 2.41% |
| 1990 | 1.83% | 2.47% |
| 1989 | 1.89% | 2.53% |
| 1988 | 1.93% | 2.59% |
| 1987 | 1.96% | 2.63% |
| 1986 | 2.04% | 2.65% |
| 1985 | 2.16% | 2.66% |
| 1984 | 2.25% | 2.7% |
| 1983 | 2.31% | 2.73% |
| 1982 | 2.34% | 2.77% |
| 1981 | 2.37% | 2.81% |
| 1980 | 2.42% | 2.86% |
| 1979 | 2.45% | 2.9% |
| 1978 | 2.47% | 2.93% |
| 1977 | 2.49% | 2.94% |
| 1976 | 2.53% | 2.95% |
| 1975 | 2.56% | 2.96% |
| 1974 | 2.61% | 2.98% |
| 1973 | 2.66% | 3.01% |
| 1972 | 2.7% | 3.05% |
| 1971 | 2.75% | 3.1% |
| 1970 | 2.79% | 3.15% |
| 1969 | 2.8% | 3.2% |
| 1968 | 2.74% | 3.27% |
| 1967 | 2.63% | 3.33% |
| 1966 | 2.39% | 3.37% |
| 1965 | 2.56% | 3.41% |
| 1964 | 2.9% | 3.46% |
| 1963 | 2.87% | 3.51% |
| 1962 | 2.85% | 3.56% |
| 1961 | 2.83% | 3.63% |
Data sources: United Nations | World Population Prospects (2026–2100, retrieved 2026-07-08); World Bank | Health (1961–2025, retrieved 2026-07-08).
GeoRank.org/population/indonesia/venezuela | CC BY
In 2025, the population of Indonesia grew by 0.79%, while Venezuela's population grew by 0.39%.
Live population counters
|
Indonesia
|
Venezuela
|
|
|---|---|---|
| Current population |
289027659
|
28692435
|
| Population rank | 4/197 | 54/197 |
| Percent of world population | 3.48% | 0.35% |
| One net population change |
14.2 seconds
|
4.73 minutes
|
| One birth every |
7.06 seconds
|
1.21 minutes
|
| One death every |
14.6 seconds
|
2.41 minutes
|
| Daily growth/decline | +6,119 | +305 |
| Annual growth/decline | +2,233,305 | +111,353 |
| Annual growth/decline rate | +0.79% | +0.39% |
| Population growth rate rank | 112/197 | 139/197 |
| One migration net change every |
13.3 minutes
|
5.25 minutes
|
| Annual migration change | -39,509 | -100,467 |
| Net migration rank | 171/196 | 180/196 |
| Foreign-born residents | 445,726 | 1,263,304 |
| Foreign-born residents rank | 86/195 | 51/195 |
| Foreign-born share of population | 0.2% | 4.4% |
| Foreign-born share rank | 188/195 | 101/195 |
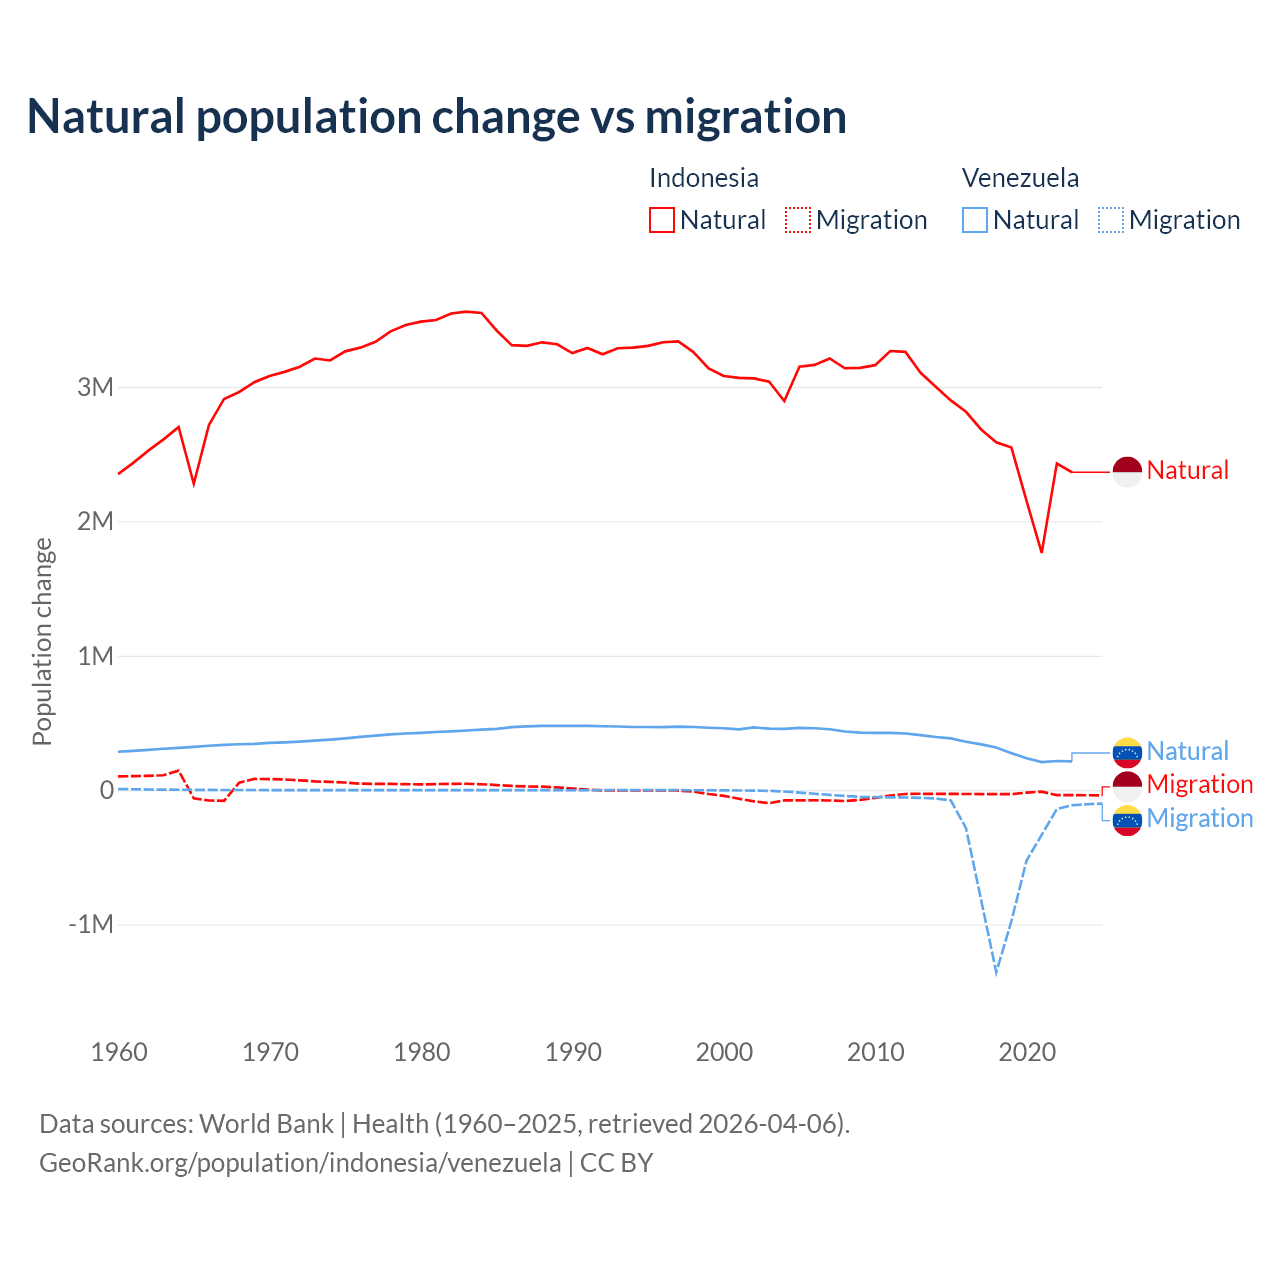
Natural population change vs migration
| Year | Population change | |||
|---|---|---|---|---|
|
Indonesia
|
Venezuela
|
|||
| Natural | Migration | Natural | Migration | |
| 2025 | - | -39,509 | - | -100,467 |
| 2024 | 2,307,025 | -38,469 | 214,547 | -105,297 |
| 2023 | 2,364,808 | -37,501 | 213,020 | -112,899 |
| 2022 | 2,429,171 | -37,501 | 216,619 | -141,107 |
| 2021 | 1,764,332 | -11,248 | 207,746 | -332,936 |
| 2020 | 2,152,076 | -18,743 | 237,223 | -524,649 |
| 2019 | 2,548,048 | -30,421 | 274,826 | -975,534 |
| 2018 | 2,587,219 | -29,911 | 317,302 | -1,355,602 |
| 2017 | 2,682,556 | -29,467 | 340,222 | -817,376 |
| 2016 | 2,814,578 | -28,991 | 359,651 | -283,270 |
| 2015 | 2,899,165 | -28,487 | 384,560 | -77,417 |
| 2014 | 3,000,907 | -27,988 | 395,088 | -62,437 |
| 2013 | 3,104,258 | -27,507 | 408,930 | -57,818 |
| 2012 | 3,259,811 | -28,869 | 420,758 | -55,131 |
| 2011 | 3,266,560 | -40,543 | 425,958 | -54,384 |
| 2010 | 3,161,082 | -57,752 | 425,397 | -52,781 |
| 2009 | 3,140,944 | -73,655 | 427,257 | -50,286 |
| 2008 | 3,138,143 | -81,364 | 435,870 | -43,636 |
| 2007 | 3,211,484 | -77,338 | 452,482 | -36,060 |
| 2006 | 3,163,026 | -75,829 | 460,152 | -27,240 |
| 2005 | 3,149,551 | -76,784 | 463,260 | -18,407 |
| 2004 | 2,894,440 | -77,002 | 455,881 | -10,798 |
| 2003 | 3,037,698 | -97,732 | 456,902 | -5,729 |
| 2002 | 3,063,044 | -83,985 | 466,821 | -3,944 |
| 2001 | 3,066,275 | -64,255 | 451,487 | -2,856 |
| 2000 | 3,080,621 | -42,697 | 459,802 | -1,999 |
| 1999 | 3,137,133 | -28,799 | 463,787 | -1,376 |
| 1998 | 3,258,820 | -11,356 | 469,123 | -1,010 |
| 1997 | 3,338,243 | -4,334 | 472,002 | -816 |
| 1996 | 3,331,535 | -1,854 | 468,653 | -708 |
| 1995 | 3,304,550 | -1,643 | 469,267 | -622 |
| 1994 | 3,292,127 | -2,575 | 469,178 | -559 |
| 1993 | 3,287,348 | -3,485 | 473,189 | -477 |
| 1992 | 3,241,576 | -2,609 | 474,824 | -381 |
| 1991 | 3,288,791 | 3,096 | 477,917 | -236 |
| 1990 | 3,250,906 | 11,539 | 478,168 | -69 |
| 1989 | 3,316,792 | 19,905 | 478,053 | 32 |
| 1988 | 3,331,242 | 25,383 | 477,569 | 137 |
| 1987 | 3,304,520 | 26,705 | 474,204 | 182 |
| 1986 | 3,309,905 | 30,988 | 468,252 | 201 |
| 1985 | 3,419,412 | 37,451 | 455,517 | 237 |
| 1984 | 3,549,570 | 43,693 | 449,186 | 247 |
| 1983 | 3,558,949 | 47,375 | 443,569 | 260 |
| 1982 | 3,545,504 | 46,792 | 436,564 | 260 |
| 1981 | 3,497,244 | 44,710 | 432,059 | 251 |
| 1980 | 3,484,846 | 42,254 | 425,613 | 237 |
| 1979 | 3,460,621 | 43,900 | 421,256 | 228 |
| 1978 | 3,412,980 | 45,911 | 414,032 | 205 |
| 1977 | 3,334,779 | 45,610 | 405,315 | 196 |
| 1976 | 3,291,479 | 48,010 | 395,344 | 190 |
| 1975 | 3,263,794 | 56,386 | 385,045 | 186 |
| 1974 | 3,196,136 | 61,188 | 375,678 | 173 |
| 1973 | 3,210,643 | 64,991 | 367,612 | 171 |
| 1972 | 3,149,726 | 72,007 | 360,749 | 173 |
| 1971 | 3,111,304 | 79,264 | 355,212 | 215 |
| 1970 | 3,080,421 | 81,368 | 350,709 | 305 |
| 1969 | 3,034,825 | 82,955 | 343,596 | 403 |
| 1968 | 2,961,608 | 55,731 | 340,973 | 532 |
| 1967 | 2,909,981 | -80,138 | 335,813 | 717 |
| 1966 | 2,715,011 | -77,645 | 329,697 | 1,087 |
| 1965 | 2,278,891 | -61,145 | 321,695 | 1,656 |
| 1964 | 2,700,138 | 144,819 | 314,397 | 2,410 |
| 1963 | 2,609,526 | 110,166 | 307,279 | 3,296 |
| 1962 | 2,525,163 | 106,264 | 299,345 | 4,386 |
| 1961 | 2,434,113 | 103,628 | 292,109 | 6,069 |
| 1960 | 2,350,971 | 101,631 | 285,105 | 8,369 |
Data sources: World Bank | Health (1960–2025, retrieved 2026-07-08).
GeoRank.org/population/indonesia/venezuela | CC BY
Over the last 10 years, 98.8% of the population change in Indonesia is from natural causes (a gain of 24,548,978 people) and 1.17% is from migration (a loss of 290,739 people). In Venezuela 36.9% is from natural causes (a gain of 2,765,716 people) and 63.1% is from migration (a loss of 4,726,087 people).
As of 2024, 445,726 residents or 0.2% of the population were not native-born in Indonesia, compared to 1,263,304 people or 4.4% in Venezuela.
Biggest cities by population
|
Indonesia
|
|
|---|---|
| City | Population |
| Jakarta | 11.1M |
| Bali | 4.36M |
| Surabaya | 3.01M |
| Bandung | 2.88M |
| Bekasi | 2.38M |
| Depok | 2.33M |
| Tangerang | 2.24M |
| Medan | 2.11M |
| South Tangerang | 1.64M |
| Semarang | 1.62M |
|
Venezuela
|
|
|---|---|
| City | Population |
| Caracas | 2.25M |
| Maracaibo | 1.55M |
| Valencia | 1.48M |
| Maracay | 1.1M |
| Barquisimeto | 1.06M |
| Barinas | 874K |
| Maturin | 753K |
| Ciudad Guayana | 751K |
| Catia La Mar | 662K |
| Ciudad Bolivar | 568K |
Compare countries by 7 more topics
Population differences between Indonesia and Venezuela
|
Indonesia
|
Venezuela
|
|
|---|---|---|
| Life expectancy | 71.6 years | 73 years |
| Average age | 33.1 years | 33.6 years |
| Median age | 31.4 years | 30.4 years |
| Male:Female ratio | 50.2:49.8 | 49.4:50.6 |
| Fertility rate | 2.12 births per woman | 2.08 births per woman |
| Population density | 394 ppl/mi² | 84.1 ppl/mi² |
Population map with other countries
Data sources: World Bank | Health (1960–2025, retrieved 2026-07-08); United Nations | World Population Prospects (1960–2026, retrieved 2026-07-08); U.S. Census Bureau (1960–2025, retrieved 2026-07-08); Central Intelligence Agency (CIA) (2000–2019, retrieved 2026-07-08).
GeoRank.org/population/indonesia/venezuela | CC BY
Help us show the world through your eyes
Share a photo of your city and help others discover what it looks like to live there. Your contribution makes our data come alive.
Data sources:
- World Bank | Health (1960–2025, retrieved 2026-07-08)
- United Nations | World Population Prospects (1960–2100, retrieved 2026-07-08)
- U.S. Census Bureau (1960–2025, retrieved 2026-07-08)
- Wikidata (2026, retrieved 2026-07-08)
- Central Intelligence Agency (CIA) (2000–2019, retrieved 2026-07-08)
Creative Commons Attribution (CC BY) — you’re free to copy, share, remix, adapt, and use even commercially as long as you give appropriate credit and clearly indicate if you made changes. Other sources may be subject to different license terms.