The latest officially reported population of Denmark was 6,009,169 in 2025 vs 1,243,741 people in Mauritius in 2025. In 2026, based on the adjusted UN estimation, the current Denmark's population is 6,042,125 people compared to 1,240,721 in Mauritius.
Population statistics:
- Denmark's population is 4.87 times bigger than Mauritius'.
- Denmark is ranked the 114th most populous country in the world, while Mauritius is the 157th.
- The countries together account for 0.09% of the world: 0.07% for Denmark vs 0.01% for Mauritius.
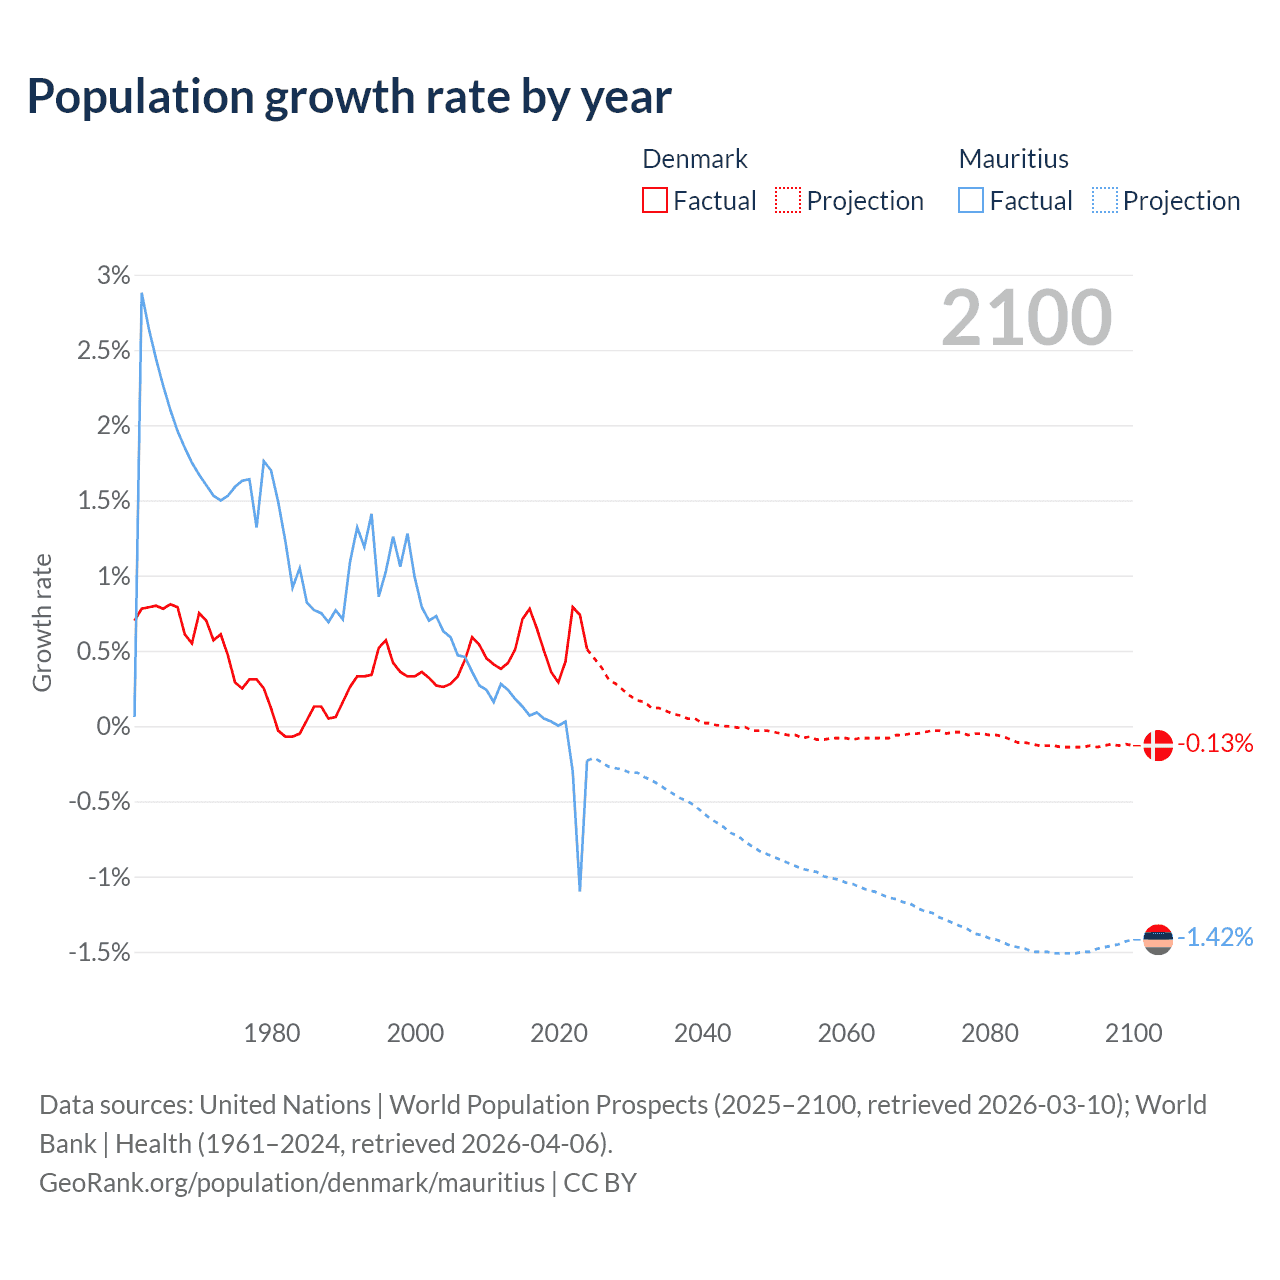
- For the last 10 years, Denmark has had an average growth rate of +0.57% per year vs -0.13% in Mauritius.
- Since 2006, the population of Denmark has increased from 5.44M people to 6.04M (11.1% growth), while Mauritius has grown from 1.23M to 1.24M (0.54% growth).
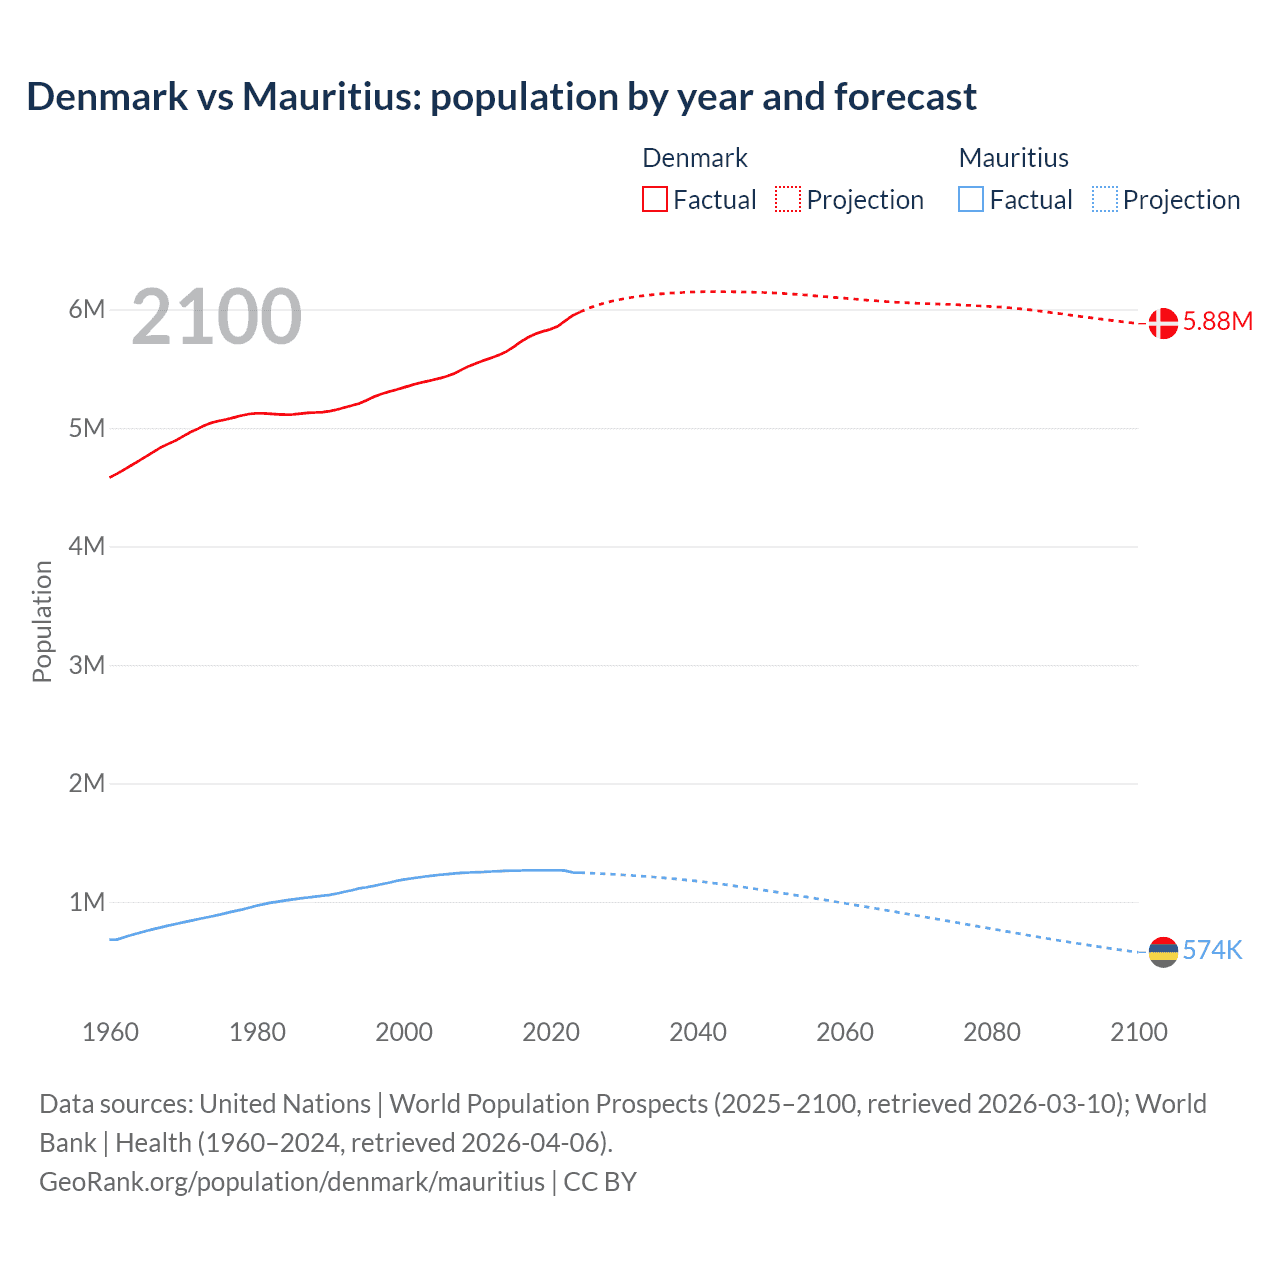
Denmark vs Mauritius: population by year and forecast
| Year | Population | |
|---|---|---|
 Denmark
|
 Mauritius
|
|
| 2100 | 5,884,686 | 573,815 |
| 2099 | 5,892,325 | 582,097 |
| 2098 | 5,899,695 | 590,562 |
| 2097 | 5,907,465 | 599,251 |
| 2096 | 5,914,749 | 608,134 |
| 2095 | 5,922,245 | 617,230 |
| 2094 | 5,930,321 | 626,529 |
| 2093 | 5,938,280 | 636,052 |
| 2092 | 5,946,384 | 645,739 |
| 2091 | 5,954,679 | 655,617 |
| 2090 | 5,963,266 | 665,663 |
| 2089 | 5,971,713 | 675,889 |
| 2088 | 5,979,364 | 686,240 |
| 2087 | 5,987,402 | 696,717 |
| 2086 | 5,995,064 | 707,360 |
| 2085 | 6,002,549 | 718,105 |
| 2084 | 6,009,275 | 728,910 |
| 2083 | 6,015,700 | 739,778 |
| 2082 | 6,021,123 | 750,765 |
| 2081 | 6,025,161 | 761,750 |
| 2080 | 6,029,023 | 772,748 |
| 2079 | 6,032,690 | 783,786 |
| 2078 | 6,035,675 | 794,837 |
| 2077 | 6,038,686 | 805,918 |
| 2076 | 6,042,135 | 816,942 |
| 2075 | 6,044,653 | 827,927 |
| 2074 | 6,047,076 | 838,911 |
| 2073 | 6,049,937 | 849,873 |
| 2072 | 6,051,777 | 860,821 |
| 2071 | 6,053,762 | 871,644 |
| 2070 | 6,056,217 | 882,518 |
| 2069 | 6,059,011 | 893,282 |
| 2068 | 6,062,068 | 903,984 |
| 2067 | 6,065,624 | 914,668 |
| 2066 | 6,069,342 | 925,317 |
| 2065 | 6,074,204 | 935,999 |
| 2064 | 6,079,063 | 946,603 |
| 2063 | 6,083,788 | 957,115 |
| 2062 | 6,088,960 | 967,627 |
| 2061 | 6,093,987 | 978,076 |
| 2060 | 6,099,487 | 988,500 |
| 2059 | 6,104,417 | 998,838 |
| 2058 | 6,109,049 | 1,009,091 |
| 2057 | 6,114,183 | 1,019,346 |
| 2056 | 6,119,717 | 1,029,601 |
| 2055 | 6,125,235 | 1,039,730 |
| 2054 | 6,129,783 | 1,049,821 |
| 2053 | 6,134,472 | 1,059,876 |
| 2052 | 6,138,153 | 1,069,793 |
| 2051 | 6,141,878 | 1,079,612 |
| 2050 | 6,145,108 | 1,089,300 |
| 2049 | 6,147,694 | 1,098,902 |
| 2048 | 6,149,633 | 1,108,341 |
| 2047 | 6,151,452 | 1,117,590 |
| 2046 | 6,153,140 | 1,126,567 |
| 2045 | 6,153,542 | 1,135,321 |
| 2044 | 6,154,289 | 1,143,708 |
| 2043 | 6,154,449 | 1,151,882 |
| 2042 | 6,154,439 | 1,159,639 |
| 2041 | 6,154,049 | 1,167,107 |
| 2040 | 6,152,639 | 1,174,241 |
| 2039 | 6,151,105 | 1,181,008 |
| 2038 | 6,147,975 | 1,187,347 |
| 2037 | 6,145,003 | 1,193,347 |
| 2036 | 6,140,920 | 1,199,055 |
| 2035 | 6,135,972 | 1,204,453 |
| 2034 | 6,129,715 | 1,209,521 |
| 2033 | 6,122,663 | 1,214,292 |
| 2032 | 6,115,251 | 1,218,727 |
| 2031 | 6,105,748 | 1,222,858 |
| 2030 | 6,095,292 | 1,226,642 |
| 2029 | 6,082,914 | 1,230,401 |
| 2028 | 6,068,364 | 1,234,008 |
| 2027 | 6,051,324 | 1,237,431 |
| 2026 | 6,032,411 | 1,240,721 |
| 2025 | 6,009,169 | 1,243,741 |
| 2024 | 5,976,992 | 1,245,779 |
| 2023 | 5,946,952 | 1,248,647 |
| 2022 | 5,903,037 | 1,262,523 |
| 2021 | 5,856,733 | 1,266,334 |
| 2020 | 5,831,404 | 1,266,014 |
| 2019 | 5,814,422 | 1,265,985 |
| 2018 | 5,793,636 | 1,265,577 |
| 2017 | 5,764,980 | 1,264,887 |
| 2016 | 5,728,010 | 1,263,747 |
| 2015 | 5,683,483 | 1,262,879 |
| 2014 | 5,643,475 | 1,261,208 |
| 2013 | 5,614,932 | 1,258,927 |
| 2012 | 5,591,572 | 1,255,882 |
| 2011 | 5,570,572 | 1,252,404 |
| 2010 | 5,547,683 | 1,250,400 |
| 2009 | 5,523,095 | 1,247,429 |
| 2008 | 5,493,621 | 1,244,121 |
| 2007 | 5,461,438 | 1,239,630 |
| 2006 | 5,437,272 | 1,233,996 |
| 2005 | 5,419,432 | 1,228,254 |
| 2004 | 5,404,523 | 1,221,003 |
| 2003 | 5,390,574 | 1,213,370 |
| 2002 | 5,375,931 | 1,204,621 |
| 2001 | 5,358,783 | 1,196,287 |
| 2000 | 5,339,616 | 1,186,873 |
| 1999 | 5,321,799 | 1,175,267 |
| 1998 | 5,304,219 | 1,160,421 |
| 1997 | 5,284,991 | 1,148,284 |
| 1996 | 5,263,074 | 1,133,996 |
| 1995 | 5,233,373 | 1,122,457 |
| 1994 | 5,206,180 | 1,112,846 |
| 1993 | 5,188,628 | 1,097,374 |
| 1992 | 5,171,370 | 1,084,441 |
| 1991 | 5,154,298 | 1,070,266 |
| 1990 | 5,140,939 | 1,058,775 |
| 1989 | 5,132,594 | 1,051,260 |
| 1988 | 5,129,516 | 1,043,239 |
| 1987 | 5,127,024 | 1,036,082 |
| 1986 | 5,120,534 | 1,028,360 |
| 1985 | 5,113,691 | 1,020,528 |
| 1984 | 5,111,619 | 1,012,221 |
| 1983 | 5,114,297 | 1,001,691 |
| 1982 | 5,117,810 | 992,521 |
| 1981 | 5,121,572 | 980,462 |
| 1980 | 5,123,027 | 966,039 |
| 1979 | 5,116,801 | 949,888 |
| 1978 | 5,104,248 | 933,499 |
| 1977 | 5,088,419 | 921,379 |
| 1976 | 5,072,596 | 906,507 |
| 1975 | 5,059,862 | 892,000 |
| 1974 | 5,045,297 | 878,042 |
| 1973 | 5,021,861 | 864,819 |
| 1972 | 4,991,596 | 852,053 |
| 1971 | 4,963,126 | 839,230 |
| 1970 | 4,928,757 | 826,000 |
| 1969 | 4,891,860 | 812,405 |
| 1968 | 4,864,883 | 798,413 |
| 1967 | 4,835,354 | 783,917 |
| 1966 | 4,797,381 | 768,813 |
| 1965 | 4,759,012 | 753,000 |
| 1964 | 4,722,072 | 736,381 |
| 1963 | 4,684,483 | 718,861 |
| 1962 | 4,647,727 | 700,349 |
| 1961 | 4,611,687 | 680,757 |
| 1960 | 4,579,603 | 680,331 |
Data sources: United Nations | World Population Prospects (2026–2100, retrieved 2026-07-08); World Bank | Health (1960–2025, retrieved 2026-07-08).
GeoRank.org/population/denmark/mauritius | CC BY 
From 2006 to 2016, the population of Denmark increased by 290,738 people (a 5.35% growth), while Mauritius gained 29,751 people (a 2.41% growth).
For the next 10 years, from 2016 to 2026, Denmark gained 314,115 people (a 5.48% growth), while Mauritius' population decreased by 23,026 people (a 1.82% decline).
Denmark was ranked 108th most populous country in 2006 and is 114th in 2026. Mauritius was ranked 151st in 2006 and ranked 157th now.
The UN's World Population Prospects forecasts that in 24 years (in 2050) Denmark's population will grow by 1.7% to 6,145,108 people with a rank change from 114th to 120th. The population of Mauritius will decrease by 12.2% to 1,089,300 people and rank change from 157th to 160th.
Denmark is projected to reach its peak in 2043 at 6.15M people, while Mauritius' population already peaked in 2021 at 1.27M people and is projected to decrease to 574K people by 2100.
Population growth rate by year
| Year | Growth rate | |
|---|---|---|
|
Denmark
|
Mauritius
|
|
| 2100 | -0.13% | -1.42% |
| 2099 | -0.12% | -1.43% |
| 2098 | -0.13% | -1.45% |
| 2097 | -0.12% | -1.46% |
| 2096 | -0.13% | -1.47% |
| 2095 | -0.14% | -1.48% |
| 2094 | -0.13% | -1.5% |
| 2093 | -0.14% | -1.5% |
| 2092 | -0.14% | -1.51% |
| 2091 | -0.14% | -1.51% |
| 2090 | -0.14% | -1.51% |
| 2089 | -0.13% | -1.51% |
| 2088 | -0.13% | -1.5% |
| 2087 | -0.13% | -1.5% |
| 2086 | -0.12% | -1.5% |
| 2085 | -0.11% | -1.48% |
| 2084 | -0.11% | -1.47% |
| 2083 | -0.09% | -1.46% |
| 2082 | -0.07% | -1.44% |
| 2081 | -0.06% | -1.42% |
| 2080 | -0.06% | -1.41% |
| 2079 | -0.05% | -1.39% |
| 2078 | -0.05% | -1.38% |
| 2077 | -0.06% | -1.35% |
| 2076 | -0.04% | -1.33% |
| 2075 | -0.04% | -1.31% |
| 2074 | -0.05% | -1.29% |
| 2073 | -0.03% | -1.27% |
| 2072 | -0.03% | -1.24% |
| 2071 | -0.04% | -1.23% |
| 2070 | -0.05% | -1.21% |
| 2069 | -0.05% | -1.18% |
| 2068 | -0.06% | -1.17% |
| 2067 | -0.06% | -1.15% |
| 2066 | -0.08% | -1.14% |
| 2065 | -0.08% | -1.12% |
| 2064 | -0.08% | -1.1% |
| 2063 | -0.08% | -1.09% |
| 2062 | -0.08% | -1.07% |
| 2061 | -0.09% | -1.05% |
| 2060 | -0.08% | -1.04% |
| 2059 | -0.08% | -1.02% |
| 2058 | -0.08% | -1.01% |
| 2057 | -0.09% | -1% |
| 2056 | -0.09% | -0.97% |
| 2055 | -0.07% | -0.96% |
| 2054 | -0.08% | -0.95% |
| 2053 | -0.06% | -0.93% |
| 2052 | -0.06% | -0.91% |
| 2051 | -0.05% | -0.89% |
| 2050 | -0.04% | -0.87% |
| 2049 | -0.03% | -0.85% |
| 2048 | -0.03% | -0.83% |
| 2047 | -0.03% | -0.8% |
| 2046 | -0.007% | -0.77% |
| 2045 | -0.01% | -0.73% |
| 2044 | -0.003% | -0.71% |
| 2043 | 0% | -0.67% |
| 2042 | 0.006% | -0.64% |
| 2041 | 0.02% | -0.61% |
| 2040 | 0.02% | -0.57% |
| 2039 | 0.05% | -0.53% |
| 2038 | 0.05% | -0.5% |
| 2037 | 0.07% | -0.48% |
| 2036 | 0.08% | -0.45% |
| 2035 | 0.1% | -0.42% |
| 2034 | 0.12% | -0.39% |
| 2033 | 0.12% | -0.36% |
| 2032 | 0.16% | -0.34% |
| 2031 | 0.17% | -0.31% |
| 2030 | 0.2% | -0.31% |
| 2029 | 0.24% | -0.29% |
| 2028 | 0.28% | -0.28% |
| 2027 | 0.31% | -0.27% |
| 2026 | 0.39% | -0.24% |
| 2025 | 0.54% | -0.16% |
| 2024 | 0.51% | -0.23% |
| 2023 | 0.74% | -1.1% |
| 2022 | 0.79% | -0.3% |
| 2021 | 0.43% | 0.03% |
| 2020 | 0.29% | 0.002% |
| 2019 | 0.36% | 0.03% |
| 2018 | 0.5% | 0.05% |
| 2017 | 0.65% | 0.09% |
| 2016 | 0.78% | 0.07% |
| 2015 | 0.71% | 0.13% |
| 2014 | 0.51% | 0.18% |
| 2013 | 0.42% | 0.24% |
| 2012 | 0.38% | 0.28% |
| 2011 | 0.41% | 0.16% |
| 2010 | 0.45% | 0.24% |
| 2009 | 0.54% | 0.27% |
| 2008 | 0.59% | 0.36% |
| 2007 | 0.44% | 0.46% |
| 2006 | 0.33% | 0.47% |
| 2005 | 0.28% | 0.59% |
| 2004 | 0.26% | 0.63% |
| 2003 | 0.27% | 0.73% |
| 2002 | 0.32% | 0.7% |
| 2001 | 0.36% | 0.79% |
| 2000 | 0.33% | 0.99% |
| 1999 | 0.33% | 1.28% |
| 1998 | 0.36% | 1.06% |
| 1997 | 0.42% | 1.26% |
| 1996 | 0.57% | 1.03% |
| 1995 | 0.52% | 0.86% |
| 1994 | 0.34% | 1.41% |
| 1993 | 0.33% | 1.19% |
| 1992 | 0.33% | 1.32% |
| 1991 | 0.26% | 1.09% |
| 1990 | 0.16% | 0.71% |
| 1989 | 0.06% | 0.77% |
| 1988 | 0.05% | 0.69% |
| 1987 | 0.13% | 0.75% |
| 1986 | 0.13% | 0.77% |
| 1985 | 0.04% | 0.82% |
| 1984 | -0.05% | 1.05% |
| 1983 | -0.07% | 0.92% |
| 1982 | -0.07% | 1.23% |
| 1981 | -0.03% | 1.49% |
| 1980 | 0.12% | 1.7% |
| 1979 | 0.25% | 1.76% |
| 1978 | 0.31% | 1.32% |
| 1977 | 0.31% | 1.64% |
| 1976 | 0.25% | 1.63% |
| 1975 | 0.29% | 1.59% |
| 1974 | 0.47% | 1.53% |
| 1973 | 0.61% | 1.5% |
| 1972 | 0.57% | 1.53% |
| 1971 | 0.7% | 1.6% |
| 1970 | 0.75% | 1.67% |
| 1969 | 0.55% | 1.75% |
| 1968 | 0.61% | 1.85% |
| 1967 | 0.79% | 1.96% |
| 1966 | 0.81% | 2.1% |
| 1965 | 0.78% | 2.26% |
| 1964 | 0.8% | 2.44% |
| 1963 | 0.79% | 2.64% |
| 1962 | 0.78% | 2.88% |
| 1961 | 0.7% | 0.06% |
Data sources: United Nations | World Population Prospects (2026–2100, retrieved 2026-07-08); World Bank | Health (1961–2025, retrieved 2026-07-08).
GeoRank.org/population/denmark/mauritius | CC BY
In 2025, the population of Denmark grew by 0.54%, while Mauritius' population declined by 0.16%.
Live population counters
|
Denmark
|
Mauritius
|
|
|---|---|---|
| Current population |
6042125
|
1240721
|
| Population rank | 114/197 | 157/197 |
| Percent of world population | 0.07% | 0.01% |
| One net population change |
16.4 minutes
|
4.31 hours
|
| One birth every |
9.26 minutes
|
41 minutes
|
| One death every |
9.26 minutes
|
42.2 minutes
|
| Daily growth/decline | +88 | -6 |
| Annual growth/decline | +32,177 | -2,038 |
| Annual growth/decline rate | +0.54% | -0.16% |
| Population growth rate rank | 126/197 | 171/197 |
| One migration net change every |
23.8 minutes
|
3.16 hours
|
| Annual migration change | +22,103 | -2,784 |
| Net migration rank | 32/196 | 103/196 |
| Foreign-born residents | 847,475 | 29,142 |
| Foreign-born residents rank | 65/195 | 165/195 |
| Foreign-born share of population | 14.2% | 2.3% |
| Foreign-born share rank | 46/195 | 129/195 |
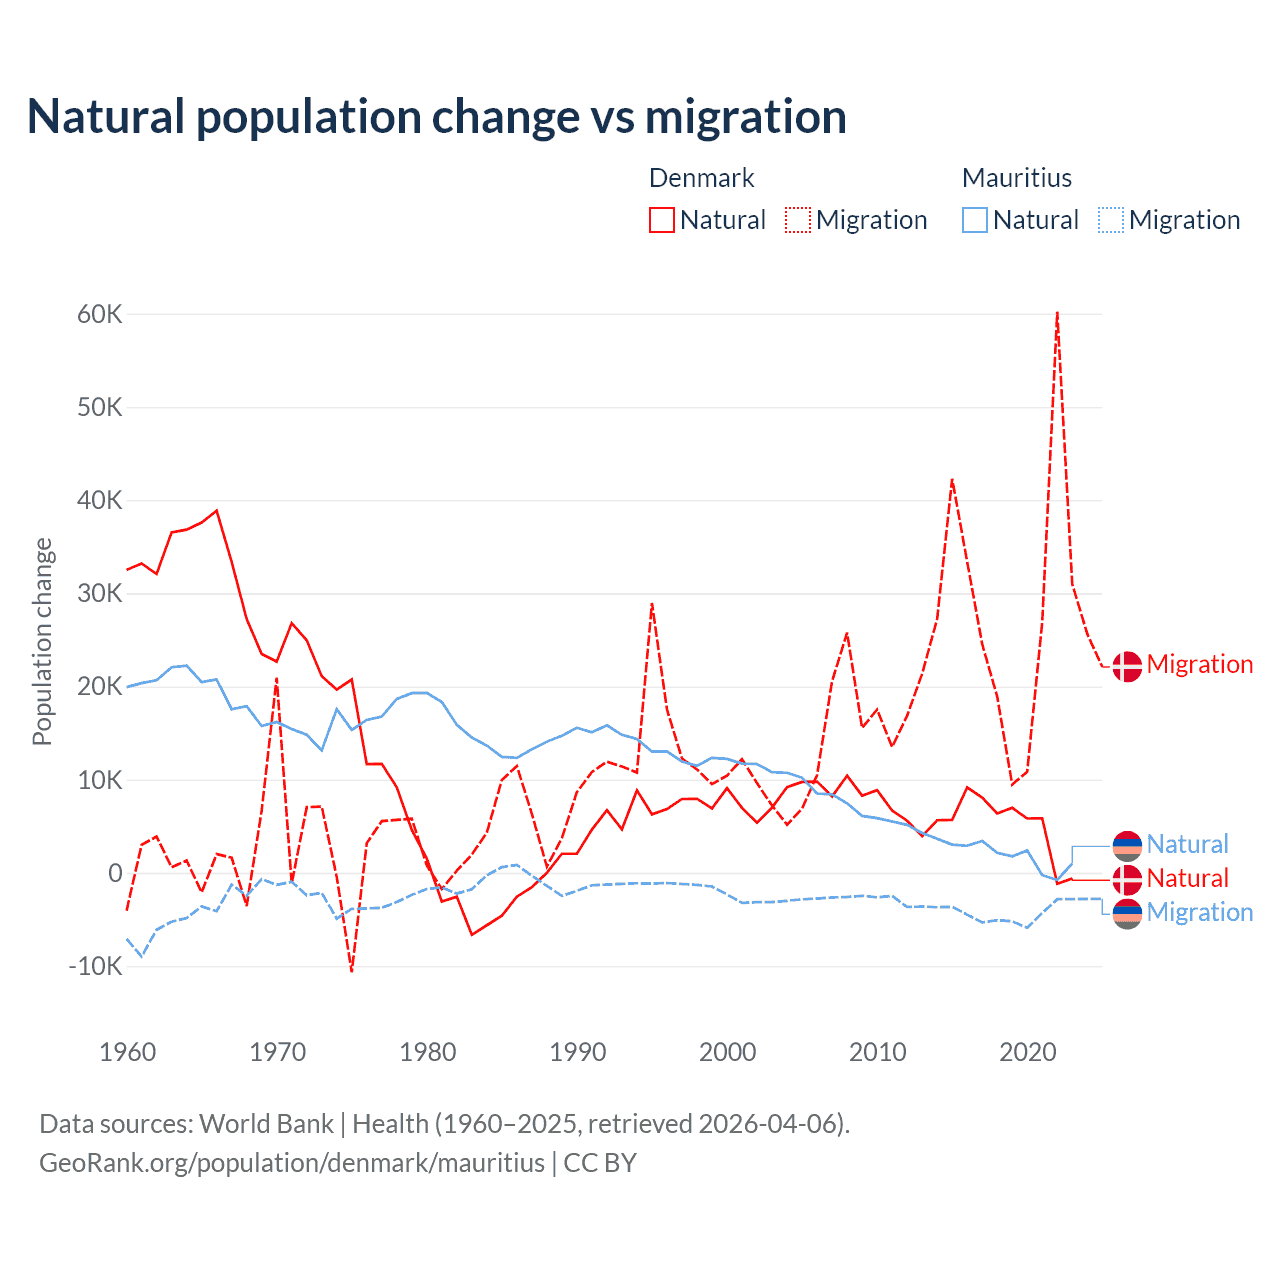
Natural population change vs migration
| Year | Population change | |||
|---|---|---|---|---|
|
Denmark
|
Mauritius
|
|||
| Natural | Migration | Natural | Migration | |
| 2025 | - | 22,103 | - | -2,784 |
| 2024 | 0 | 25,639 | 374 | -2,787 |
| 2023 | -595 | 31,006 | 999 | -2,824 |
| 2022 | -1,180 | 60,219 | -757 | -2,824 |
| 2021 | 5,857 | 26,887 | -380 | -4,324 |
| 2020 | 5,831 | 10,851 | 2,406 | -5,895 |
| 2019 | 6,977 | 9,488 | 1,646 | -5,202 |
| 2018 | 6,373 | 18,919 | 2,152 | -5,084 |
| 2017 | 8,071 | 24,561 | 3,289 | -5,322 |
| 2016 | 9,165 | 33,391 | 2,906 | -4,483 |
| 2015 | 5,683 | 42,284 | 2,905 | -3,645 |
| 2014 | 5,644 | 27,242 | 3,657 | -3,691 |
| 2013 | 3,931 | 21,359 | 4,281 | -3,617 |
| 2012 | 5,592 | 16,871 | 5,023 | -3,663 |
| 2011 | 6,685 | 13,495 | 5,511 | -2,465 |
| 2010 | 8,876 | 17,533 | 5,877 | -2,624 |
| 2009 | 8,285 | 15,551 | 6,113 | -2,467 |
| 2008 | 10,438 | 25,775 | 7,465 | -2,589 |
| 2007 | 8,192 | 20,560 | 8,429 | -2,642 |
| 2006 | 9,787 | 10,491 | 8,515 | -2,757 |
| 2005 | 9,755 | 6,887 | 10,195 | -2,840 |
| 2004 | 9,188 | 5,166 | 10,745 | -3,001 |
| 2003 | 7,007 | 7,228 | 10,799 | -3,141 |
| 2002 | 5,376 | 9,629 | 11,685 | -3,150 |
| 2001 | 6,967 | 12,192 | 11,723 | -3,225 |
| 2000 | 9,078 | 10,441 | 12,224 | -2,326 |
| 1999 | 6,919 | 9,520 | 12,341 | -1,463 |
| 1998 | 7,956 | 11,098 | 11,489 | -1,292 |
| 1997 | 7,927 | 12,269 | 11,943 | -1,199 |
| 1996 | 6,842 | 17,534 | 13,041 | -1,092 |
| 1995 | 6,280 | 28,958 | 13,020 | -1,144 |
| 1994 | 8,850 | 10,766 | 14,355 | -1,112 |
| 1993 | 4,670 | 11,411 | 14,814 | -1,189 |
| 1992 | 6,722 | 11,937 | 15,833 | -1,254 |
| 1991 | 4,639 | 10,827 | 15,091 | -1,333 |
| 1990 | 2,056 | 8,667 | 15,564 | -1,938 |
| 1989 | 2,053 | 3,720 | 14,718 | -2,463 |
| 1988 | 0 | 677 | 14,084 | -1,399 |
| 1987 | -1,538 | 6,338 | 13,262 | -300 |
| 1986 | -2,561 | 11,463 | 12,340 | 852 |
| 1985 | -4,603 | 9,957 | 12,451 | 615 |
| 1984 | -5,623 | 4,325 | 13,665 | -258 |
| 1983 | -6,649 | 1,952 | 14,525 | -1,756 |
| 1982 | -2,559 | 235 | 15,880 | -2,226 |
| 1981 | -3,073 | -1,741 | 18,334 | -1,559 |
| 1980 | 1,537 | 803 | 19,321 | -1,739 |
| 1979 | 4,605 | 5,808 | 19,282 | -2,363 |
| 1978 | 9,187 | 5,678 | 18,670 | -3,129 |
| 1977 | 11,703 | 5,548 | 16,769 | -3,749 |
| 1976 | 11,667 | 3,182 | 16,407 | -3,807 |
| 1975 | 20,746 | -10,672 | 15,342 | -3,869 |
| 1974 | 19,676 | -437 | 17,561 | -4,908 |
| 1973 | 21,092 | 7,107 | 13,145 | -2,144 |
| 1972 | 24,958 | 7,053 | 14,825 | -2,408 |
| 1971 | 26,801 | -1,159 | 15,441 | -960 |
| 1970 | 22,673 | 20,947 | 16,190 | -1,281 |
| 1969 | 23,481 | 6,687 | 15,761 | -674 |
| 1968 | 27,243 | -3,557 | 17,884 | -2,445 |
| 1967 | 33,363 | 1,623 | 17,560 | -1,257 |
| 1966 | 38,858 | 2,011 | 20,758 | -4,123 |
| 1965 | 37,596 | -2,098 | 20,482 | -3,597 |
| 1964 | 36,832 | 1,333 | 22,239 | -4,850 |
| 1963 | 36,539 | 594 | 22,069 | -5,236 |
| 1962 | 32,070 | 3,900 | 20,660 | -6,107 |
| 1961 | 33,205 | 3,012 | 20,355 | -8,984 |
| 1960 | 32,515 | -4,047 | 19,931 | -7,083 |
Data sources: World Bank | Health (1960–2025, retrieved 2026-07-08).
GeoRank.org/population/denmark/mauritius | CC BY
Over the last 10 years, 14% of the population change in Denmark is from natural causes (a gain of 46,182 people) and 86% is from migration (a gain of 283,245 people). In Mauritius 26.8% is from natural causes (a gain of 15,540 people) and 73.2% is from migration (a loss of 42,390 people).
As of 2024, 847,475 residents or 14.2% of the population were not native-born in Denmark, compared to 29,142 people or 2.3% in Mauritius.
Biggest cities by population
|
Denmark
|
|
|---|---|
| City | Population |
| Copenhagen | 667K |
| Aarhus | 291K |
| Odense | 185K |
| Aalborg | 122K |
| Frederiksberg | 106K |
| Esbjerg | 71.6K |
| Randers | 64.7K |
| Horsens | 64.4K |
| Kolding | 63.6K |
| Vejle | 62K |
|
Mauritius
|
|
|---|---|
| City | Population |
| Port Louis | 149K |
| Quatre Bornes | 81.8K |
| Curepipe | 77.5K |
| Triolet | 23.4K |
| Goodlands | 20.7K |
| Centre de Flacq | 15.8K |
| Mahebourg | 15.8K |
| Bambous | 15.3K |
Compare countries by 7 more topics
Population differences between Denmark and Mauritius
|
Denmark
|
Mauritius
|
|
|---|---|---|
| Life expectancy | 82.4 years | 75.4 years |
| Average age | 42.5 years | 39.6 years |
| Median age | 42.3 years | 38.9 years |
| Male:Female ratio | 49.7:50.3 | 49.9:50.1 |
| Fertility rate | 1.47 births per woman | 1.44 births per woman |
| Population density | 391 ppl/mi² | 1,609 ppl/mi² |
Population map with other countries
Data sources: World Bank | Health (1960–2025, retrieved 2026-07-08); United Nations | World Population Prospects (1960–2026, retrieved 2026-07-08); U.S. Census Bureau (1960–2025, retrieved 2026-07-08); Central Intelligence Agency (CIA) (2000–2019, retrieved 2026-07-08).
GeoRank.org/population/denmark/mauritius | CC BY
Help us show the world through your eyes
Share a photo of your city and help others discover what it looks like to live there. Your contribution makes our data come alive.
Data sources:
- World Bank | Health (1960–2025, retrieved 2026-07-08)
- United Nations | World Population Prospects (1960–2100, retrieved 2026-07-08)
- U.S. Census Bureau (1960–2025, retrieved 2026-07-08)
- Central Intelligence Agency (CIA) (2000–2019, retrieved 2026-07-08)
- Wikidata (2026, retrieved 2026-07-08)
Creative Commons Attribution (CC BY) — you’re free to copy, share, remix, adapt, and use even commercially as long as you give appropriate credit and clearly indicate if you made changes. Other sources may be subject to different license terms.