Demographics of Azerbaijan compared to Guinea-Bissau:
- As of 2026, the population of Azerbaijan is 10.3M vs 2.32M in Guinea-Bissau - 4.45 times difference.
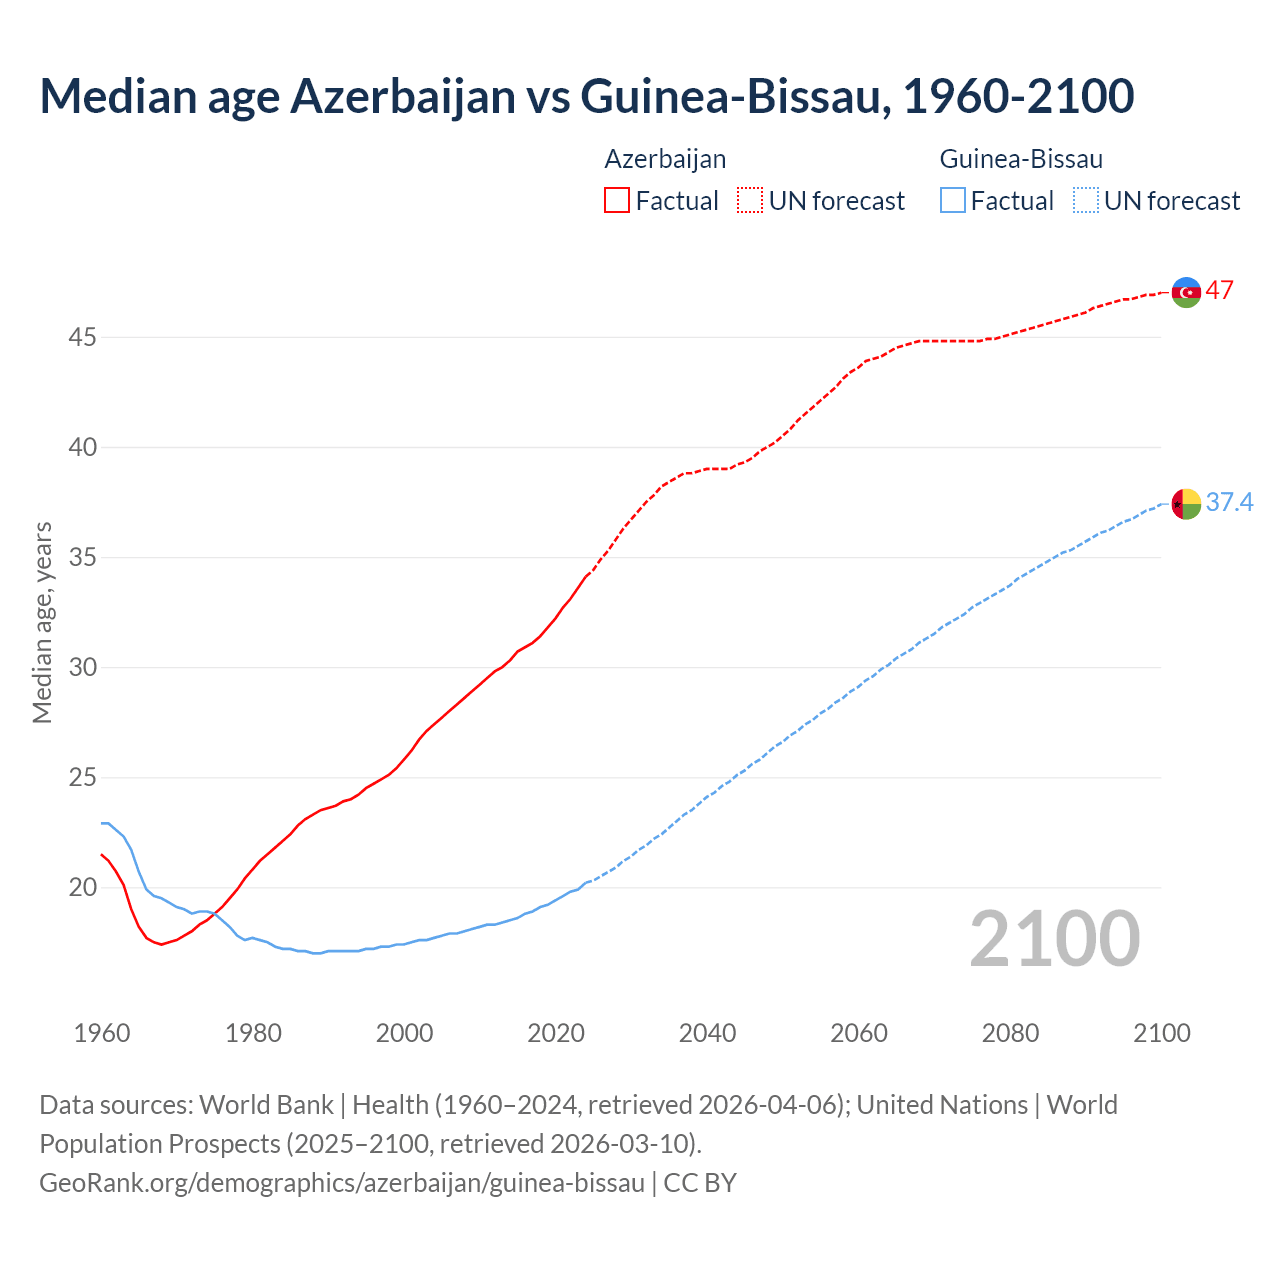
- The median age in Azerbaijan is 34.6 years compared to 20.4 years in Guinea-Bissau.
- Azerbaijan is ranked 79/196 by median age (oldest to youngest) vs 164/196 for Guinea-Bissau.
- The average life expectancy at birth in Azerbaijan is 74.9 years, compared to 64.6 years in Guinea-Bissau.
- The share of old-age demographic (65+) in Azerbaijan is 9.17% vs 3.24% in Guinea-Bissau.
- The share of young demographic (0-15 years old) in Azerbaijan is 21.2% vs 38.3% in Guinea-Bissau.
- Azerbaijan has 7.2M working age adults (aged 15-64) vs 1.36M in Guinea-Bissau.
- The total fertility rate is 1.43 in Azerbaijan compared to 3.76 in Guinea-Bissau.
Median age Azerbaijan vs Guinea-Bissau, 1960-2100
| Year | Median age, years | |
|---|---|---|
 Azerbaijan
|
 Guinea-Bissau
|
|
| 2100 | 47 | 37.4 |
| 2099 | 46.9 | 37.2 |
| 2098 | 46.9 | 37.1 |
| 2097 | 46.8 | 36.9 |
| 2096 | 46.7 | 36.7 |
| 2095 | 46.7 | 36.6 |
| 2094 | 46.6 | 36.4 |
| 2093 | 46.5 | 36.2 |
| 2092 | 46.4 | 36.1 |
| 2091 | 46.3 | 35.9 |
| 2090 | 46.1 | 35.7 |
| 2089 | 46 | 35.5 |
| 2088 | 45.9 | 35.3 |
| 2087 | 45.8 | 35.2 |
| 2086 | 45.7 | 35 |
| 2085 | 45.6 | 34.8 |
| 2084 | 45.5 | 34.6 |
| 2083 | 45.4 | 34.4 |
| 2082 | 45.3 | 34.2 |
| 2081 | 45.2 | 34 |
| 2080 | 45.1 | 33.7 |
| 2079 | 45 | 33.5 |
| 2078 | 44.9 | 33.3 |
| 2077 | 44.9 | 33.1 |
| 2076 | 44.8 | 32.9 |
| 2075 | 44.8 | 32.7 |
| 2074 | 44.8 | 32.4 |
| 2073 | 44.8 | 32.2 |
| 2072 | 44.8 | 32 |
| 2071 | 44.8 | 31.8 |
| 2070 | 44.8 | 31.5 |
| 2069 | 44.8 | 31.3 |
| 2068 | 44.8 | 31.1 |
| 2067 | 44.7 | 30.8 |
| 2066 | 44.6 | 30.6 |
| 2065 | 44.5 | 30.4 |
| 2064 | 44.3 | 30.1 |
| 2063 | 44.1 | 29.9 |
| 2062 | 44 | 29.6 |
| 2061 | 43.9 | 29.4 |
| 2060 | 43.6 | 29.1 |
| 2059 | 43.4 | 28.9 |
| 2058 | 43.1 | 28.6 |
| 2057 | 42.7 | 28.4 |
| 2056 | 42.4 | 28.1 |
| 2055 | 42.1 | 27.9 |
| 2054 | 41.8 | 27.6 |
| 2053 | 41.5 | 27.4 |
| 2052 | 41.2 | 27.1 |
| 2051 | 40.8 | 26.9 |
| 2050 | 40.5 | 26.6 |
| 2049 | 40.2 | 26.4 |
| 2048 | 40 | 26.1 |
| 2047 | 39.8 | 25.8 |
| 2046 | 39.5 | 25.6 |
| 2045 | 39.3 | 25.3 |
| 2044 | 39.2 | 25.1 |
| 2043 | 39 | 24.8 |
| 2042 | 39 | 24.6 |
| 2041 | 39 | 24.3 |
| 2040 | 39 | 24.1 |
| 2039 | 38.9 | 23.8 |
| 2038 | 38.8 | 23.5 |
| 2037 | 38.8 | 23.3 |
| 2036 | 38.6 | 23 |
| 2035 | 38.4 | 22.7 |
| 2034 | 38.2 | 22.4 |
| 2033 | 37.8 | 22.2 |
| 2032 | 37.5 | 21.9 |
| 2031 | 37.1 | 21.7 |
| 2030 | 36.7 | 21.4 |
| 2029 | 36.3 | 21.2 |
| 2028 | 35.8 | 20.9 |
| 2027 | 35.3 | 20.7 |
| 2026 | 34.9 | 20.5 |
| 2025 | 34.6 | 20.4 |
| 2024 | 34.1 | 20.2 |
| 2023 | 33.6 | 19.9 |
| 2022 | 33.1 | 19.8 |
| 2021 | 32.7 | 19.6 |
| 2020 | 32.2 | 19.4 |
| 2019 | 31.8 | 19.2 |
| 2018 | 31.4 | 19.1 |
| 2017 | 31.1 | 18.9 |
| 2016 | 30.9 | 18.8 |
| 2015 | 30.7 | 18.6 |
| 2014 | 30.3 | 18.5 |
| 2013 | 30 | 18.4 |
| 2012 | 29.8 | 18.3 |
| 2011 | 29.5 | 18.3 |
| 2010 | 29.2 | 18.2 |
| 2009 | 28.9 | 18.1 |
| 2008 | 28.6 | 18 |
| 2007 | 28.3 | 17.9 |
| 2006 | 28 | 17.9 |
| 2005 | 27.7 | 17.8 |
| 2004 | 27.4 | 17.7 |
| 2003 | 27.1 | 17.6 |
| 2002 | 26.7 | 17.6 |
| 2001 | 26.2 | 17.5 |
| 2000 | 25.8 | 17.4 |
| 1999 | 25.4 | 17.4 |
| 1998 | 25.1 | 17.3 |
| 1997 | 24.9 | 17.3 |
| 1996 | 24.7 | 17.2 |
| 1995 | 24.5 | 17.2 |
| 1994 | 24.2 | 17.1 |
| 1993 | 24 | 17.1 |
| 1992 | 23.9 | 17.1 |
| 1991 | 23.7 | 17.1 |
| 1990 | 23.6 | 17.1 |
| 1989 | 23.5 | 17 |
| 1988 | 23.3 | 17 |
| 1987 | 23.1 | 17.1 |
| 1986 | 22.8 | 17.1 |
| 1985 | 22.4 | 17.2 |
| 1984 | 22.1 | 17.2 |
| 1983 | 21.8 | 17.3 |
| 1982 | 21.5 | 17.5 |
| 1981 | 21.2 | 17.6 |
| 1980 | 20.8 | 17.7 |
| 1979 | 20.4 | 17.6 |
| 1978 | 19.9 | 17.8 |
| 1977 | 19.5 | 18.2 |
| 1976 | 19.1 | 18.5 |
| 1975 | 18.8 | 18.8 |
| 1974 | 18.5 | 18.9 |
| 1973 | 18.3 | 18.9 |
| 1972 | 18 | 18.8 |
| 1971 | 17.8 | 19 |
| 1970 | 17.6 | 19.1 |
| 1969 | 17.5 | 19.3 |
| 1968 | 17.4 | 19.5 |
| 1967 | 17.5 | 19.6 |
| 1966 | 17.7 | 19.9 |
| 1965 | 18.2 | 20.7 |
| 1964 | 19 | 21.7 |
| 1963 | 20.1 | 22.3 |
| 1962 | 20.7 | 22.6 |
| 1961 | 21.2 | 22.9 |
| 1960 | 21.5 | 22.9 |
Data sources: World Bank | Health (1960–2025, retrieved 2026-07-08); United Nations | World Population Prospects (2026–2100, retrieved 2026-07-08).
GeoRank.org/demographics/azerbaijan/guinea-bissau | CC BY 
In 1960, the median age in Azerbaijan was 21.5 years compared to 22.9 years in Guinea-Bissau. As of 2025, the median age had changed to 34.6 years in Azerbaijan and to 20.4 years in Guinea-Bissau.
According to United Nations projections, the median age in Azerbaijan is expected to increased to around 40.5 years by 2050 compared to 26.6 years in Guinea-Bissau. The aging demographics forecast is based on previous years' birth rates and increasing life expectancy.
Demographic data comparison
|
Azerbaijan
|
Guinea-Bissau
|
|
|---|---|---|
| Population |
10333222
|
2323460
|
| Median age | 34.6 years | 20.4 years |
| Median age rank | 79/196 | 164/196 |
| Average age | 35.2 years | 24.4 years |
| Average age rank | 81/196 | 166/196 |
| Age dependency ratio | 43.6% | 71.1% |
| Young-age dependency ratio | 30.4% | 65.6% |
| Old-age dependency ratio | 13.2% | 5.54% |
| Male:Female ratio | 49:51 | 49.4:50.6 |
| Population density | 124.7 ppl/mi² | 81.7 ppl/mi² |
| Fertility rate | 1.43 | 3.76 |
| Life expectancy | 74.9 years | 64.6 years |
Demographic pyramid: age and gender distribution
| Age range | Share of population | |||
|---|---|---|---|---|
|
Azerbaijan
|
Guinea-Bissau
|
|||
| Male | Female | Male | Female | |
| 80+ | 0.33% | 0.71% | 0.14% | 0.23% |
| 75-79 | 0.5% | 0.77% | 0.21% | 0.33% |
| 70-74 | 1.05% | 1.43% | 0.36% | 0.6% |
| 65-69 | 1.92% | 2.45% | 0.53% | 0.85% |
| 60-64 | 2.54% | 3.1% | 0.73% | 1.02% |
| 55-59 | 2.67% | 3.15% | 1.05% | 1.28% |
| 50-54 | 2.66% | 2.96% | 1.56% | 1.76% |
| 45-49 | 3.12% | 3.27% | 2.01% | 2.15% |
| 40-44 | 3.77% | 3.91% | 2.55% | 2.61% |
| 35-39 | 4.37% | 4.61% | 3.02% | 3.06% |
| 30-34 | 4.21% | 4.52% | 3.52% | 3.54% |
| 25-29 | 3.38% | 3.4% | 4.11% | 4.1% |
| 20-24 | 3.34% | 3.04% | 4.75% | 4.71% |
| 15-19 | 4.02% | 3.61% | 5.5% | 5.41% |
| 10-14 | 4.29% | 3.87% | 6.17% | 6.03% |
| 5-9 | 3.66% | 3.31% | 6.41% | 6.25% |
| 0-4 | 3.2% | 2.86% | 6.83% | 6.64% |
Data sources: World Bank | Health (2025, retrieved 2026-07-08).
GeoRank.org/demographics/azerbaijan/guinea-bissau | CC BY
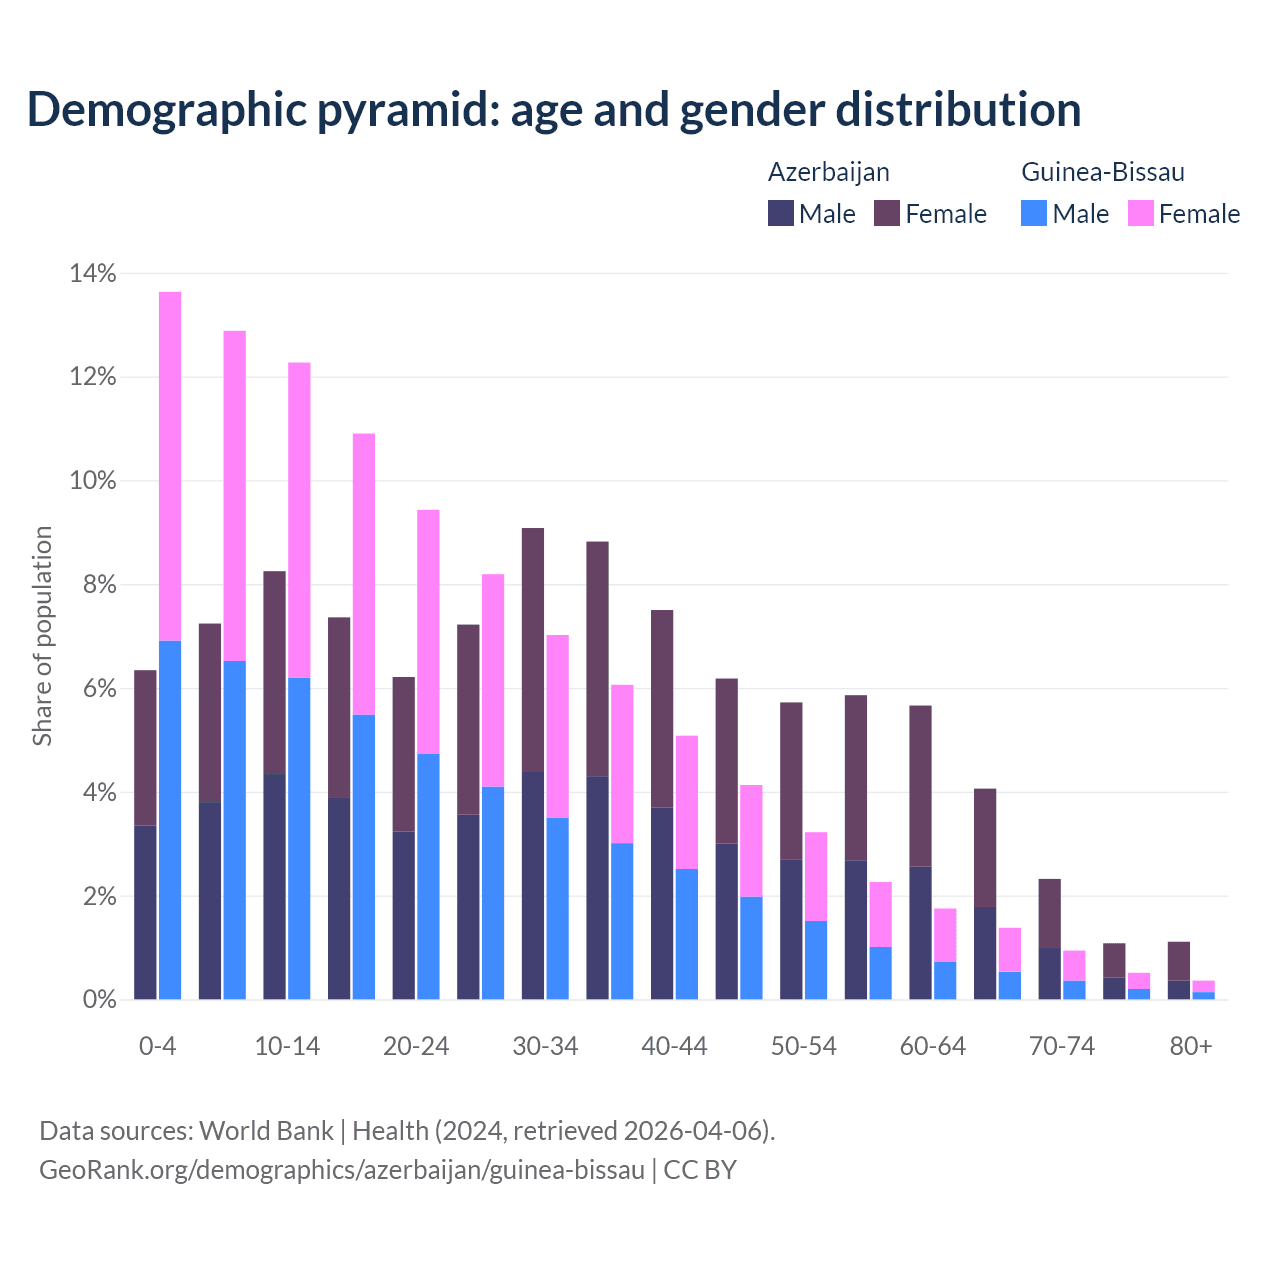
The chart above is a variation of a population pyramid and represents a comparison of age and gender structure. Azerbaijan has low demographic potential with 50.7% of people in the 0-34 age group compared to 74% and high potential in Guinea-Bissau.
Working age demographic by year
| Year | Working age share | |
|---|---|---|
|
Azerbaijan
|
Guinea-Bissau
|
|
| 2100 | 58.1% | 64.9% |
| 2099 | 58.2% | 65% |
| 2098 | 58.3% | 65.1% |
| 2097 | 58.4% | 65.2% |
| 2096 | 58.4% | 65.3% |
| 2095 | 58.4% | 65.3% |
| 2094 | 58.4% | 65.4% |
| 2093 | 58.4% | 65.5% |
| 2092 | 58.4% | 65.5% |
| 2091 | 58.3% | 65.6% |
| 2090 | 58.3% | 65.7% |
| 2089 | 58.3% | 65.7% |
| 2088 | 58.2% | 65.8% |
| 2087 | 58.2% | 65.9% |
| 2086 | 58.3% | 65.9% |
| 2085 | 58.4% | 66% |
| 2084 | 58.6% | 66% |
| 2083 | 58.6% | 66.1% |
| 2082 | 58.7% | 66.1% |
| 2081 | 58.9% | 66.2% |
| 2080 | 59.2% | 66.3% |
| 2079 | 59.6% | 66.4% |
| 2078 | 60% | 66.5% |
| 2077 | 60.3% | 66.5% |
| 2076 | 60.7% | 66.6% |
| 2075 | 61.1% | 66.7% |
| 2074 | 61.5% | 66.7% |
| 2073 | 61.7% | 66.7% |
| 2072 | 62% | 66.8% |
| 2071 | 62.2% | 66.8% |
| 2070 | 62.3% | 66.8% |
| 2069 | 62.4% | 66.8% |
| 2068 | 62.3% | 66.8% |
| 2067 | 62.2% | 66.8% |
| 2066 | 62.1% | 66.7% |
| 2065 | 62% | 66.7% |
| 2064 | 61.9% | 66.6% |
| 2063 | 61.8% | 66.6% |
| 2062 | 61.7% | 66.5% |
| 2061 | 61.8% | 66.5% |
| 2060 | 61.9% | 66.4% |
| 2059 | 62.2% | 66.3% |
| 2058 | 62.4% | 66.2% |
| 2057 | 62.8% | 66.1% |
| 2056 | 63.1% | 65.9% |
| 2055 | 63.6% | 65.8% |
| 2054 | 64.1% | 65.7% |
| 2053 | 64.5% | 65.6% |
| 2052 | 64.8% | 65.4% |
| 2051 | 65.2% | 65.3% |
| 2050 | 65.6% | 65.1% |
| 2049 | 65.9% | 65% |
| 2048 | 66.2% | 64.8% |
| 2047 | 66.5% | 64.6% |
| 2046 | 66.7% | 64.5% |
| 2045 | 67.1% | 64.3% |
| 2044 | 67.3% | 64.1% |
| 2043 | 67.6% | 63.8% |
| 2042 | 67.8% | 63.6% |
| 2041 | 68% | 63.5% |
| 2040 | 68.3% | 63.3% |
| 2039 | 68.4% | 63% |
| 2038 | 68.6% | 62.8% |
| 2037 | 68.8% | 62.6% |
| 2036 | 68.9% | 62.3% |
| 2035 | 69.1% | 62.1% |
| 2034 | 69.2% | 61.8% |
| 2033 | 69.5% | 61.5% |
| 2032 | 69.7% | 61.2% |
| 2031 | 69.7% | 60.8% |
| 2030 | 69.7% | 60.4% |
| 2029 | 69.7% | 60% |
| 2028 | 69.7% | 59.5% |
| 2027 | 69.6% | 59.1% |
| 2026 | 69.6% | 58.6% |
| 2025 | 69.6% | 58.4% |
| 2024 | 69.6% | 58% |
| 2023 | 69.6% | 57.6% |
| 2022 | 69.7% | 57.2% |
| 2021 | 69.7% | 56.8% |
| 2020 | 69.7% | 56.4% |
| 2019 | 69.8% | 56.1% |
| 2018 | 69.9% | 55.8% |
| 2017 | 69.9% | 55.4% |
| 2016 | 70.3% | 55.2% |
| 2015 | 70.8% | 54.9% |
| 2014 | 71.2% | 54.7% |
| 2013 | 71.7% | 54.5% |
| 2012 | 72% | 54.4% |
| 2011 | 72.1% | 54.2% |
| 2010 | 71.8% | 54% |
| 2009 | 71.2% | 53.8% |
| 2008 | 70.5% | 53.6% |
| 2007 | 69.7% | 53.4% |
| 2006 | 69% | 53.2% |
| 2005 | 68.3% | 53% |
| 2004 | 67.6% | 52.8% |
| 2003 | 66.8% | 52.6% |
| 2002 | 65.9% | 52.3% |
| 2001 | 65% | 52% |
| 2000 | 64.1% | 51.8% |
| 1999 | 63.3% | 51.5% |
| 1998 | 62.6% | 51.2% |
| 1997 | 62.1% | 50.9% |
| 1996 | 61.7% | 50.6% |
| 1995 | 61.4% | 50.4% |
| 1994 | 61.3% | 50.1% |
| 1993 | 61.4% | 49.9% |
| 1992 | 61.6% | 49.7% |
| 1991 | 61.9% | 49.4% |
| 1990 | 62.2% | 49.2% |
| 1989 | 62.7% | 49.1% |
| 1988 | 63.1% | 49% |
| 1987 | 63.2% | 48.9% |
| 1986 | 63.1% | 48.9% |
| 1985 | 62.9% | 49% |
| 1984 | 62.8% | 49.1% |
| 1983 | 62.5% | 49.3% |
| 1982 | 62.3% | 49.6% |
| 1981 | 61.8% | 49.9% |
| 1980 | 61.2% | 50.2% |
| 1979 | 60.5% | 50.2% |
| 1978 | 59.4% | 50.4% |
| 1977 | 57.9% | 51.5% |
| 1976 | 56.6% | 52.6% |
| 1975 | 55.3% | 53.4% |
| 1974 | 54.2% | 54% |
| 1973 | 53.3% | 54% |
| 1972 | 52.4% | 53.7% |
| 1971 | 51.6% | 53.8% |
| 1970 | 51% | 53.9% |
| 1969 | 50.6% | 53.9% |
| 1968 | 50.3% | 54% |
| 1967 | 50.2% | 53.7% |
| 1966 | 50.2% | 53.8% |
| 1965 | 50.5% | 54.8% |
| 1964 | 50.8% | 56.3% |
| 1963 | 51.4% | 57.5% |
| 1962 | 52.3% | 58.2% |
| 1961 | 53.5% | 58.8% |
| 1960 | 55% | 59.1% |
Data sources: World Bank | Health (1960–2025, retrieved 2026-07-08); United Nations | World Population Prospects (2026–2100, retrieved 2026-07-08).
GeoRank.org/demographics/azerbaijan/guinea-bissau | CC BY
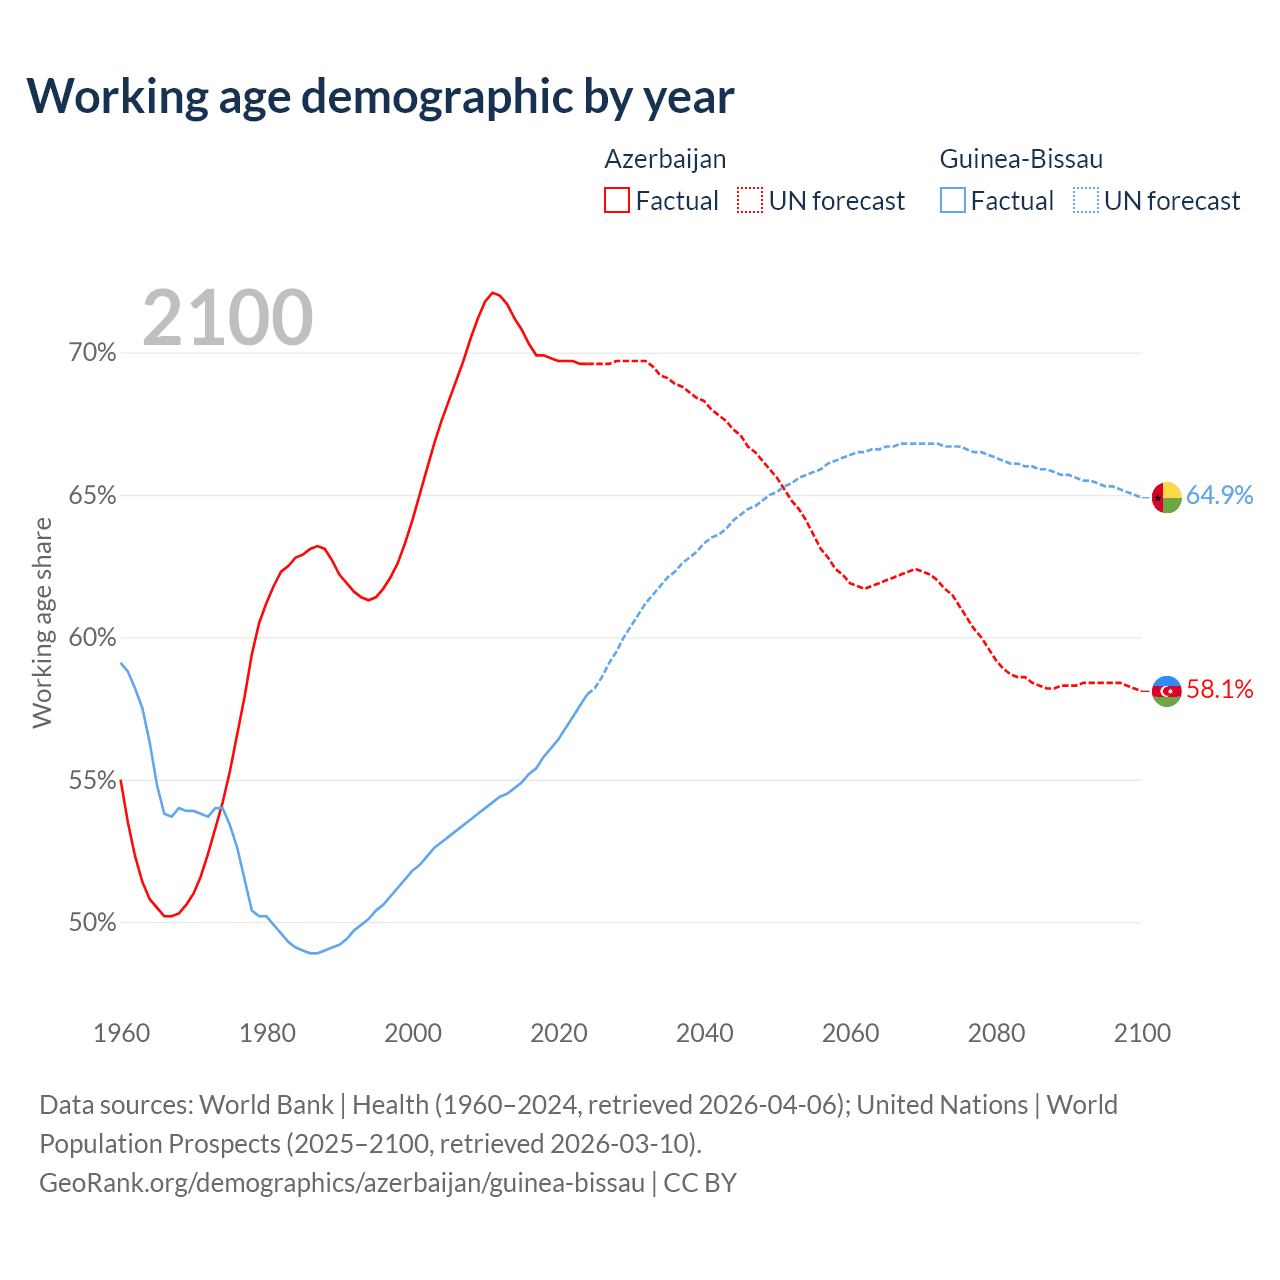
Between 2005 and 2025, the share of working-age demographics aged 15-64 changed from 68.3% to 69.6% in Azerbaijan and from 53% to 58.4% in Guinea-Bissau.
Age dependency by year
| Year | Age dependency ratio | |||||
|---|---|---|---|---|---|---|
|
Azerbaijan
|
Guinea-Bissau
|
|||||
| Total | Young | Old | Total | Young | Old | |
| 2025 | 43.6% | 30.4% | 13.2% | 71.1% | 65.6% | 5.54% |
| 2024 | 43.6% | 31.3% | 12.3% | 72.3% | 66.8% | 5.5% |
| 2023 | 43.6% | 32.1% | 11.5% | 73.6% | 68.1% | 5.45% |
| 2022 | 43.5% | 32.7% | 10.8% | 74.8% | 69.4% | 5.4% |
| 2021 | 43.5% | 33.2% | 10.3% | 76% | 70.7% | 5.36% |
| 2020 | 43.4% | 33.5% | 9.87% | 77.2% | 71.8% | 5.35% |
| 2019 | 43.2% | 33.7% | 9.49% | 78.3% | 73% | 5.32% |
| 2018 | 43.1% | 34% | 9.12% | 79.4% | 74.1% | 5.26% |
| 2017 | 43% | 34.2% | 8.78% | 80.4% | 75.2% | 5.21% |
| 2016 | 42.3% | 33.8% | 8.46% | 81.3% | 76.1% | 5.17% |
| 2015 | 41.3% | 33.1% | 8.19% | 82% | 76.9% | 5.13% |
| 2014 | 40.4% | 32.4% | 8.03% | 82.7% | 77.6% | 5.12% |
| 2013 | 39.5% | 31.6% | 7.93% | 83.4% | 78.2% | 5.12% |
| 2012 | 38.8% | 30.9% | 7.88% | 84% | 78.8% | 5.15% |
| 2011 | 38.7% | 30.7% | 7.97% | 84.6% | 79.4% | 5.19% |
| 2010 | 39.3% | 31.1% | 8.2% | 85.2% | 80% | 5.26% |
| 2009 | 40.4% | 31.8% | 8.56% | 85.9% | 80.6% | 5.35% |
| 2008 | 41.9% | 32.9% | 8.98% | 86.6% | 81.2% | 5.45% |
| 2007 | 43.4% | 34.1% | 9.33% | 87.3% | 81.7% | 5.58% |
| 2006 | 44.9% | 35.3% | 9.54% | 88% | 82.2% | 5.72% |
| 2005 | 46.4% | 36.8% | 9.61% | 88.6% | 82.7% | 5.88% |
| 2004 | 48% | 38.5% | 9.57% | 89.4% | 83.3% | 6.06% |
| 2003 | 49.8% | 40.4% | 9.43% | 90.3% | 84% | 6.26% |
| 2002 | 51.8% | 42.6% | 9.18% | 91.2% | 84.7% | 6.47% |
| 2001 | 53.8% | 44.9% | 8.9% | 92.2% | 85.5% | 6.69% |
| 2000 | 55.9% | 47.3% | 8.63% | 93.2% | 86.3% | 6.94% |
| 1999 | 57.9% | 49.5% | 8.42% | 94.3% | 87.1% | 7.2% |
| 1998 | 59.8% | 51.4% | 8.34% | 95.3% | 87.8% | 7.49% |
| 1997 | 61.2% | 52.9% | 8.29% | 96.3% | 88.5% | 7.8% |
| 1996 | 62.2% | 53.9% | 8.25% | 97.5% | 89.3% | 8.13% |
| 1995 | 62.8% | 54.7% | 8.1% | 98.5% | 90% | 8.49% |
| 1994 | 63% | 55.2% | 7.79% | 99.4% | 90.6% | 8.86% |
| 1993 | 62.8% | 55.4% | 7.4% | 100.2% | 90.9% | 9.27% |
| 1992 | 62.3% | 55.3% | 6.98% | 101.2% | 91.4% | 9.72% |
| 1991 | 61.6% | 55% | 6.66% | 102.4% | 92.1% | 10.2% |
| 1990 | 60.8% | 54.4% | 6.37% | 103.3% | 92.8% | 10.5% |
| 1989 | 59.5% | 53.4% | 6.09% | 103.8% | 93.3% | 10.5% |
| 1988 | 58.5% | 52.6% | 5.9% | 104.2% | 93.7% | 10.5% |
| 1987 | 58.3% | 52.5% | 5.83% | 104.4% | 93.9% | 10.5% |
| 1986 | 58.5% | 52.7% | 5.86% | 104.4% | 93.9% | 10.4% |
| 1985 | 58.9% | 53% | 5.88% | 104.1% | 93.8% | 10.3% |
| 1984 | 59.3% | 53.5% | 5.89% | 103.6% | 93.3% | 10.2% |
| 1983 | 59.9% | 54% | 5.92% | 102.7% | 92.6% | 10.1% |
| 1982 | 60.6% | 54.7% | 5.97% | 101.6% | 91.7% | 9.89% |
| 1981 | 61.8% | 55.7% | 6.12% | 100.4% | 90.7% | 9.69% |
| 1980 | 63.4% | 57.1% | 6.26% | 99.2% | 89.7% | 9.48% |
| 1979 | 65.3% | 58.9% | 6.41% | 99.4% | 89.9% | 9.48% |
| 1978 | 68.4% | 61.8% | 6.6% | 98.3% | 88.8% | 9.54% |
| 1977 | 72.6% | 65.8% | 6.85% | 94.3% | 84.9% | 9.39% |
| 1976 | 76.8% | 69.7% | 7.11% | 90.3% | 81.1% | 9.16% |
| 1975 | 80.8% | 73.5% | 7.32% | 87.1% | 78.2% | 8.86% |
| 1974 | 84.4% | 76.9% | 7.48% | 85.3% | 76.8% | 8.52% |
| 1973 | 87.8% | 80.2% | 7.63% | 85.3% | 77% | 8.27% |
| 1972 | 90.9% | 83.2% | 7.77% | 86.3% | 78.1% | 8.17% |
| 1971 | 93.7% | 85.8% | 7.9% | 85.9% | 77.9% | 8.01% |
| 1970 | 95.9% | 87.9% | 8.02% | 85.6% | 77.7% | 7.9% |
| 1969 | 97.6% | 89.5% | 8.12% | 85.5% | 77.6% | 7.84% |
| 1968 | 98.8% | 90.6% | 8.21% | 85.3% | 77.5% | 7.83% |
| 1967 | 99.3% | 91% | 8.27% | 86.4% | 78.4% | 7.93% |
| 1966 | 99.1% | 90.7% | 8.32% | 85.7% | 77.8% | 7.91% |
| 1965 | 98.2% | 89.8% | 8.37% | 82.5% | 74.8% | 7.69% |
| 1964 | 96.7% | 88.3% | 8.41% | 77.7% | 70.4% | 7.37% |
| 1963 | 94.4% | 86% | 8.45% | 74% | 66.9% | 7.14% |
| 1962 | 91.3% | 82.9% | 8.47% | 71.9% | 64.9% | 7.02% |
| 1961 | 87.1% | 78.6% | 8.46% | 70% | 63.1% | 6.93% |
| 1960 | 81.8% | 73.4% | 8.43% | 69.2% | 62.4% | 6.84% |
Data sources: World Bank | Health (1960–2025, retrieved 2026-07-08).
GeoRank.org/demographics/azerbaijan/guinea-bissau | CC BY
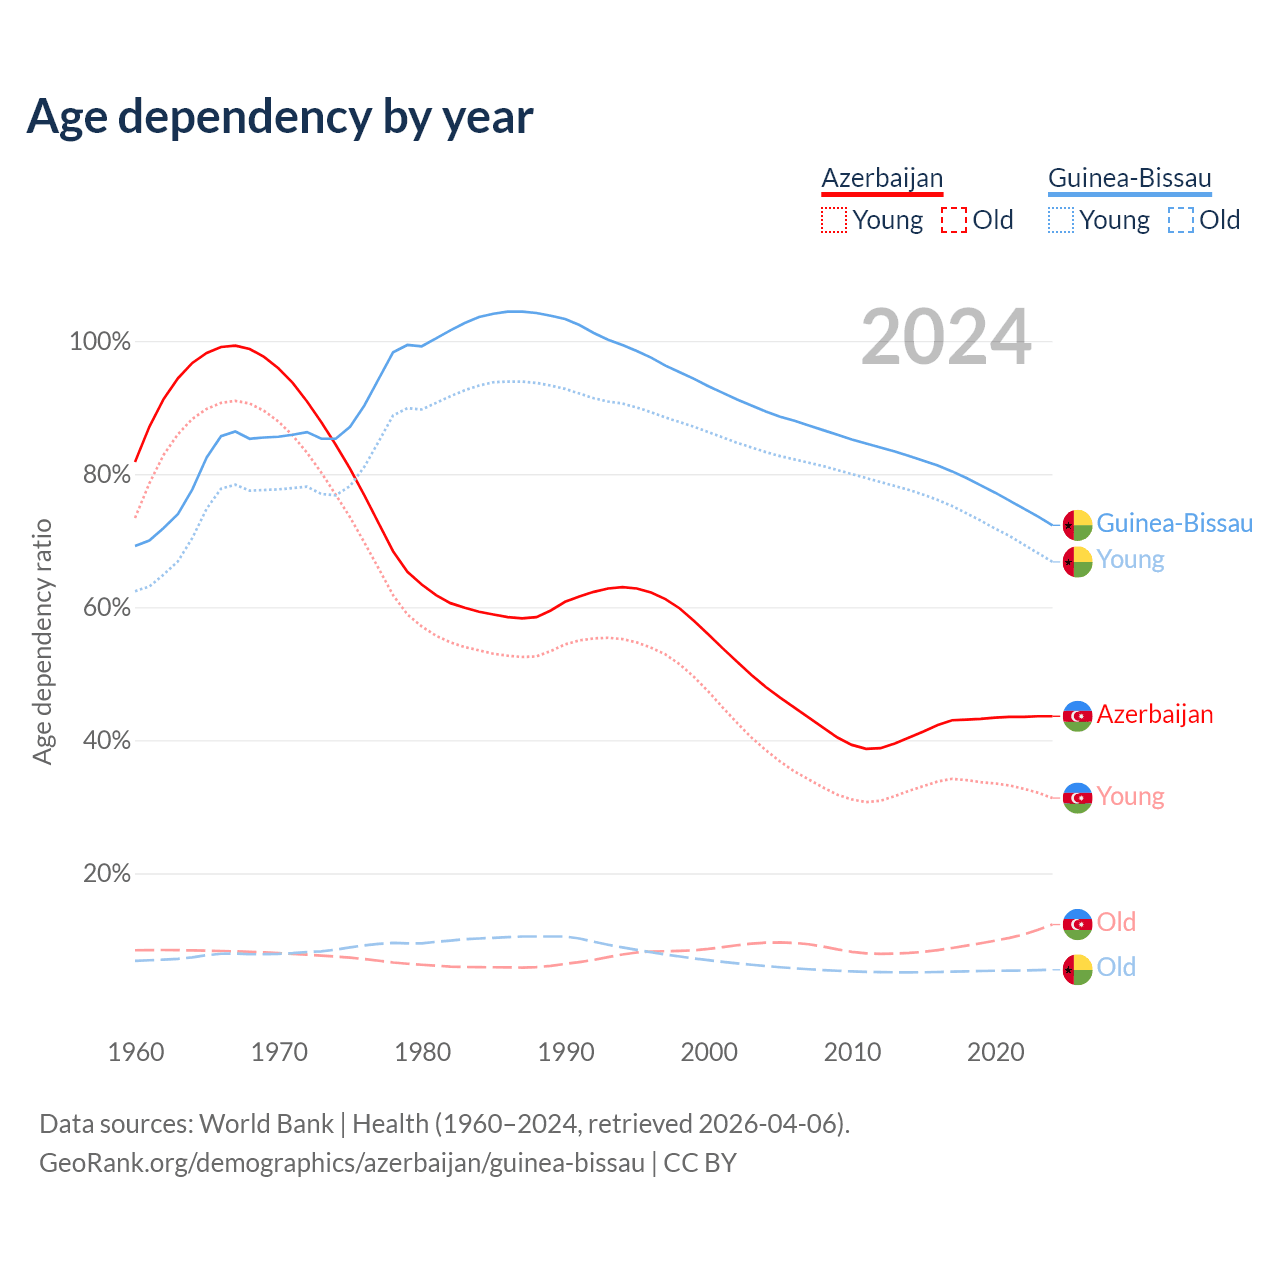
Age dependency is the ratio of people not in the labor force (children under 15 and adults 64+) to people aged 15 to 64.
Age dependency in Azerbaijan decreased from 46.4% to 43.6% between 2005 and 2025.
In Guinea-Bissau, the ratio of dependent people decreased from 88.6% to 71.1% between 2005 and 2025 with a decreased share of young people and a decreased proportion of people aged 65+.
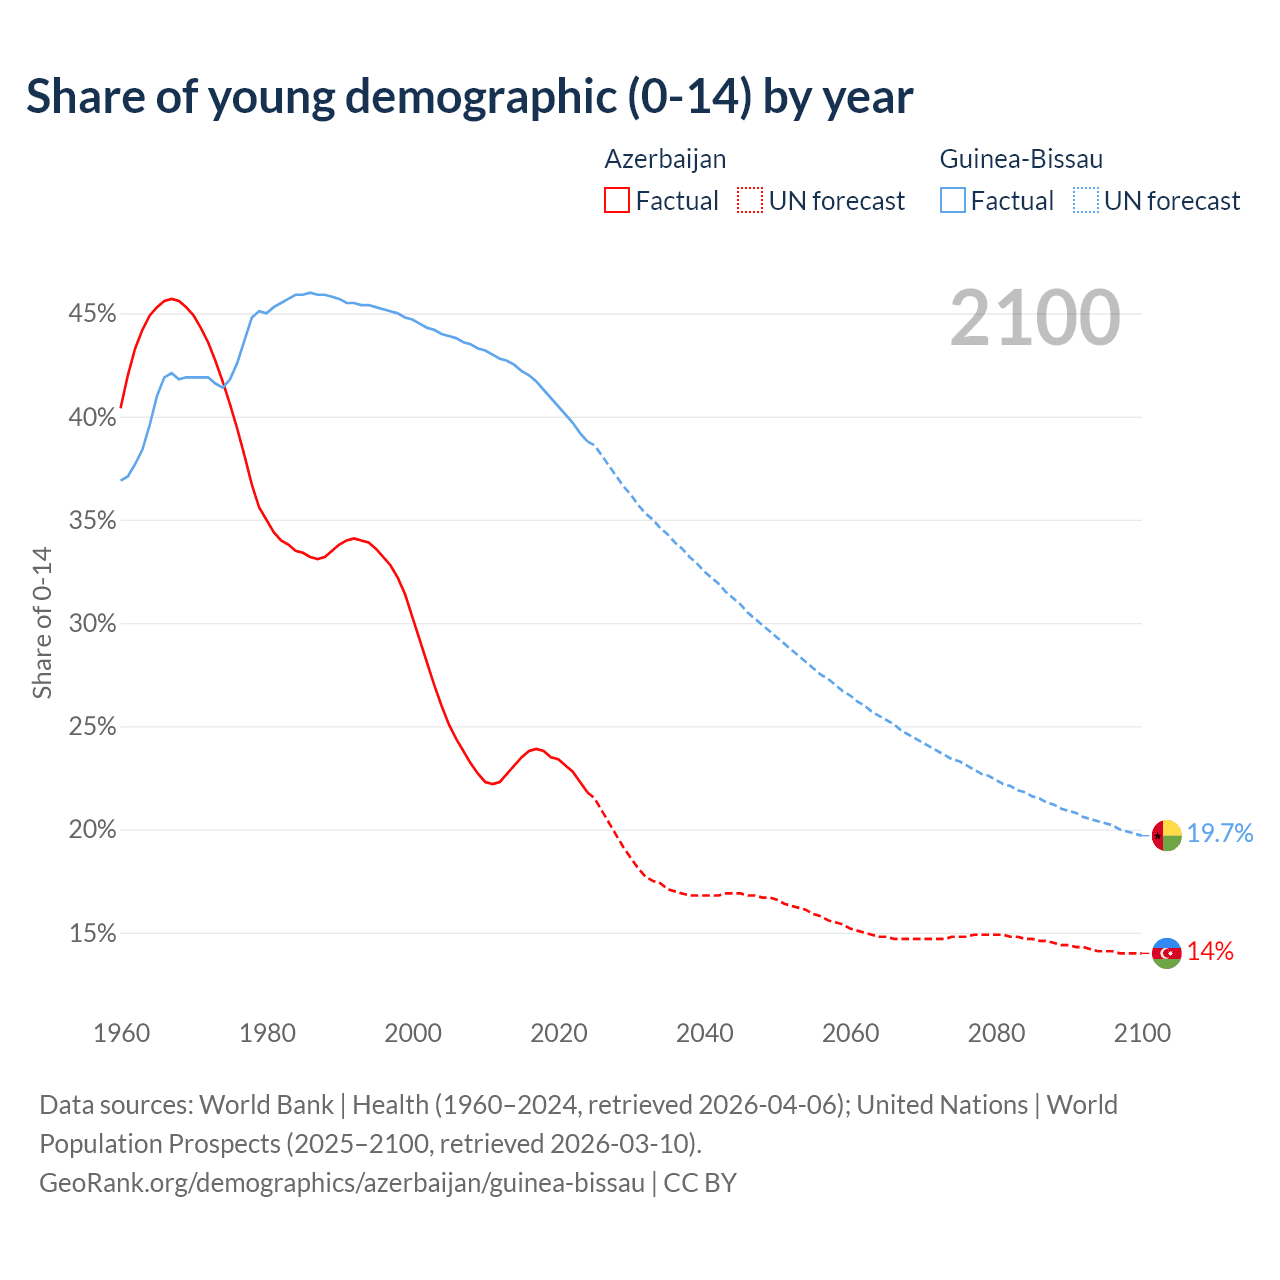
Share of young demographic (0-14) by year
| Year | Share of 0-14 | |
|---|---|---|
|
Azerbaijan
|
Guinea-Bissau
|
|
| 2100 | 14% | 19.7% |
| 2099 | 14% | 19.8% |
| 2098 | 14% | 19.9% |
| 2097 | 14% | 20% |
| 2096 | 14.1% | 20.2% |
| 2095 | 14.1% | 20.3% |
| 2094 | 14.1% | 20.4% |
| 2093 | 14.2% | 20.5% |
| 2092 | 14.3% | 20.6% |
| 2091 | 14.3% | 20.8% |
| 2090 | 14.4% | 20.9% |
| 2089 | 14.4% | 21% |
| 2088 | 14.5% | 21.2% |
| 2087 | 14.6% | 21.3% |
| 2086 | 14.6% | 21.5% |
| 2085 | 14.7% | 21.6% |
| 2084 | 14.7% | 21.8% |
| 2083 | 14.8% | 21.9% |
| 2082 | 14.8% | 22.1% |
| 2081 | 14.9% | 22.2% |
| 2080 | 14.9% | 22.4% |
| 2079 | 14.9% | 22.6% |
| 2078 | 14.9% | 22.7% |
| 2077 | 14.9% | 22.9% |
| 2076 | 14.8% | 23.1% |
| 2075 | 14.8% | 23.3% |
| 2074 | 14.8% | 23.4% |
| 2073 | 14.7% | 23.6% |
| 2072 | 14.7% | 23.8% |
| 2071 | 14.7% | 24% |
| 2070 | 14.7% | 24.2% |
| 2069 | 14.7% | 24.4% |
| 2068 | 14.7% | 24.6% |
| 2067 | 14.7% | 24.8% |
| 2066 | 14.7% | 25.1% |
| 2065 | 14.8% | 25.3% |
| 2064 | 14.8% | 25.5% |
| 2063 | 14.9% | 25.7% |
| 2062 | 15% | 26% |
| 2061 | 15.1% | 26.2% |
| 2060 | 15.2% | 26.5% |
| 2059 | 15.4% | 26.7% |
| 2058 | 15.5% | 27% |
| 2057 | 15.6% | 27.3% |
| 2056 | 15.8% | 27.5% |
| 2055 | 15.9% | 27.8% |
| 2054 | 16.1% | 28.1% |
| 2053 | 16.2% | 28.4% |
| 2052 | 16.3% | 28.7% |
| 2051 | 16.4% | 29% |
| 2050 | 16.6% | 29.3% |
| 2049 | 16.7% | 29.6% |
| 2048 | 16.7% | 29.9% |
| 2047 | 16.8% | 30.2% |
| 2046 | 16.8% | 30.5% |
| 2045 | 16.9% | 30.9% |
| 2044 | 16.9% | 31.2% |
| 2043 | 16.9% | 31.5% |
| 2042 | 16.8% | 31.9% |
| 2041 | 16.8% | 32.2% |
| 2040 | 16.8% | 32.5% |
| 2039 | 16.8% | 32.9% |
| 2038 | 16.8% | 33.2% |
| 2037 | 16.9% | 33.6% |
| 2036 | 17% | 33.9% |
| 2035 | 17.1% | 34.3% |
| 2034 | 17.4% | 34.6% |
| 2033 | 17.5% | 35% |
| 2032 | 17.7% | 35.3% |
| 2031 | 18.1% | 35.7% |
| 2030 | 18.6% | 36.2% |
| 2029 | 19.1% | 36.6% |
| 2028 | 19.7% | 37.1% |
| 2027 | 20.3% | 37.6% |
| 2026 | 20.9% | 38.1% |
| 2025 | 21.2% | 38.3% |
| 2024 | 21.8% | 38.8% |
| 2023 | 22.3% | 39.2% |
| 2022 | 22.8% | 39.7% |
| 2021 | 23.1% | 40.1% |
| 2020 | 23.4% | 40.5% |
| 2019 | 23.5% | 40.9% |
| 2018 | 23.8% | 41.3% |
| 2017 | 23.9% | 41.7% |
| 2016 | 23.8% | 42% |
| 2015 | 23.5% | 42.2% |
| 2014 | 23.1% | 42.5% |
| 2013 | 22.7% | 42.7% |
| 2012 | 22.3% | 42.8% |
| 2011 | 22.2% | 43% |
| 2010 | 22.3% | 43.2% |
| 2009 | 22.7% | 43.3% |
| 2008 | 23.2% | 43.5% |
| 2007 | 23.8% | 43.6% |
| 2006 | 24.4% | 43.8% |
| 2005 | 25.1% | 43.9% |
| 2004 | 26% | 44% |
| 2003 | 27% | 44.2% |
| 2002 | 28.1% | 44.3% |
| 2001 | 29.2% | 44.5% |
| 2000 | 30.3% | 44.7% |
| 1999 | 31.4% | 44.8% |
| 1998 | 32.2% | 45% |
| 1997 | 32.8% | 45.1% |
| 1996 | 33.2% | 45.2% |
| 1995 | 33.6% | 45.3% |
| 1994 | 33.9% | 45.4% |
| 1993 | 34% | 45.4% |
| 1992 | 34.1% | 45.5% |
| 1991 | 34% | 45.5% |
| 1990 | 33.8% | 45.7% |
| 1989 | 33.5% | 45.8% |
| 1988 | 33.2% | 45.9% |
| 1987 | 33.1% | 45.9% |
| 1986 | 33.2% | 46% |
| 1985 | 33.4% | 45.9% |
| 1984 | 33.5% | 45.9% |
| 1983 | 33.8% | 45.7% |
| 1982 | 34% | 45.5% |
| 1981 | 34.4% | 45.3% |
| 1980 | 35% | 45% |
| 1979 | 35.6% | 45.1% |
| 1978 | 36.7% | 44.8% |
| 1977 | 38.1% | 43.7% |
| 1976 | 39.4% | 42.6% |
| 1975 | 40.6% | 41.8% |
| 1974 | 41.7% | 41.4% |
| 1973 | 42.7% | 41.6% |
| 1972 | 43.6% | 41.9% |
| 1971 | 44.3% | 41.9% |
| 1970 | 44.9% | 41.9% |
| 1969 | 45.3% | 41.9% |
| 1968 | 45.6% | 41.8% |
| 1967 | 45.7% | 42.1% |
| 1966 | 45.6% | 41.9% |
| 1965 | 45.3% | 41% |
| 1964 | 44.9% | 39.6% |
| 1963 | 44.2% | 38.4% |
| 1962 | 43.3% | 37.7% |
| 1961 | 42% | 37.1% |
| 1960 | 40.4% | 36.9% |
Data sources: World Bank | Health (1960–2025, retrieved 2026-07-08); United Nations | World Population Prospects (2026–2100, retrieved 2026-07-08).
GeoRank.org/demographics/azerbaijan/guinea-bissau | CC BY
The share of young people aged below 15 is 21.2% in Azerbaijan and 38.3% in Guinea-Bissau. Birth rates in Azerbaijan compared to Guinea-Bissau .
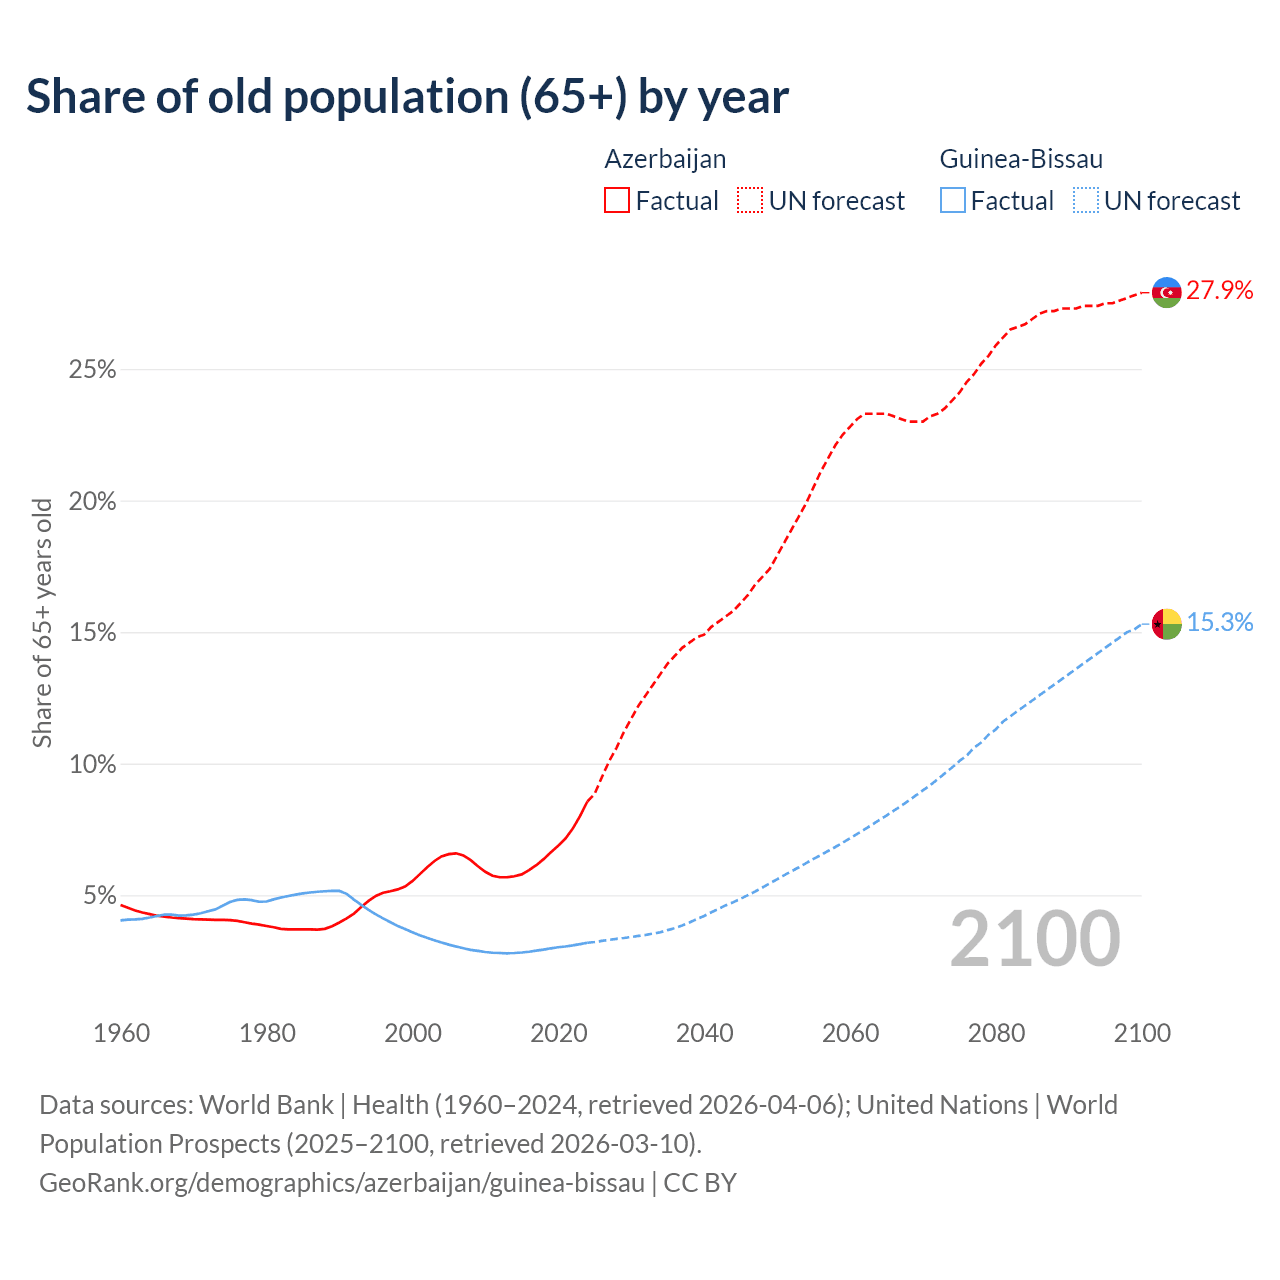
Share of old population (65+) by year
| Year | Share of 65+ years old | |
|---|---|---|
|
Azerbaijan
|
Guinea-Bissau
|
|
| 2100 | 27.9% | 15.3% |
| 2099 | 27.8% | 15.1% |
| 2098 | 27.7% | 15% |
| 2097 | 27.6% | 14.8% |
| 2096 | 27.5% | 14.6% |
| 2095 | 27.5% | 14.4% |
| 2094 | 27.4% | 14.2% |
| 2093 | 27.4% | 14% |
| 2092 | 27.4% | 13.8% |
| 2091 | 27.3% | 13.6% |
| 2090 | 27.3% | 13.4% |
| 2089 | 27.3% | 13.2% |
| 2088 | 27.2% | 13% |
| 2087 | 27.2% | 12.8% |
| 2086 | 27.1% | 12.6% |
| 2085 | 26.9% | 12.4% |
| 2084 | 26.7% | 12.2% |
| 2083 | 26.6% | 12% |
| 2082 | 26.5% | 11.8% |
| 2081 | 26.2% | 11.6% |
| 2080 | 25.9% | 11.3% |
| 2079 | 25.5% | 11.1% |
| 2078 | 25.2% | 10.8% |
| 2077 | 24.8% | 10.6% |
| 2076 | 24.5% | 10.3% |
| 2075 | 24.1% | 10.1% |
| 2074 | 23.8% | 9.85% |
| 2073 | 23.5% | 9.63% |
| 2072 | 23.3% | 9.4% |
| 2071 | 23.2% | 9.18% |
| 2070 | 23% | 8.98% |
| 2069 | 23% | 8.78% |
| 2068 | 23% | 8.58% |
| 2067 | 23.1% | 8.39% |
| 2066 | 23.2% | 8.21% |
| 2065 | 23.3% | 8.02% |
| 2064 | 23.3% | 7.85% |
| 2063 | 23.3% | 7.67% |
| 2062 | 23.3% | 7.5% |
| 2061 | 23.1% | 7.33% |
| 2060 | 22.8% | 7.16% |
| 2059 | 22.5% | 6.99% |
| 2058 | 22.1% | 6.83% |
| 2057 | 21.6% | 6.68% |
| 2056 | 21.1% | 6.52% |
| 2055 | 20.5% | 6.38% |
| 2054 | 19.9% | 6.22% |
| 2053 | 19.4% | 6.06% |
| 2052 | 18.9% | 5.91% |
| 2051 | 18.4% | 5.76% |
| 2050 | 17.9% | 5.6% |
| 2049 | 17.4% | 5.45% |
| 2048 | 17.1% | 5.29% |
| 2047 | 16.8% | 5.14% |
| 2046 | 16.4% | 5% |
| 2045 | 16.1% | 4.86% |
| 2044 | 15.8% | 4.73% |
| 2043 | 15.6% | 4.62% |
| 2042 | 15.4% | 4.48% |
| 2041 | 15.2% | 4.35% |
| 2040 | 14.9% | 4.21% |
| 2039 | 14.8% | 4.09% |
| 2038 | 14.6% | 3.96% |
| 2037 | 14.4% | 3.85% |
| 2036 | 14.1% | 3.75% |
| 2035 | 13.8% | 3.67% |
| 2034 | 13.4% | 3.59% |
| 2033 | 13% | 3.54% |
| 2032 | 12.6% | 3.49% |
| 2031 | 12.2% | 3.45% |
| 2030 | 11.7% | 3.41% |
| 2029 | 11.2% | 3.37% |
| 2028 | 10.6% | 3.34% |
| 2027 | 10.1% | 3.3% |
| 2026 | 9.49% | 3.26% |
| 2025 | 9.17% | 3.24% |
| 2024 | 8.56% | 3.19% |
| 2023 | 8.01% | 3.14% |
| 2022 | 7.53% | 3.09% |
| 2021 | 7.15% | 3.05% |
| 2020 | 6.88% | 3.02% |
| 2019 | 6.63% | 2.98% |
| 2018 | 6.37% | 2.93% |
| 2017 | 6.14% | 2.89% |
| 2016 | 5.95% | 2.85% |
| 2015 | 5.79% | 2.82% |
| 2014 | 5.72% | 2.8% |
| 2013 | 5.68% | 2.79% |
| 2012 | 5.68% | 2.8% |
| 2011 | 5.74% | 2.81% |
| 2010 | 5.89% | 2.84% |
| 2009 | 6.1% | 2.88% |
| 2008 | 6.33% | 2.92% |
| 2007 | 6.51% | 2.98% |
| 2006 | 6.59% | 3.05% |
| 2005 | 6.56% | 3.12% |
| 2004 | 6.47% | 3.2% |
| 2003 | 6.29% | 3.29% |
| 2002 | 6.05% | 3.38% |
| 2001 | 5.79% | 3.48% |
| 2000 | 5.53% | 3.59% |
| 1999 | 5.33% | 3.71% |
| 1998 | 5.22% | 3.83% |
| 1997 | 5.15% | 3.97% |
| 1996 | 5.09% | 4.12% |
| 1995 | 4.97% | 4.27% |
| 1994 | 4.78% | 4.44% |
| 1993 | 4.55% | 4.63% |
| 1992 | 4.3% | 4.83% |
| 1991 | 4.12% | 5.05% |
| 1990 | 3.96% | 5.16% |
| 1989 | 3.82% | 5.16% |
| 1988 | 3.72% | 5.15% |
| 1987 | 3.69% | 5.13% |
| 1986 | 3.7% | 5.1% |
| 1985 | 3.7% | 5.07% |
| 1984 | 3.7% | 5.02% |
| 1983 | 3.7% | 4.97% |
| 1982 | 3.72% | 4.91% |
| 1981 | 3.78% | 4.84% |
| 1980 | 3.83% | 4.76% |
| 1979 | 3.88% | 4.75% |
| 1978 | 3.92% | 4.81% |
| 1977 | 3.97% | 4.84% |
| 1976 | 4.02% | 4.82% |
| 1975 | 4.05% | 4.74% |
| 1974 | 4.06% | 4.6% |
| 1973 | 4.06% | 4.46% |
| 1972 | 4.07% | 4.39% |
| 1971 | 4.08% | 4.31% |
| 1970 | 4.09% | 4.26% |
| 1969 | 4.11% | 4.23% |
| 1968 | 4.13% | 4.22% |
| 1967 | 4.15% | 4.26% |
| 1966 | 4.18% | 4.26% |
| 1965 | 4.22% | 4.21% |
| 1964 | 4.28% | 4.15% |
| 1963 | 4.34% | 4.1% |
| 1962 | 4.42% | 4.08% |
| 1961 | 4.52% | 4.07% |
| 1960 | 4.63% | 4.04% |
Data sources: World Bank | Health (1960–2025, retrieved 2026-07-08); United Nations | World Population Prospects (2026–2100, retrieved 2026-07-08).
GeoRank.org/demographics/azerbaijan/guinea-bissau | CC BY
The share of older people aged 65 and over is 9.17% in Azerbaijan and 3.24% in Guinea-Bissau. Life expectancy in Azerbaijan compared to Guinea-Bissau .
Compare countries by 7 more topics
Demographics by nationality or race
|
Azerbaijan
|
|
|---|---|
| Race | Share of demographic |
| Azerbaijani | 94.8% |
| Talish | 0.88% |
| Russian | 0.71% |
| Avar | 0.49% |
| Turkish | 0.31% |
| Tats | 0.28% |
| Tatar | 0.18% |
| Ukrainian | 0.14% |
| Sakhur | 0.13% |
| Georgian | 0.08% |
| Jewish | 0.05% |
| Kurd | 0.04% |
| Udin | 0.04% |
| Armenian | 0.002% |
| All other | 1.84% |
Religion demographics in Azerbaijan vs Guinea-Bissau
|
Azerbaijan
|
|
|---|---|
| Religion | Share of population |
| Islam | 94.7% |
| Atheism | 4.76% |
| Christianity | 0.42% |
| Judaism | 0.08% |
| Hinduism | 0.007% |
| Buddhism | 0.002% |
|
Guinea-Bissau
|
|
|---|---|
| Religion | Share of population |
| Islam | 56% |
| Christianity | 21.7% |
| Atheism | 11.6% |
| All other | 10.7% |
Median age map
Data sources: World Bank | Health (1960–2025, retrieved 2026-07-08); U.S. Census Bureau (1960–2025, retrieved 2026-07-08).
GeoRank.org/demographics/azerbaijan/guinea-bissau | CC BY
Help us show the world through your eyes
Share a photo of your city and help others discover what it looks like to live there. Your contribution makes our data come alive.
Data sources:
- World Bank | Health (1960–2025, retrieved 2026-07-08)
- United Nations | World Population Prospects (2026–2100, retrieved 2026-07-08)
- U.S. Census Bureau (1960–2025, retrieved 2026-07-08)
- United Nations | Demographics & Social Statistics (2022, retrieved 2026-07-08)
- Pew Research Center (2020, retrieved 2026-07-08)
Creative Commons Attribution (CC BY) — you’re free to copy, share, remix, adapt, and use even commercially as long as you give appropriate credit and clearly indicate if you made changes. Other sources may be subject to different license terms.